Cutten School Accountability Report Card
Cutten School Accountability Report Card
Cutten School Accountability Report Card

You also want an ePaper? Increase the reach of your titles
YUMPU automatically turns print PDFs into web optimized ePapers that Google loves.
<strong>Cutten</strong> <strong>School</strong><br />
2011-12 <strong>School</strong> <strong>Accountability</strong> <strong>Report</strong> <strong>Card</strong> — Published During the 2012-13 <strong>School</strong> Year<br />
4182 Walnut Drive Eureka, CA 95503<br />
Phone: (707) 441-3900<br />
Fax: (707) 441-3906<br />
GRADES 3-6<br />
www.humboldt.k12.ca.us/cuen_sd/cuen.php<br />
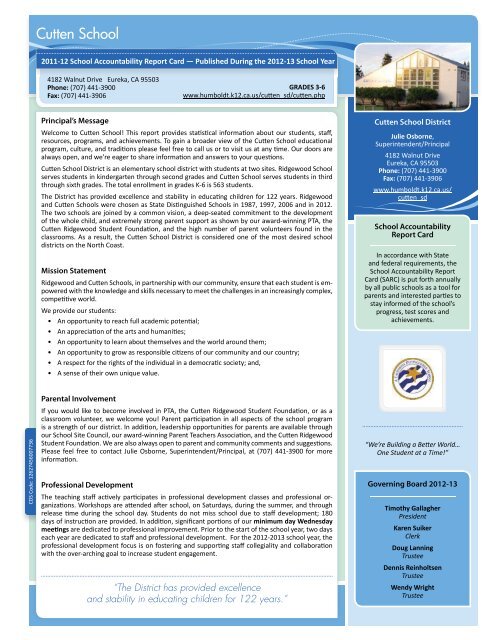
Principal’s Message<br />
Welcome to Cuen <strong>School</strong>! This report provides stascal informaon about our students, staff,<br />
resources, programs, and achievements. To gain a broader view of the Cuen <strong>School</strong> educaonal<br />
program, culture, and tradions please feel free to call us or to visit us at any me. Our doors are<br />
always open, and we’re eager to share informaon and answers to your quesons.<br />
Cuen <strong>School</strong> District is an elementary school district with students at two sites. Ridgewood <strong>School</strong><br />
serves students in kindergarten through second grades and Cuen <strong>School</strong> serves students in third<br />
through sixth grades. The total enrollment in grades K-6 is 563 students.<br />
The District has provided excellence and stability in educang children for 122 years. Ridgewood<br />
and Cuen <strong>School</strong>s were chosen as State Disnguished <strong>School</strong>s in 1987, 1997, 2006 and in 2012.<br />
The two schools are joined by a common vision, a deep-seated commitment to the development<br />
of the whole child, and extremely strong parent support as shown by our award-winning PTA, the<br />
Cuen Ridgewood Student Foundaon, and the high number of parent volunteers found in the<br />
classrooms. As a result, the Cuen <strong>School</strong> District is considered one of the most desired school<br />
districts on the North Coast.<br />
Mission Statement<br />
Ridgewood and Cuen <strong>School</strong>s, in partnership with our community, ensure that each student is empowered<br />
with the knowledge and skills necessary to meet the challenges in an increasingly complex,<br />
compeve world.<br />
We provide our students:<br />
• An opportunity to reach full academic potenal;<br />
• An appreciaon of the arts and humanies;<br />
• An opportunity to learn about themselves and the world around them;<br />
• An opportunity to grow as responsible cizens of our community and our country;<br />
• A respect for the rights of the individual in a democrac society; and,<br />
• A sense of their own unique value.<br />
<strong>Cutten</strong> <strong>School</strong> District<br />
Julie Osborne,<br />
Superintendent/Principal<br />
4182 Walnut Drive<br />
Eureka, CA 95503<br />
Phone: (707) 441-3900<br />
Fax: (707) 441-3906<br />
www.humboldt.k12.ca.us/<br />
cuen_sd<br />
<strong>School</strong> <strong>Accountability</strong><br />
<strong>Report</strong> <strong>Card</strong><br />
In accordance with State<br />
and federal requirements, the<br />
<strong>School</strong> <strong>Accountability</strong> <strong>Report</strong><br />
<strong>Card</strong> (SARC) is put forth annually<br />
by all public schools as a tool for<br />
parents and interested pares to<br />
stay informed of the school’s<br />
progress, test scores and<br />
achievements.<br />
CDS Code: 12627456007736<br />
Parental Involvement<br />
If you would like to become involved in PTA, the Cuen Ridgewood Student Foundaon, or as a<br />
classroom volunteer, we welcome you! Parent parcipaon in all aspects of the school program<br />
is a strength of our district. In addion, leadership opportunies for parents are available through<br />
our <strong>School</strong> Site Council, our award-winning Parent Teachers Associaon, and the Cuen Ridgewood<br />
Student Foundaon. We are also always open to parent and community comments and suggesons.<br />
Please feel free to contact Julie Osborne, Superintendent/Principal, at (707) 441-3900 for more<br />
informaon.<br />
Professional Development<br />
The teaching staff acvely parcipates in professional development classes and professional organizaons.<br />
Workshops are aended aer school, on Saturdays, during the summer, and through<br />
release me during the school day. Students do not miss school due to staff development; 180<br />
days of instrucon are provided. In addion, significant porons of our minimum day Wednesday<br />
meengs are dedicated to professional improvement. Prior to the start of the school year, two days<br />
each year are dedicated to staff and professional development. For the 2012-2013 school year, the<br />
professional development focus is on fostering and supporng staff collegiality and collaboraon<br />
with the over-arching goal to increase student engagement.<br />
“The District has provided excellence<br />
and stability in educating children for 122 years.”<br />
“We’re Building a Beer World…<br />
One Student at a Time!”<br />
Governing Board 2012-13<br />
Timothy Gallagher<br />
President<br />
Karen Suiker<br />
Clerk<br />
Doug Lanning<br />
Trustee<br />
Dennis Reinholtsen<br />
Trustee<br />
Wendy Wright<br />
Trustee
<strong>Cutten</strong> <strong>School</strong> • 2011-12 SARC<br />
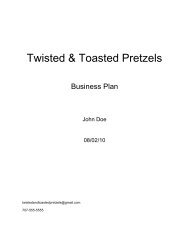
Class Size<br />
Class Size Distribution — Average Class Size<br />
Three-Year Data Comparison<br />
09-10 10-11 11-12<br />
28<br />
26 27 27 28 28 28<br />
25 26<br />
27<br />
22 22<br />
23<br />
26<br />
Class Size<br />
2<br />
The bar graph displays the three-year<br />
data for average class size and the table<br />
displays the three-year data for the<br />
number of classrooms by size.<br />
3 4 5 6 3-4 Combo 5-6 Combo<br />
Class Size Distribution — Number of Classrooms by Size<br />
Three-Year Data Comparison<br />
09-10 10-11 11-12<br />
Grade 1-20 21-32 33+ 1-20 21-32 33+ 1-20 21-32 33+<br />
2011-12 12 SARC<br />
3 3 3 3<br />
4 2 3 3<br />
5 3 2 2<br />
6 3 3 2<br />
3-4 (Combo) 1<br />
5-6 (Combo) 1<br />
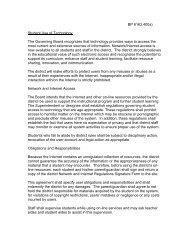
Enrollment and Demographics<br />
The total enrollment at the school was 299 students for the 2011-12 school year.*<br />
Demographics<br />
White<br />
65%<br />
Black or African<br />
American<br />
1%<br />
Asian<br />
3%<br />
2011-12 <strong>School</strong> Year<br />
Two or More<br />
Races No Response<br />
13% 1% Hispanic or<br />
Latino<br />
12%<br />
American Indian<br />
or Alaska Native<br />
4%<br />
Native Hawaiian<br />
or Pacific<br />
Islander<br />
Filipino
<strong>Cutten</strong> <strong>School</strong> • 2011-12 SARC<br />
3<br />
<strong>School</strong> Facility Items Inspected<br />
The tables show the results of the school’s most recent inspecon using the Facility Inspecon Tool<br />
(FIT) or equivalent school form. The following is a list of items inspected.<br />
• Systems: Gas Systems and Pipes, Sewer,<br />
Mechanical Systems (heang, venlaon,<br />
and air condioning)<br />
• Interior: Interior Surfaces (floors,<br />
ceilings, walls, and window casings)<br />
• Cleanliness: Pest/Vermin Control, Overall<br />
Cleanliness (school grounds, buildings,<br />
rooms, and common areas)<br />
• Electrical: Electrical Systems<br />
(interior and exterior)<br />
• Restrooms/Fountains: Restrooms,<br />
Sinks/Drinking Fountains (interior<br />
and exterior)<br />
• Safety: Fire Safety Equipment,<br />
Emergency Systems, Hazardous<br />
Materials (interior and exterior)<br />
• Structural: Structural Condion,<br />
Roofs<br />
• External: Windows/Doors/Gates/Fences,<br />
Playgrounds/<strong>School</strong> Grounds<br />
<strong>School</strong> Facility Good Repair Status<br />
This inspecon determines the school facility’s good repair status using rangs of good condion,<br />
fair condion, or poor condion. The overall summary of facility condions uses rangs of exemplary,<br />
good, fair, or poor condion.<br />
<strong>School</strong> Facility Good Repair Status<br />
2012-13 <strong>School</strong> Year<br />
Items Inspected Repair Status Items Inspected Repair Status<br />
Systems Good Restrooms/Fountains Good<br />
Interior Good Safety Good<br />
Cleanliness Good Structural Good<br />
Electrical Good External Good<br />
Public Internet Access<br />
Internet access is available at public<br />
libraries and other locaons that are<br />
publicly accessible (i.e., the California<br />
State Library). Access to the Internet<br />
at libraries and public locaons is<br />
generally provided on a first-come,<br />
first-served basis. Other use restricons<br />
include the hours of operaon, the<br />
length of me that a workstaon may<br />
be used (depending on availability),<br />
the types of soware programs available<br />
at a workstaon, and the ability<br />
to print documents.<br />
Overall Summary of Facility Condions<br />
Good<br />
Date of the Most Recent <strong>School</strong> Site Inspecon 12/17/2012<br />
Date of the Most Recent Compleon of the Inspecon Form 12/17/2012<br />
Deficiencies and Repairs<br />
The table lists the repairs required for all deficiencies found during the school site inspecon. Regardless<br />
of each item’s repair status, all deficiencies are listed.<br />
Deficiencies and Repairs<br />
Items Inspected<br />
2012-13 <strong>School</strong> Year<br />
Deficiencies, Acon Taken or Planned, and Date of Acon<br />
2011-12 12 SARC<br />
Systems Single classroom heater replaced 11/2012.<br />
<strong>School</strong> Facilities<br />
Cuen <strong>School</strong> provides a safe, clean, tobacco-free educaonal environment for students. One maintenance<br />
employee and two custodians ensure the good condion and cleanliness of our buildings,<br />
restrooms, and grounds. All classrooms and support services rooms are equipped with a telephone,<br />
an intercom system, and access to the Internet. A security system is present to protect every room.<br />
Visitors are welcomed at Cuen <strong>School</strong> and sign in at the school office. Due to the close-knit nature<br />
of our school, unfamiliar visitors on campus are very rare and are immediately greeted by school<br />
personnel.<br />
Cuen Elementary <strong>School</strong> was built in 1951. The school has eleven regular classrooms, a library, a<br />
computer lab, a mulpurpose room, a student support resource room, a tutoring center, a music<br />
room, and an aer-school program room. One relocatable classroom was purchased during the<br />
2005-06 school year to meet the needs of increased student enrollment.<br />
Connued on sidebar<br />
<strong>School</strong> Facilities<br />
Connued from boom le<br />
Another relocatable was added in 2007<br />
to house the speech/language and tutoring<br />
programs. Facilies also include<br />
two baseball fields, a mul-dimensional<br />
playground structure, three wall ball<br />
courts, and a large athlec field.<br />
Our Internet wiring infrastructure at<br />
Cuen was recently replaced and our<br />
electrical capacity was increased using<br />
Deferred Maintenance Funding. Addional<br />
computer “drops” were also<br />
added in all classrooms, allowing more<br />
convenient teacher/student access to<br />
the Internet.
<strong>Cutten</strong> <strong>School</strong> • 2011-12 SARC<br />
4<br />
Textbooks and Instructional Materials<br />
The Cuen Elementary <strong>School</strong> District connually reviews and updates its textbooks and instruc-<br />
onal materials in order to ensure that they:<br />
1. Are available in sufficient numbers;<br />
2. Are consistent with the content and cycles of the State Curriculum Frameworks;<br />
3. Have been adopted by the State Board of Educaon; and,<br />
4. Are the best possible tools for supporng the curriculum.<br />
Teachers and administrators are all involved in the selecon process. Decisions are also reviewed by<br />
our <strong>School</strong> Site Council. The most recent public hearing held to adopt a resoluon on the sufficiency<br />
of instruconal materials was September 10, 2012.<br />
Textbooks and Instructional Materials List<br />
2012-13 <strong>School</strong> Year<br />
Subject Textbook Adopted<br />
English-Language Arts Houghton Mifflin 2002<br />
English-Language Arts Write Source 1999<br />
Mathemacs Sco Foresman 2008<br />
Science Full Opon Science System (FOSS) (3-5) 2007<br />
Science Sco Foresman (6) 2007<br />
History-Social Science Sco Foresman (3-5) 2006<br />
History-Social Science Teachers’ Curriculum Instute (6) 2006<br />
Availability of Textbooks and Instructional Materials<br />
The following lists the percentage of pupils who lack their own assigned textbooks and instruconal<br />
materials.<br />
Percentage of Students Lacking Materials by Subject<br />
Subject<br />
2012-13 <strong>School</strong> Year<br />
Cuen <strong>School</strong><br />
Percent Lacking<br />
Reading/Language Arts 0%<br />
Mathemacs 0%<br />
Science 0%<br />
Quality of Textbooks<br />
The following table outlines the criteria<br />
required for choosing textbooks and<br />
instruconal materials.<br />
Quality of Textbooks<br />
2012-13 <strong>School</strong> Year<br />
Criteria<br />
Yes/No<br />
Are the textbooks adopted<br />
from the most recent<br />
state-approved or local No<br />
governing board approved<br />
list?<br />
Are the textbooks<br />
consistent with the<br />
content and cycles of the<br />
Yes<br />
curriculum frameworks<br />
adopted by the State<br />
Board of Educaon?<br />
Does every student,<br />
including English Learners,<br />
have access to their own<br />
Yes<br />
textbooks and instruconal<br />
materials to use in class<br />
and to take home?<br />
History-Social Science 0%<br />
Visual and Performing Arts<br />
<br />
2011-12 12 SARC<br />
Foreign Language<br />
Health<br />
<br />
<br />
Currency of Textbook Data<br />
This table displays the date when the textbook and instruconal materials informaon was collected<br />
and verified.<br />
2012-13 <strong>School</strong> Year<br />
Currency of Textbook Data<br />
Data Collecon Date 09/2012<br />
Not applicable.<br />
The Cuen <strong>School</strong> District did not purchase English/Language Arts materials at the 2008 adopon due<br />
to budget constraints; however all materials are consistent with current framework and state standards.
<strong>Cutten</strong> <strong>School</strong> • 2011-12 SARC<br />
STAR Results for All Students<br />
The Standardized Tesng and Reporng (STAR) results are evaluated and compared to state standards<br />
using the following five performance levels: Advanced (exceeds state standards); Proficient<br />
(meets state standards); Basic; Below Basic; and Far Below Basic. Students scoring at the Proficient<br />
or Advanced level meet state standards in that content area. The tables show the percentage of<br />
students that scored at Proficient or Advanced levels in English-language arts, mathemacs, and<br />
science.<br />
Students Scoring at Proficient or Advanced Levels<br />
STAR Results by Student Group:<br />
English-Language Arts, Mathematics, and Science<br />
Students Scoring at Proficient or Advanced Levels<br />
Group<br />
Cuen <strong>School</strong><br />
(Grades 3-6)<br />
Cuen <strong>School</strong> District<br />
(Grades 2-6)<br />
English-<br />
Language Arts<br />
Three-Year Data Comparison<br />
Mathemacs<br />
California<br />
Subject 09-10 10-11 11-12 09-10 10-11 11-12 09-10 10-11 11-12<br />
English-Language Arts 63% 65% 72% 62% 66% 69% 52% 54% 56%<br />
Mathemacs 67% 72% 74% 69% 74% 72% 48% 50% 51%<br />
Science (Grade 5) 72% 74% 69% 72% 74% 69% 54% 57% 60%<br />
Spring 2012 Results<br />
Science<br />
(Grade 5)<br />
All Students in the District (Grades 2-6) 69% 72% 69%<br />
All Students at the <strong>School</strong> (Grades 3-6) 72% 74% 69%<br />
Male 74% 78% 83%<br />
Female 70% 70% 58%<br />
Black or African American <br />
American Indian or Alaska Nave <br />
Asian <br />
Filipino <br />
Hispanic or Lano 82% 76% <br />
5<br />
Standardized Testing and<br />
<strong>Report</strong>ing Program<br />
Based upon single point-in-me, mul-<br />
ple choice test.<br />
The Standardized Tesng and <strong>Report</strong>ing<br />
(STAR) Program aims to idenfy<br />
strengths and weaknesses to improve<br />
student learning. STAR consists of<br />
several key tests that are designed for<br />
the student’s age and individual needs.<br />
These tests include: the California<br />
Standards Test (CST), California Modified<br />
Assessment (CMA), and California<br />
Alternate Performance Assessment<br />
(CAPA).<br />
The CSTs are mulple choice tests in<br />
English-language arts, mathemacs,<br />
science, and history-social science<br />
for varying grade levels. The fourth<br />
grade parcipates in an essay wring<br />
test. The CSTs are used to determine<br />
students’ achievement of the California<br />
Academic Content Standards. These<br />
standards describe the knowledge and<br />
skills that students are expected to<br />
learn at each grade level and subject.<br />
The CMA is a modified assessment for<br />
students with disabilies who have an<br />
individualized educaon program (IEP).<br />
It is designed to assess those students<br />
whose disabilies prevent them from<br />
achieving grade-level proficiency on an<br />
assessment of the content standards<br />
with or without accommodaons.<br />
The CAPA is an alternate assessment<br />
for students with significant cognive<br />
disabilies who are unable to take the<br />
CST with accommodaons or modifica-<br />
ons or the CMA with accommoda-<br />
ons.<br />
For more informaon on the STAR<br />
program including tests, parcipaon,<br />
groups, and scores by grade level,<br />
please visit hp://star.cde.ca.gov/.<br />
Nave Hawaiian or Pacific Islander <br />
2011-12 12 SARC<br />
White 72% 76% 72%<br />
Two or More Races 70% 68% 58%<br />
Socioeconomically Disadvantaged 64% 66% 67%<br />
English Learners <br />
Students with Disabilies 36% 61% <br />
Students Receiving<br />
Migrant Educaon Services<br />
<br />
Scores are not shown when the number of students tested is 10 or less, or because the number of<br />
students tested in this category is too small for stascal accuracy or to protect student privacy.
<strong>Cutten</strong> <strong>School</strong> • 2011-12 SARC<br />
Academic Performance Index<br />
The Academic Performance Index (API) is an annual measure of the academic performance and<br />
progress of the schools within California based solely upon the mulple choice STAR test scores. API<br />
is measured on a scale from 200 to 1,000. This score reflects the school, district or a student group’s<br />
performance level, based on the results of statewide tesng. The state has set an API score of 800<br />
as the statewide target.<br />
The annual API reporng cycle consists of the Base and Growth API. The Base API begins the reporting<br />
cycle and the results are released approximately a year aer tesng occurs (e.g. The 2011 Base<br />
API is calculated from results of statewide tesng in spring 2011, but the results are not released un-<br />
l May 2012). Growth API, calculates test results in the same fashion and with the same indicators<br />
as the Base API but from test results of the following year (e.g. The 2012 Growth API is calculated<br />
from results of statewide tesng in spring 2012 and released in September 2012). The year of the<br />
API corresponds to the year of tesng. Therefore, for the 2011-12 API reporng cycle, the 2011 Base<br />
indicator and 2012 Growth indicator are used. To represent how much a school’s API changed from<br />
2011-12 (known as the 2011-12 API Growth), the 2011 Base API is subtracted from the 2012 Growth<br />
API. The Base API <strong>Report</strong> includes the Base API, targets, and ranks. The Growth API <strong>Report</strong> includes<br />
Growth API, growth achieved, and whether or not targets were met.<br />
To learn more about API, visit the API informaon guide at www.cde.ca.gov/ta/ac/ap/documents/infoguide12.pdf<br />
and the API overview guide at www.cde.ca.gov/ta/ac/ay/documents/overview12.pdf.<br />
API Ranks<br />
API Ranks<br />
Three-Year Data Comparison<br />
2009 2010 2011<br />
Statewide API Rank 7 7 7<br />
Similar <strong>School</strong>s API Rank 6 6 5<br />
API Testing<br />
6<br />
Assessment data is reported only for<br />
numerically significant groups. To be<br />
considered numerically significant for<br />
the API, the group must have either:<br />
(1) at least 50 students with valid STAR<br />
Program scores who make up at least<br />
15% of the total valid STAR Program<br />
scores, or (2) at least 100 students with<br />
valid STAR Program scores.<br />
API Ranks<br />
<strong>School</strong>s are ranked in ten categories<br />
of equal size, called deciles, from 1<br />
(lowest) to 10 (highest) based on their<br />
API Base reports. A school’s “statewide<br />
API rank” compares its API to the APIs<br />
of all other schools statewide of the<br />
same type (elementary, middle, or<br />
high school). A “similar schools API<br />
rank” reflects how a school compares<br />
to 100 stascally matched similar<br />
schools. This table shows the school’s<br />
three-year data for statewide API rank<br />
and similar schools API rank, for which<br />
informaon is available.<br />
API Growth by Student Group<br />
This table displays, by student group, first, the 2012 Growth API at the school, district, and state level followed by the actual API change in points<br />
added or lost for the past three years at the school.<br />
2012 Growth API and Three-Year Data Comparison<br />
API Growth by Student Group<br />
Group<br />
Cuen <strong>School</strong><br />
(Grades 3-6)<br />
Number<br />
of Students<br />
Growth<br />
API<br />
2012 Growth API<br />
Cuen <strong>School</strong> District<br />
(Grades 2-6)<br />
Number Growth<br />
of Students API<br />
Number<br />
of Students<br />
California<br />
Growth<br />
API<br />
Cuen <strong>School</strong> –<br />
Actual API Change<br />
09-10 10-11 11-12<br />
All Students 284 878 365 867 4,664,264 788 +9 +9 +26<br />
Black or African American 3 5 313,201 710 • • •<br />
American Indian or Alaska Nave 9 12 777 31,606 742 • • •<br />
Asian 7 10 404,670 905 • • •<br />
Filipino 2 2 124,824 869 • • •<br />
2011-12 12 SARC<br />
Hispanic or Lano 32 882 37 872 2,425,230 740 • • •<br />
Nave Hawaiian or Pacific Islander 0 0 26,563 775 • • •<br />
White 186 884 237 876 1,221,860 853 +2 +11 +26<br />
Two or More Races 40 884 54 872 88,428 849 • • •<br />
Socioeconomically Disadvantaged 113 842 149 827 2,779,680 737 +6 +20 +32<br />
English Learners 3 7 1,530,297 716 • • •<br />
Students with Disabilies 39 767 52 737 530,935 607 • • •<br />
•Data are reported only for numerically significant groups.<br />
Scores are not shown when the number of students tested is 10 or less, or because the number of students tested in this category is too small for stascal<br />
accuracy or to protect student privacy.
<strong>Cutten</strong> <strong>School</strong> • 2011-12 SARC<br />
Adequate Yearly Progress<br />
The Federal No Child Le Behind (NCLB) Act requires that all schools and districts meet Adequate<br />
Yearly Progress (AYP) requirements. California public schools and districts are required to meet or<br />
exceed criteria in these four target areas:<br />
1. Parcipaon rate on statewide assessments in English-language arts and mathemacs<br />
2. Percentage of students scoring proficient on statewide assessments in English-language arts<br />
and mathemacs<br />
3. API scores<br />
4. Graduaon rate for high schools<br />
The table displays whether or not the school and district met each of the AYP criteria and made<br />
overall AYP for 2011-12. For more informaon, visit www.cde.ca.gov/ta/ac/ay/.<br />
Adequate Yearly Progress Criteria<br />
2011-12 <strong>School</strong> Year<br />
Cuen <strong>School</strong> (Grades 3-6) Cuen <strong>School</strong> District (Grades 2-6)<br />
Met Overall AYP Yes No<br />
AYP Criteria<br />
English-<br />
Language Arts<br />
Mathemacs<br />
English-<br />
Language Arts<br />
Mathemacs<br />
Parcipaon Rate Yes Yes Yes Yes<br />
Percent Proficient Yes Yes Yes No<br />
API Yes Yes<br />
Graduaon Rate <br />
Federal Intervention Program<br />
Districts and schools receiving Title I funding that fail to meet AYP over two consecuve years in the<br />
same content area (English-language arts or mathemacs) or on the same indicator (API or gradua-<br />
on rate) can enter into Program Improvement (PI). Each addional year that the district or schools<br />
do not meet AYP results in advancement to the next level of intervenon. This table displays the<br />
2012-13 Program Improvement status for the school and district. For more informaon, please visit<br />
www.cde.ca.gov/ta/ac/ay/.<br />
Types of Services Funded<br />
7<br />
In the Cuen Elementary <strong>School</strong> District,<br />
in addion to regular classroom<br />
instrucon, we parcipate in the following<br />
programs:<br />
• Aer <strong>School</strong> Child Care<br />
• Class Size Reducon<br />
• Computer Educaon<br />
• Counseling<br />
• Drug Free <strong>School</strong><br />
• Economic Impact Aid (EIA)<br />
• English Learners<br />
• Gied and Talented Educaon<br />
(GATE)<br />
• Improving Teacher Quality<br />
• Library<br />
• Loery – Instruconal Materials<br />
• Music<br />
• Speech and Language Pathologist<br />
• Rural Educaon Achievement<br />
• <strong>School</strong> Improvement<br />
• Title I (Basic Grants – Low Income)<br />
• Title II (Enhance Educaon<br />
Through Technology)<br />
• Title V (Innovave Educaonal<br />
Strategies)<br />
• Transportaon – Home to <strong>School</strong><br />
Federal Intervention Program<br />
2012-13 <strong>School</strong> Year<br />
Cuen <strong>School</strong><br />
(Grades 3-6)<br />
Cuen <strong>School</strong> District<br />
(Grades 2-6)<br />
Program Improvement Status Not In PI Not In PI<br />
First Year of Program Improvement <br />
Year in Program Improvement <br />
2011-12 12 SARC<br />
Number of <strong>School</strong>s Idenfied for Program Improvement 0<br />
Percent of <strong>School</strong>s Idenfied for Program Improvement 0.00%<br />
Not applicable. The graduaon rate for AYP criteria applies to high schools.<br />
Not applicable.<br />
“Parent participation in all aspects of<br />
the school program is a strength of our district.”<br />
<strong>School</strong> Safety<br />
The Comprehensive <strong>School</strong> Safety Plan<br />
is undergoing a complete review and<br />
revision during the 2012-13 school<br />
year. Key elements of the plan, including<br />
monthly fire drills, earthquake<br />
evacuaon procedures, and lockdown<br />
policies are reviewed in early October<br />
each year, and are in effect throughout<br />
the year.
<strong>Cutten</strong> <strong>School</strong> • 2011-12 SARC<br />
Teacher Qualifications<br />
This table shows informaon about teacher credenals and teacher qualificaons. More informa-<br />
on can be found by vising hp://data1.cde.ca.gov/dataquest/.<br />
Teacher Credential Information<br />
Cuen <strong>School</strong> District<br />
Teacher Misassignments and Vacant Teacher Positions<br />
Three-Year Data Comparison<br />
Cuen <strong>School</strong><br />
Teachers 11-12 09-10 10-11 11-12<br />
With Full Credenal 28 15 14 14<br />
Without Full Credenal 0 0 0 0<br />
Teaching Outside Subject Area of Competence 0 0 0<br />
This table displays the number of teacher misassignments (teachers assigned without proper legal<br />
authorizaon) and the number of vacant teacher posions (not filled by a single designated teacher<br />
assigned to teach the enre course at the beginning of the school year or semester). Please note: Total<br />
teacher misassignments includes the number of misassignments of teachers of English Learners.<br />
Teacher Misassignments and Vacant Teacher Positions<br />
Three-Year Data Comparison<br />
Cuen <strong>School</strong><br />
Teachers 10-11 11-12 12-13<br />
Teacher Misassignments of English Learners 0 0 0<br />
Academic Counselors and<br />
<strong>School</strong> Support Staff<br />
8<br />
This table displays informaon about<br />
academic counselors and support staff<br />
at the school and their full-me equivalent<br />
(FTE).<br />
Academic Counselors<br />
and <strong>School</strong> Support Staff Data<br />
2011-12 <strong>School</strong> Year<br />
Academic Counselors<br />
FTE of Academic Counselors 0.000<br />
Rao of Students Per<br />
Academic Counselor<br />
Support Staff<br />
Social/Behavioral or Career<br />
Development Counselors<br />
Library Media Teacher<br />
(Librarian)<br />
Library Media Services<br />
Staff (Paraprofessional)<br />
<br />
FTE<br />
0.000<br />
0.000<br />
0.800<br />
Psychologist 0.100<br />
Social Worker 0.500<br />
2011-12 12 SARC<br />
Total Teacher Misassignments 0 0 0<br />
Vacant Teacher Posions 0 0 0<br />
No Child Left Behind Compliant Teachers<br />
NCLB requires that all teachers of core academic subject areas be “highly qualified.” In general, for<br />
a teacher to be considered highly qualified, they must have a bachelor’s degree, an appropriate<br />
California teaching credenal, and have demonstrated competence for each core subject he or she<br />
teaches. The table displays data regarding NCLB compliant teachers from the 2011-12 school year.<br />
For more informaon on teacher qualificaons related to NCLB, visit www.cde.ca.gov/nclb/sr/tq.<br />
No Child Left Behind Compliant Teachers<br />
2011-12 <strong>School</strong> Year<br />
Percent of Classes in Core Academic Subjects<br />
Taught by NCLB<br />
Compliant Teachers<br />
Taught by Non-NCLB<br />
Compliant Teachers<br />
Cuen <strong>School</strong> 100.00% 0.00%<br />
All <strong>School</strong>s in District 100.00% 0.00%<br />
High-Poverty <strong>School</strong>s in District 100.00% 0.00%<br />
Nurse 0.050<br />
Speech/Language/Hearing<br />
Specialist<br />
Resource Specialist<br />
(non-teaching)<br />
Other<br />
Resource Specialist<br />
Assistant<br />
0.400<br />
1.000<br />
FTE<br />
0.700<br />
Computer Technician 0.875<br />
Classroom Assistants<br />
(1 Assistant in every<br />
classroom, daily)<br />
3.440<br />
Low-Poverty <strong>School</strong>s in District 100.00% 0.00%<br />
NCLB Note<br />
High-poverty schools are defined as those schools with student parcipaon of approximately 40%<br />
or more in the free and reduced priced meals program. Low-poverty schools are those with student<br />
parcipaon of approximately 25% or less in the free and reduced priced meals program.<br />
Not applicable.
<strong>Cutten</strong> <strong>School</strong> • 2011-12 SARC<br />
Financial Data<br />
The financial data displayed in the SARC is from the 2010-11 fiscal year. The most current fiscal informaon<br />
available provided by the state is always two years behind the current school year, and<br />
one year behind most other data included in this report. For more detailed financial informaon,<br />
please visit www.cde.ca.gov/ds/fd/cs and www.cde.ca.gov/ds/fd/ec.<br />
District Financial Data<br />
This table displays district teacher and administrave salary informaon and compares the figures<br />
to the state averages for districts of the same type and size based on the salary schedule. Note the<br />
district salary data does not include benefits.<br />
District Salary Data<br />
Cuen <strong>School</strong> District<br />
2010-11 Fiscal Year<br />
Similar Sized District<br />
Beginning Teacher Salary $39,693 $38,625<br />
Mid-Range Teacher Salary $60,707 $55,530<br />
<strong>School</strong> Financial Data<br />
9<br />
The following table displays the<br />
school’s average teacher salary and a<br />
breakdown of the school’s expenditures<br />
per pupil from unrestricted and<br />
restricted sources.<br />
<strong>School</strong> Financial Data<br />
2010-11 Fiscal Year<br />
Total Expenditures<br />
Per Pupil<br />
$7,206<br />
Expenditures Per Pupil<br />
From Restricted Sources<br />
$1,919<br />
Expenditures Per Pupil<br />
From Unrestricted Sources<br />
$5,287<br />
Annual Average<br />
Teacher Salary<br />
$60,093<br />
Highest Teacher Salary $71,709 $70,729<br />
Average Principal Salary $83,382 $92,955<br />
Superintendent Salary $116,875 $106,757<br />
Teacher Salaries — Percent of Budget 43% 36%<br />
Administrave Salaries — Percent of Budget 5% 7%<br />
2011-12 12 SARC<br />
Financial Data Comparison<br />
The following table displays the school’s per pupil expenditures from unrestricted sources and the<br />
school’s average teacher salary and compares it to the district and state data.<br />
Financial Data Comparison<br />
Expenditures<br />
Per Pupil From<br />
Unrestricted Sources<br />
2010-11 Fiscal Year<br />
Annual<br />
Average Teacher<br />
Salary<br />
Cuen <strong>School</strong> $5,287 $60,093<br />
Cuen <strong>School</strong> District $5,496 $59,944<br />
California $5,455 $57,019<br />
<strong>School</strong> and District — Percent Difference +4.0% +0.2%<br />
<strong>School</strong> and California — Percent Difference -3.2% +5.1%<br />
Suspensions and Expulsions<br />
This table shows the rate of suspensions<br />
and expulsions (the total number<br />
of incidents divided by the school’s<br />
total enrollment) for the most recent<br />
three-year period.<br />
Suspension and Expulsion Rates<br />
Cuen <strong>School</strong><br />
09-10 10-11 11-12<br />
Suspension<br />
Rates<br />
0.049 0.043 0.013<br />
Expulsion<br />
Rates<br />
0.000 0.000 0.000<br />
Cuen <strong>School</strong> District<br />
Suspension<br />
Rates<br />
Expulsion<br />
Rates<br />
09-10 10-11 11-12<br />
0.032 0.027 0.016<br />
0.000 0.000 0.000<br />
Data for this year’s SARC was provided by the California Department of Educaon (CDE), school and district offices. For addional<br />
informaon on California schools and districts, please visit DataQuest at hp://data1.cde.ca.gov/dataquest. DataQuest is an online<br />
resource that provides reports for accountability, test data, enrollment, graduates, dropouts, course enrollments, staffing, and<br />
data regarding English Learners. Addionally, Ed-Data in partnership with the CDE, provides extensive financial, demographic,<br />
and performance informaon about California’s public kindergarten through grade twelve school districts and schools. More<br />
informaon can be found at www.ed-data.k12.ca.us/Pages/Home.aspx. Per Educaon Code Secon 35256, each school district<br />
shall make hard copies of its annually updated report card available, upon request, on or before February 1 of each year.<br />
All data accurate as of November 29, 2012.