Cutten School Accountability Report Card
Cutten School Accountability Report Card
Cutten School Accountability Report Card

Create successful ePaper yourself
Turn your PDF publications into a flip-book with our unique Google optimized e-Paper software.
<strong>Cutten</strong> <strong>School</strong> • 2011-12 SARC<br />
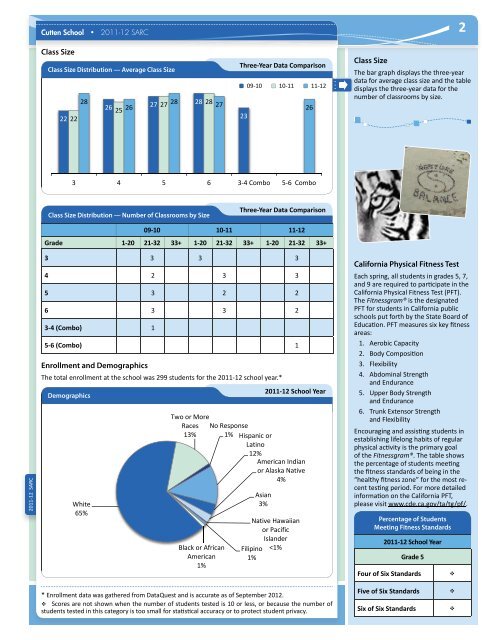
Class Size<br />
Class Size Distribution — Average Class Size<br />
Three-Year Data Comparison<br />
09-10 10-11 11-12<br />
28<br />
26 27 27 28 28 28<br />
25 26<br />
27<br />
22 22<br />
23<br />
26<br />
Class Size<br />
2<br />
The bar graph displays the three-year<br />
data for average class size and the table<br />
displays the three-year data for the<br />
number of classrooms by size.<br />
3 4 5 6 3-4 Combo 5-6 Combo<br />
Class Size Distribution — Number of Classrooms by Size<br />
Three-Year Data Comparison<br />
09-10 10-11 11-12<br />
Grade 1-20 21-32 33+ 1-20 21-32 33+ 1-20 21-32 33+<br />
2011-12 12 SARC<br />
3 3 3 3<br />
4 2 3 3<br />
5 3 2 2<br />
6 3 3 2<br />
3-4 (Combo) 1<br />
5-6 (Combo) 1<br />
Enrollment and Demographics<br />
The total enrollment at the school was 299 students for the 2011-12 school year.*<br />
Demographics<br />
White<br />
65%<br />
Black or African<br />
American<br />
1%<br />
Asian<br />
3%<br />
2011-12 <strong>School</strong> Year<br />
Two or More<br />
Races No Response<br />
13% 1% Hispanic or<br />
Latino<br />
12%<br />
American Indian<br />
or Alaska Native<br />
4%<br />
Native Hawaiian<br />
or Pacific<br />
Islander<br />
Filipino