Rhombohedral-cubic phase transition characterization of (Pb ... - ICDD
Rhombohedral-cubic phase transition characterization of (Pb ... - ICDD
Rhombohedral-cubic phase transition characterization of (Pb ... - ICDD

Create successful ePaper yourself
Turn your PDF publications into a flip-book with our unique Google optimized e-Paper software.
Copyright ©JCPDS-International Centre for Diffraction Data 2008 ISSN 1097-0002<br />
124<br />
RHOMBOHEDRAL-CUBIC PHASE TRANSITION<br />
CHARACTERIZATION OF (<strong>Pb</strong>,Ge)Te USING HIGH-TEMPERATURE<br />
XRD<br />
J. Sariel, 1 Y. Gelbstein, 2 and I. Dahan 1<br />
1 Nuclear Research Center, Negev, PO Box 9001, Beer Sheva, Israel, 84190<br />
2 Department <strong>of</strong> Materials Engineering, Ben-Gurion University <strong>of</strong> the Negev, Beer Sheva, Israel<br />
84105<br />
ABSTRACT<br />
<strong>Rhombohedral</strong>-<strong>cubic</strong> transformation in Bi 2 Te 3 doped-<strong>Pb</strong> 1-x Ge x Te alloys is presented. Samples <strong>of</strong><br />
Bi 2 Te 3 doped <strong>Pb</strong> 1-x Ge x Te were prepared by powder metallurgy approach. These powder samples<br />
were examined by high-temperature XRD and SEM/EDS. A bulk (pressed powder) cylindrical<br />
specimen was used for dilatometery <strong>characterization</strong>s. According to the XRD examinations it<br />
seems that upon increasing the temperatures a continuous transformation occurs from the<br />
rhombohedral to the <strong>cubic</strong> <strong>phase</strong>, accompanied by the formation <strong>of</strong> a small amount <strong>of</strong> the <strong>phase</strong><br />
Ge 0.74 <strong>Pb</strong> 3.26 Te 4 .<br />
INTRODUCTION<br />
Tellurium alloys are well known for their optical properties. Ge-Te alloys have been reported as<br />
fast switching, reversible, <strong>phase</strong>-change optical data storing media. The compound GeTe, which<br />
is also known for thermoelectric applications, is a p-type semiconductor. Additions <strong>of</strong> Bi 2 Te 3 and<br />
<strong>Pb</strong>Te to GeTe give the pseudo-binary alloys <strong>Pb</strong> 1-x Ge x Te, doped with small amounts <strong>of</strong> Bi 2 Te 3 .<br />
The influence <strong>of</strong> these additions on the physical properties is currently under investigation.<br />
<strong>Pb</strong>Te has a <strong>cubic</strong> NaCl type structure, and GeTe attains this structure only at the elevated<br />
temperatures, but on cooling, it transforms into a slightly distorted NaCl structure, with trigonal<br />
symmetry [1]. The <strong>transition</strong> temperature, Tc, is near 400 °C, and depends on the exact<br />
composition and the amount <strong>of</strong> the doping additions. Disagreement exists [1] as to whether this<br />
process is continuous or not, and therefore the possibility that this is <strong>of</strong> a first or a second order.<br />
EXPERIMENTAL<br />
The p-type <strong>Pb</strong> 0.13 Ge 0.87 Te + 3 mol% Bi 2 Te 3 alloy was prepared according to the following<br />
procedure: (a) sealing the source materials (purity <strong>of</strong> 5N) at appropriate concentrations in quartz<br />
ampoule under a vacuum <strong>of</strong> 10 -5 Torr, (b) melting the alloys in a rocking furnace at 800 °C for 1<br />
h followed by water quenching, (c) annealing at 620 °C for 12 h, (d) attrition <strong>of</strong> the compound to<br />
a maximal particle size <strong>of</strong> 60 mesh powder, and (e) hot pressing (HP) at conditions <strong>of</strong> 520 °C/30<br />
min/43 MPa/H 2 atmosphere. Powder samples were examined by high-temperature XRD and<br />
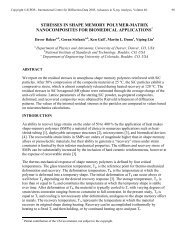
SEM/EDS. A bulk (pressed powder) specimen, with dimensions <strong>of</strong> 20 × 5 × 5 mm 3 was used for<br />
dilatometery <strong>characterization</strong>s. The dilatometer model Linseis L75 (see Figure 1) was used to<br />
determine the length change <strong>of</strong> the specimen. The specimen was heated up to 500 °C with a<br />
heating rate <strong>of</strong> 5 °C/min, in helium atmosphere. TAWIN s<strong>of</strong>tware was used to analyze the data.
Copyright ©JCPDS-International Centre for Diffraction Data 2008 ISSN 1097-0002<br />
125<br />
Figure 1. Linseis L75 dilatometer.<br />
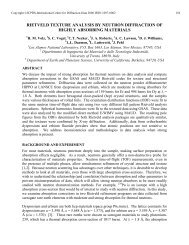
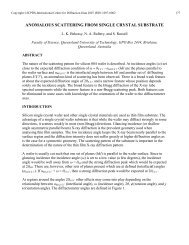
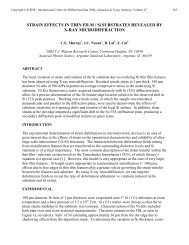
High-resolution SEM JEOL JSM-7400F was used to examine the hot pressed specimen. Hightemperature<br />
X-ray diffraction (HTXRD) examinations were done by Anton-Paar HTK-1200N<br />
hot stage attached to a Philips XRD system (Figure 2). The specimens for the HTXRD were in<br />
the form <strong>of</strong> powder filled in the sample holder.<br />
H.S.<br />
Vacuum pump<br />
Sample holder<br />
flange<br />
Figure 2. Hot stage for HTXRD.
Copyright ©JCPDS-International Centre for Diffraction Data 2008 ISSN 1097-0002<br />
126<br />
RESULTS<br />
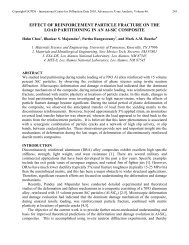
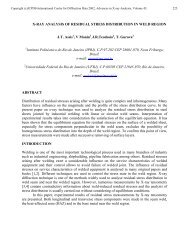
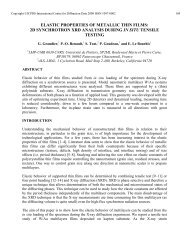
High-resolution SEM micrographs <strong>of</strong> the pressed powder are presented in Figure 3. The sample<br />
is mostly <strong>of</strong> a single <strong>phase</strong>, with a small amount <strong>of</strong> scattered second-<strong>phase</strong> precipitates. EDS<br />
examinations showed that these precipitates are richer in <strong>Pb</strong> than the matrix. Although the matrix<br />
composition is 42 at% Ge, 6 at% <strong>Pb</strong>, 1.5 at% Bi, and 50.5 at% Te, the precipitate composition is<br />
24 at% Ge, 22 at% <strong>Pb</strong>, 1.6 at% Bi, and 52.4 at% Te. It is noteworthy that since the precipitates<br />
are less than 1 µm in size, the EDS error is relatively high. Yet, it is obvious that the precipitates<br />
have a higher <strong>Pb</strong> content than the matrix. Moreover, according to Figure 3 these precipitates are<br />
located at grain boundaries.<br />
Figure 3. High resolution SEM micrographs <strong>of</strong> pressed powder. See the scattered fine precipitates <strong>of</strong> the second<br />
<strong>phase</strong>.<br />
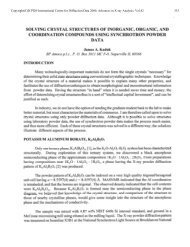
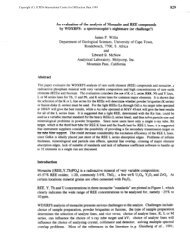
The bulk (pressed powder) sample was heated in the dilatometer up to 500 °C. The temperature<br />
dependence <strong>of</strong> the dilatation dL is presented in Figure 4. From this graph the <strong>phase</strong> <strong>transition</strong><br />
temperature was found to be at 373 °C (the intersection <strong>of</strong> the 2 lines, according to reference<br />
[2]).
Copyright ©JCPDS-International Centre for Diffraction Data 2008 ISSN 1097-0002<br />
127<br />
Dilatation v.s. Temperature<br />
Dilatation µm<br />
80<br />
60<br />
40<br />
20<br />
0<br />
Tc=373 °C<br />
0 200 400 600<br />
Temperature °C<br />
Figure 4. The dilatation dL versus temperature.<br />
Examinations in high-temperature XRD showed gradual changes in the diffracted spectrum<br />
along the heating <strong>of</strong> the powder samples from room temperature to 500 °C. Figure 5 shows the<br />
diffractogram obtained at room temperature (RT, at the bottom <strong>of</strong> the frame), and those obtained<br />
at 200, 350, 450, and 500 °C. The upper diffractogram in the figure was obtained after cooling<br />
back to room temperature at the end <strong>of</strong> the process. As one can see, at the heating cycle a doublet<br />
peak pattern <strong>of</strong> the rhombohedral structure merges to a single peak <strong>of</strong> the <strong>cubic</strong> structure [for<br />
instance at about 42 °2θ, the (024) and (220) peaks <strong>of</strong> the rhombohedral structure merge to the<br />
(220) peak <strong>of</strong> the <strong>cubic</strong> one; see Figure 5]. This process is reversible, and was also obtained<br />
while cooling. In addition, new peaks <strong>of</strong> another <strong>phase</strong> were observed upon heating, which were<br />
found to fit the Ge 0.74 <strong>Pb</strong> 3.26 Te 4 <strong>phase</strong> (PDF 03-65-7226 [3]). This <strong>phase</strong> dissolves back as the<br />
temperature reaches 500 °C, but appears again on cooling back, and retained at room temperature<br />
(see Figure 5).<br />
Figure 6 presents the diffractograms obtained on a shorter range <strong>of</strong> 2θ, (and shorter scan time)<br />
where every scan took about 5 min. These graphs show the gradual change <strong>of</strong> the doublet pattern<br />
to a single peak, at the heating cycle (upper frame in Figure 6), and the splitting back to two<br />
peaks on cooling back to RT (lower frame).
Copyright ©JCPDS-International Centre for Diffraction Data 2008 ISSN 1097-0002<br />
128<br />
Figure 5. Diffractogram obtained at room temperature (RT, at the bottom), through the heating cycle (at 200, 350,<br />
450, and 500 °C), and after cooling back to RT. "#" denotes the new obtained <strong>phase</strong> peaks.<br />
The formation <strong>of</strong> the new <strong>phase</strong> can be observed in Figure 5 (peaks denoted by "#") and 6<br />
(appearance <strong>of</strong> the new peak at about 38 °2θ). This peak vanishes at 500 °C, and reappears on<br />
cooling back to RT. The volume fraction <strong>of</strong> the new obtained <strong>phase</strong> on the heating cycle, as can<br />
roughly be calculated from the area under the peaks in each diffractogram, was drawn against the<br />
temperature (Figure 7). It can be seen that this <strong>phase</strong> vanishes at 500 °C.<br />
The cell parameters and the volume per atom in the structure were calculated from the peak<br />
positions in the diffractograms obtained from HTXRD. The temperature dependence <strong>of</strong> the cell<br />
parameters and <strong>of</strong> the volume per atom is presented in Figure 8. It can be seen from the graphs<br />
that there is no abrupt change <strong>of</strong> the volume per atom while moving from the rhombohedral to<br />
the <strong>cubic</strong> structure. This continuous change supports the assumption that this <strong>phase</strong> <strong>transition</strong> is<br />
indeed <strong>of</strong> a second order. This conclusion should be verified by more examinations and at<br />
different compositions.
Copyright ©JCPDS-International Centre for Diffraction Data 2008 ISSN 1097-0002<br />
129<br />
Figure 6. Short runs while heating from RT to 500 °C (upper frame) and while cooling back to RT (lower frame).
Copyright ©JCPDS-International Centre for Diffraction Data 2008 ISSN 1097-0002<br />
130<br />
Voliume fraction <strong>of</strong> new <strong>phase</strong> [%]<br />
Voliume fraction [%]<br />
10.0<br />
8.0<br />
6.0<br />
4.0<br />
2.0<br />
0.0<br />
0 100 200 300 400 500<br />
T [°C]<br />
Figure 7. The volume fraction <strong>of</strong> the new obtained <strong>phase</strong>, roughly calculated by the area<br />
under the <strong>phase</strong> peaks.<br />
Cell parameters vs. Temp<br />
Voliume per atom vs. Temp<br />
6.5<br />
11<br />
30<br />
29.5<br />
C e ll p aram eter [ Å ]<br />
6<br />
5.5<br />
5<br />
4.5<br />
c rhombohedral<br />
a rhombohedral<br />
a <strong>cubic</strong><br />
a<br />
c<br />
10.5<br />
10<br />
9.5<br />
9<br />
V o liu m e p er atom [ Å 3 ]<br />
29<br />
28.5<br />
28<br />
27.5<br />
27<br />
26.5<br />
rhombohedral<br />
<strong>cubic</strong><br />
4<br />
8.5<br />
0 100 200 300 400 500 600<br />
Temperature [°C]<br />
26<br />
0 100 200 300 400 500 600<br />
Temperature [°C]<br />
Figure 8. Cell parameters and volume per atom in the structure versus the temperature.<br />
REFERENCES<br />
[1] Hohnke, D. K.; Holloway, H.; Kaiser, S. J. Phys. Chem. Solids 1972, 33, 2053–2062.<br />
[2] Speyer, R. F. Thermal Analysis <strong>of</strong> Materials; Marcel Dekker: New York, 1994.<br />
[3] PDF 03-65-7226. Powder Diffraction File. International Centre for Diffraction Data:<br />
Newtown Square, Pennsylvania, 2005.