Modeling Roaming in Large-scale Wireless Networks using Real ...
Modeling Roaming in Large-scale Wireless Networks using Real ...
Modeling Roaming in Large-scale Wireless Networks using Real ...

Create successful ePaper yourself
Turn your PDF publications into a flip-book with our unique Google optimized e-Paper software.
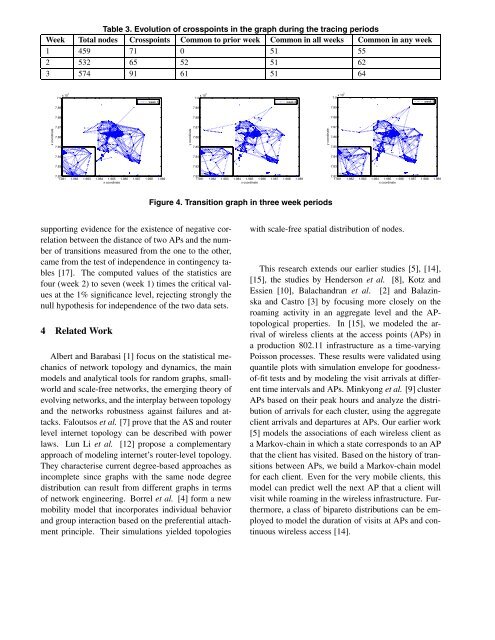
Table 3. Evolution of crosspo<strong>in</strong>ts <strong>in</strong> the graph dur<strong>in</strong>g the trac<strong>in</strong>g periods<br />
Week Total nodes Crosspo<strong>in</strong>ts Common to prior week Common <strong>in</strong> all weeks Common <strong>in</strong> any week<br />
1 459 71 0 51 55<br />
2 532 65 52 51 62<br />
3 574 91 61 51 64<br />
7.9 x 10⁵ x coord<strong>in</strong>ate<br />
7.9 x 10⁵ x coord<strong>in</strong>ate<br />
7.9 x 10⁵ x coord<strong>in</strong>ate<br />
7.89<br />
week 1<br />
7.89<br />
week 2<br />
7.89<br />
week 3<br />
7.88<br />
7.88<br />
7.88<br />
x coord<strong>in</strong>ate<br />
7.87<br />
7.86<br />
7.85<br />
y coord<strong>in</strong>ate<br />
7.87<br />
7.86<br />
7.85<br />
y coord<strong>in</strong>ate<br />
7.87<br />
7.86<br />
7.85<br />
7.84<br />
7.84<br />
7.84<br />
7.83<br />
7.83<br />
7.83<br />
7.82<br />
1.981 1.982 1.983 1.984 1.985 1.986 1.987 1.988 1.989<br />
7.82<br />
1.981 1.982 1.983 1.984 1.985 1.986 1.987 1.988 1.989<br />
7.82<br />
1.981 1.982 1.983 1.984 1.985 1.986 1.987 1.988 1.989<br />
Figure 4. Transition graph <strong>in</strong> three week periods<br />
support<strong>in</strong>g evidence for the existence of negative correlation<br />
between the distance of two APs and the number<br />
of transitions measured from the one to the other,<br />
came from the test of <strong>in</strong>dependence <strong>in</strong> cont<strong>in</strong>gency tables<br />
[17]. The computed values of the statistics are<br />
four (week 2) to seven (week 1) times the critical values<br />
at the 1% significance level, reject<strong>in</strong>g strongly the<br />
null hypothesis for <strong>in</strong>dependence of the two data sets.<br />
4 Related Work<br />
Albert and Barabasi [1] focus on the statistical mechanics<br />
of network topology and dynamics, the ma<strong>in</strong><br />
models and analytical tools for random graphs, smallworld<br />
and <strong>scale</strong>-free networks, the emerg<strong>in</strong>g theory of<br />
evolv<strong>in</strong>g networks, and the <strong>in</strong>terplay between topology<br />
and the networks robustness aga<strong>in</strong>st failures and attacks.<br />
Faloutsos et al. [7] prove that the AS and router<br />
level <strong>in</strong>ternet topology can be described with power<br />
laws. Lun Li et al. [12] propose a complementary<br />
approach of model<strong>in</strong>g <strong>in</strong>ternet’s router-level topology.<br />
They characterise current degree-based approaches as<br />
<strong>in</strong>complete s<strong>in</strong>ce graphs with the same node degree<br />
distribution can result from different graphs <strong>in</strong> terms<br />
of network eng<strong>in</strong>eer<strong>in</strong>g. Borrel et al. [4] form a new<br />
mobility model that <strong>in</strong>corporates <strong>in</strong>dividual behavior<br />
and group <strong>in</strong>teraction based on the preferential attachment<br />
pr<strong>in</strong>ciple. Their simulations yielded topologies<br />
with <strong>scale</strong>-free spatial distribution of nodes.<br />
This research extends our earlier studies [5], [14],<br />
[15], the studies by Henderson et al. [8], Kotz and<br />
Essien [10], Balachandran et al. [2] and Balaz<strong>in</strong>ska<br />
and Castro [3] by focus<strong>in</strong>g more closely on the<br />
roam<strong>in</strong>g activity <strong>in</strong> an aggregate level and the APtopological<br />
properties. In [15], we modeled the arrival<br />
of wireless clients at the access po<strong>in</strong>ts (APs) <strong>in</strong><br />
a production 802.11 <strong>in</strong>frastructure as a time-vary<strong>in</strong>g<br />
Poisson processes. These results were validated us<strong>in</strong>g<br />
quantile plots with simulation envelope for goodnessof-fit<br />
tests and by model<strong>in</strong>g the visit arrivals at different<br />
time <strong>in</strong>tervals and APs. M<strong>in</strong>kyong et al. [9] cluster<br />
APs based on their peak hours and analyze the distribution<br />
of arrivals for each cluster, us<strong>in</strong>g the aggregate<br />
client arrivals and departures at APs. Our earlier work<br />
[5] models the associations of each wireless client as<br />
a Markov-cha<strong>in</strong> <strong>in</strong> which a state corresponds to an AP<br />
that the client has visited. Based on the history of transitions<br />
between APs, we build a Markov-cha<strong>in</strong> model<br />
for each client. Even for the very mobile clients, this<br />
model can predict well the next AP that a client will<br />
visit while roam<strong>in</strong>g <strong>in</strong> the wireless <strong>in</strong>frastructure. Furthermore,<br />
a class of bipareto distributions can be employed<br />
to model the duration of visits at APs and cont<strong>in</strong>uous<br />
wireless access [14].