Sustainable Development Impacts of Investment Incentives: A Case ...
Sustainable Development Impacts of Investment Incentives: A Case ...
Sustainable Development Impacts of Investment Incentives: A Case ...

You also want an ePaper? Increase the reach of your titles
YUMPU automatically turns print PDFs into web optimized ePapers that Google loves.
A <strong>Case</strong> Study <strong>of</strong> the<br />
Chemical Industry<br />
in Indonesia<br />
<strong>Sustainable</strong><br />
<strong>Development</strong><br />
<strong>Impacts</strong> <strong>of</strong><br />
<strong>Investment</strong><br />
<strong>Incentives</strong><br />
Prepared by Sri Adiningsih<br />
Murti Lestari<br />
A. Ika Rahutami<br />
Awang Susatya Wijaya<br />
Center for Asia Pacific Studies<br />
Gadjah Mada University, Indonesia<br />
2009
trade knowledge network<br />
© 2009 International Institute for <strong>Sustainable</strong> <strong>Development</strong> (IISD)<br />
Published by the International Institute for <strong>Sustainable</strong> <strong>Development</strong><br />
International Institute for <strong>Sustainable</strong> <strong>Development</strong><br />
161 Portage Avenue East, 6th Floor<br />
Winnipeg, Manitoba Canada<br />
R3B 0Y4<br />
Tel: +1 (204) 958-7700<br />
Fax: +1 (204) 958-7710<br />
E-mail: info@iisd.ca<br />
Web site: http://www.iisd.org/<br />
<strong>Sustainable</strong> <strong>Development</strong> <strong>Impacts</strong> <strong>of</strong> <strong>Investment</strong> <strong>Incentives</strong>: A <strong>Case</strong> Study <strong>of</strong> the Chemical Industry<br />
in Indonesia<br />
Sri Adiningsih<br />
Murti Lestari<br />
A. Ika Rahutami<br />
Awang Susatya Wijaya<br />
Center for Asia Pacific Studies, Gadjah Mada University, Indonesia<br />
<strong>Sustainable</strong> <strong>Development</strong> <strong>Impacts</strong> <strong>of</strong> <strong>Investment</strong> <strong>Incentives</strong>: A <strong>Case</strong> Study <strong>of</strong> the Chemical Industry in Indonesia<br />
i
trade knowledge network<br />
About the Trade Knowledge Network<br />
http://www.tradeknowledgenetwork.net<br />
The Trade Knowledge Network is a global collaboration <strong>of</strong> research institutions across Africa, Asia,<br />
Europe and the Americas working on issues <strong>of</strong> trade and sustainable development. Coordinated by the<br />
International Institute for <strong>Sustainable</strong> <strong>Development</strong> (IISD), the TKN links network members,<br />
strengthens capacity and generates new research to assess and address the impact <strong>of</strong> trade and investment<br />
policies on sustainable development.<br />
The overarching aim <strong>of</strong> the TKN is to help ensure that trade and investment contribute to sustainable<br />
development, with social development and the environment equitably addressed in trade and investment<br />
policies. The TKN furthers this aim by generating compelling research with clear policy recommendations<br />
and communicating those effectively to decision-makers nationally, regionally and globally.<br />
The TKN is hosted by the International Institute for <strong>Sustainable</strong> <strong>Development</strong>, a Canada-based not-forpr<strong>of</strong>it<br />
organization promoting change towards sustainable development. As a policy research institute<br />
dedicated to the effective communication <strong>of</strong> its findings, the Institute engages decision-makers in<br />
government, business, NGOs and other sectors in the development and implementation <strong>of</strong> policies that<br />
are simultaneously beneficial to the global economy, the global environment and to social well-being.<br />
This study is part <strong>of</strong> a larger TKN project that seeks to better understand the impacts <strong>of</strong> investment<br />
incentives on sustainable development. Similar country case studies were carried out for the pharmaceutical<br />
industry in Singapore (by the Singapore Institute for International Affairs), the mining industry in Vietnam<br />
(by the Central Institute for Economic Management, Vietnam) and the tourism industry in Malawi (by<br />
the University <strong>of</strong> Malawi and the South African Institute for International Affairs). In addition, a regional<br />
study examines the effectiveness <strong>of</strong> investment incentives in attracting FDI and promoting economic<br />
growth, social development and environmental protection in Southeast Asia. Finally, a checklist sets out<br />
some key issues and questions to be addressed when assessing the sustainable development impacts <strong>of</strong><br />
investment incentives. The project outputs are available on the TKN website.<br />
About the International Institute for <strong>Sustainable</strong><br />
<strong>Development</strong> (IISD)<br />
http://www.iisd.org<br />
The International Institute for <strong>Sustainable</strong> <strong>Development</strong> contributes to sustainable development by<br />
advancing policy recommendations on international trade and investment, economic policy, climate<br />
change, measurement and assessment and natural resources management. Through the Internet, we<br />
report on international negotiations and share knowledge gained through collaborative projects with<br />
global partners, resulting in more rigorous research, capacity building in developing countries and better<br />
dialogue between North and South.<br />
IISD’s vision is better living for all—sustainably; its mission is to champion innovation, enabling<br />
societies to live sustainably. IISD is registered as a charitable organization in Canada and has 501(c)(3)<br />
status in the United States. IISD receives core operating support from the Government <strong>of</strong> Canada,<br />
provided through the Canadian International <strong>Development</strong> Agency (CIDA), the International<br />
<strong>Development</strong> Research Centre (IDRC) and Environment Canada; and from the Province <strong>of</strong> Manitoba.<br />
The Institute receives project funding from numerous governments inside and outside Canada, United<br />
Nations agencies, foundations and the private sector.<br />
ii<br />
<strong>Sustainable</strong> <strong>Development</strong> <strong>Impacts</strong> <strong>of</strong> <strong>Investment</strong> <strong>Incentives</strong>: A <strong>Case</strong> Study <strong>of</strong> the Chemical Industry in Indonesia
trade knowledge network<br />
About Center for Asia Pacific Studies (CAPS)<br />
http://www.caps.ugm.ac.id<br />
Center for Asia Pacific Studies (CAPS) is one <strong>of</strong> the study centres at Gadjah Mada University,<br />
Yogyakarta, Indonesia. CAPS carries out a multiplicity <strong>of</strong> activities concerning Asia and Pacific region.<br />
The establishment <strong>of</strong> the study centre was motivated by the need to promote the development <strong>of</strong><br />
knowledge and culture within a cross-cultural and multi-disciplinary framework, with the underlying<br />
goal <strong>of</strong> contributing to the realization <strong>of</strong> Gadjah Mada University’s vision <strong>of</strong> orientating its activities in<br />
the service <strong>of</strong> national interests, underpinning its activities on Pancasila principles, and becoming an<br />
international standard research university.<br />
CAPS’s vision is to become an international standard study centre, focusing on Asia and Pacific issues<br />
underpinned by the commitment to support academic activities in Gadjah Mada University; its mission<br />
is to become a research centre with special emphasis on contemporary strategic issues in the Asia-Pacific<br />
region, to become a centre <strong>of</strong> information on Asia Pacific issues, and to become a centre <strong>of</strong> discourse,<br />
seminars, workshops and training on the Asia Pacific region.<br />
<strong>Sustainable</strong> <strong>Development</strong> <strong>Impacts</strong> <strong>of</strong> <strong>Investment</strong> <strong>Incentives</strong>: A <strong>Case</strong> Study <strong>of</strong> the Chemical Industry in Indonesia<br />
iii
trade knowledge network<br />
Executive Summary<br />
Foreign direct investment (FDI) inflow has assumed great importance for the Indonesian economy,<br />
especially after the 1997 economic crisis. High unemployment, poverty and low economic growth over<br />
the past decade call for substantial investment inflow to propel the economy out <strong>of</strong> the doldrums. In<br />
order to attract foreign investment, Indonesia is not only involved in forming cooperation agreements<br />
with other countries, but also <strong>of</strong>fers various investment incentives to potential investors. The incentives<br />
take several forms, including import duties, tax facilities, export manufacturing incentives and bonded<br />
zones.<br />
Indonesia started to provide incentives to foreign investors in 1967 when Law No. 1/1967 came into<br />
effect. However, until the late-1970s, the entry procedure for foreign enterprises remained obscure,<br />
complex, time consuming and costly. In 1984, all tax concessions were rescinded in line with Law No.<br />
7/1983 on Income Tax. In 1985, Indonesia renewed incentives to attract FDI by simplifying<br />
administration procedures and deregulating investments, including equalizing foreign and domestic<br />
investors and granting income tax facilities to many sectors. The most extensive incentive was the<br />
enactment <strong>of</strong> Law No. 25/2007 on <strong>Investment</strong>. The law essentially allows non-discriminatory treatment<br />
for both foreign and domestic investors. Government regulation No.1/2007 grants income tax<br />
dispensation facilities to 15 sectors, one <strong>of</strong> which is the chemical industry.<br />
Foreign direct investment in the chemical and pharmaceutical industry experienced very rapid growth<br />
from 2002 to 2007 (though it plummeted in 2006). The real foreign interest rate is the main variable<br />
influencing FDI in the chemical industry in Indonesia. Other economic variables, such as Bank<br />
Indonesia’s rates, real exchange rates and gross domestic product, do not seem to have a significant<br />
impact on foreign investors’ decisions to invest their capital in Indonesia. It is also notable that <strong>of</strong>fering<br />
foreign investors 100 percent share ownership and making it easy for foreign workers to stay or reside<br />
in the country do not constitute key factors that influence foreign investors who consider bringing their<br />
capital investment into the country. In the long term, Gross Domestic Product (GDP) constitutes an<br />
important determinant <strong>of</strong> FDI in Indonesia, while investment incentives do not.<br />
Based on the results <strong>of</strong> in-depth interviews with a number <strong>of</strong> chemical companies located in the province<br />
<strong>of</strong> Banten, the large Indonesian market appears to be the key factor underlying a foreign chemical<br />
company’s decision to invest in Indonesia. However, though investment incentives are not a key factor<br />
for foreign investors, they are still considered as an important element in investment. In connection with<br />
the impact <strong>of</strong> incentives on business development, most respondents expressed the view that incentives<br />
do not significantly influence their businesses. Based on in-depth interviews, companies identify<br />
incentives that affect import duties/levies applicable to capital goods as the most attractive <strong>of</strong> all<br />
incentives, as most industries in Indonesia depend heavily on imported intermediate and capital goods<br />
as inputs in their production processes. Based on research findings, incentives should ideally last more<br />
than five years, and respondents urged for even longer incentive duration if it is possible.<br />
Employment generated by the chemical industry arising from foreign direct investment from 2002 to<br />
2007 tends to decrease. This indicates that the chemical industry is moving to more capital intensive<br />
industry or lowering its capacity. Most <strong>of</strong> the companies employ less than 50 percent local workers, with<br />
the rest coming from neighbouring areas. The wages <strong>of</strong> FDI companies are higher than regional<br />
minimum wages. People living in surrounding areas regard chemical industries as beneficial to their<br />
community as they provide much needed employment opportunities.<br />
iv<br />
<strong>Sustainable</strong> <strong>Development</strong> <strong>Impacts</strong> <strong>of</strong> <strong>Investment</strong> <strong>Incentives</strong>: A <strong>Case</strong> Study <strong>of</strong> the Chemical Industry in Indonesia
trade knowledge network<br />
Inputs are primarily imported goods, while only very few inputs are sourced from the surrounding area.<br />
The motivation for using imported inputs is primarily competitive price. The largest percentage <strong>of</strong><br />
output is sold on the domestic market, and a small percentage is sold on the local market.<br />
Sample respondents drawn from members <strong>of</strong> the community living in the vicinity <strong>of</strong> the factories in<br />
Banten generally perceived immense benefits derived from the existence <strong>of</strong> the factories as a source <strong>of</strong><br />
employment opportunities for the local community, albeit unskilled and non-managerial in nature.<br />
Most respondents expressed satisfaction with the establishment <strong>of</strong> the industry in their area because it<br />
induced many people to live within the vicinity <strong>of</strong> the factories, serving as a convergent point for inmigrants<br />
employed at the factory. The in-migrants, in general have higher skills than the local<br />
population. The increasing numbers <strong>of</strong> factory employees, who are mainly non-locals, have become a<br />
source <strong>of</strong> economic welfare for the local population through the provision <strong>of</strong> parking services, washing<br />
and houses for rent.<br />
In order to protect the environment, the Indonesian government issued Act No. 23/1997 on managing<br />
the environment and attendant implementing legal instruments. The State Ministry for the<br />
Environment employs environmental management ranking assessors to measure each company’s degree<br />
<strong>of</strong> compliance with the legal instruments (or PROPER). Data shows that foreign companies in the<br />
chemical industry in 2007 are not the worst <strong>of</strong>fenders when it comes to the environment, generally<br />
outperforming their domestic counterparts.<br />
An issue that is cause for concern, albeit still within tolerable limits, is the scale <strong>of</strong> environmental<br />
contamination and pollution. Air pollution, caused by smoke, fumes and pungent odours spewed by<br />
factory chimneys <strong>of</strong>ten cause severe irritation and discomfort. Some people who are highly sensitive to<br />
pungent odours suffer from headaches. Air quality has declined drastically since the chemical factories<br />
came into existence. However, in general members <strong>of</strong> the local community perceived such effects as<br />
within tolerable limits, which in any case they had become accustomed to, and not a major source <strong>of</strong><br />
serious health problems.<br />
Foreign direct investment as a source <strong>of</strong> foreign capital inflow is important in fostering economic<br />
growth. Thus, efforts must be made to increase both domestic and foreign investment. This report<br />
provides the Government <strong>of</strong> Indonesia with several recommendations to enhance its attractiveness to<br />
foreign investors. These include:<br />
■<br />
■<br />
■<br />
■<br />
A need to improve legal certainty and investment security guarantees;<br />
The provision <strong>of</strong> public services and good infrastructure;<br />
<strong>Incentives</strong> especially for those companies that produce inputs for local industries, are needed;<br />
A need to improve human resources quality in the chemical industry and surrounding<br />
community.<br />
<strong>Sustainable</strong> <strong>Development</strong> <strong>Impacts</strong> <strong>of</strong> <strong>Investment</strong> <strong>Incentives</strong>: A <strong>Case</strong> Study <strong>of</strong> the Chemical Industry in Indonesia<br />
v
trade knowledge network<br />
Contents<br />
Executive Summary<br />
iv<br />
1 Introduction 1<br />
1.1 Scope and methodology 1<br />
2 Overview <strong>of</strong> <strong>Investment</strong> <strong>Incentives</strong> 4<br />
3 Bilateral and Multilateral <strong>Investment</strong> Treaties and Negotiations 7<br />
3.1 Bilateral agreements 7<br />
3.2 Multilateral agreements 8<br />
4 <strong>Impacts</strong> <strong>of</strong> <strong>Investment</strong> <strong>Incentives</strong> on FDI Decisions 10<br />
4.1 Depiction <strong>of</strong> developments in FDI in Indonesia 10<br />
4.2 The impact <strong>of</strong> incentives on the decision to invest 14<br />
5 The Impact <strong>of</strong> FDI in the Chemical Industry on <strong>Sustainable</strong> <strong>Development</strong> 16<br />
5.1 Economic impacts 16<br />
5.1.1 Employment generation 16<br />
5.1.2 Trade aspect 18<br />
5.2 Social impacts 20<br />
5.3 <strong>Impacts</strong> on the environment 22<br />
6 Policy Recommendations 26<br />
7 References 26<br />
Annex 1: List <strong>of</strong> regulations on investment incentives 29<br />
Annex 2: Methodology 31<br />
vi<br />
<strong>Sustainable</strong> <strong>Development</strong> <strong>Impacts</strong> <strong>of</strong> <strong>Investment</strong> <strong>Incentives</strong>: A <strong>Case</strong> Study <strong>of</strong> the Chemical Industry in Indonesia
trade knowledge network<br />
List <strong>of</strong> tables<br />
No Table<br />
1 Companies targeted by the survey 3<br />
2 Ranking <strong>of</strong> direct investment realization by sector, January 1–September 30, 2007 11<br />
3 FDI approval by state <strong>of</strong> development, 1970–2007 12<br />
4 PMA approval based on sub–sector, 1970–2007 13<br />
5 <strong>Investment</strong> motivation 14<br />
6 The importance <strong>of</strong> investment incentive 15<br />
7 Incentive impact on corporate action 15<br />
8 Most attractive investment incentive 16<br />
9 Ideal period for investment incentive 16<br />
10 Manpower absorption <strong>of</strong> foreign direct investment realization by sector, 17<br />
2002 – September 30, 2007<br />
11 Labour source 18<br />
12 Input source 18<br />
13 Reasons for using imported input 19<br />
14 Market destination 19<br />
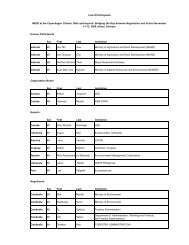
15 Pr<strong>of</strong>ile <strong>of</strong> community respondents 20<br />
16 Social impact 21<br />
17 Environmental compliance in the chemical industry in Cilegon, Banten Province 23<br />
18 Environmental treatment 25<br />
19 Respondents’ perception <strong>of</strong> environmental impact 25<br />
20 Unit root test: Level 32<br />
21 Unit root test: First difference 32<br />
22 Co-integration test 32<br />
23 Error correction model estimation 33<br />
24 Co-integration equation estimation 33<br />
<strong>Sustainable</strong> <strong>Development</strong> <strong>Impacts</strong> <strong>of</strong> <strong>Investment</strong> <strong>Incentives</strong>: A <strong>Case</strong> Study <strong>of</strong> the Chemical Industry in Indonesia<br />
vii
trade knowledge network<br />
List <strong>of</strong> Figures<br />
No. Figure<br />
1 Value <strong>of</strong> foreign direct investment realization by sector, 2002 – September 30, 2007 11<br />
($ million)<br />
2 Manpower absorption <strong>of</strong> foreign direct investment realization in the chemical and 17<br />
pharmaceutical industry, 2002 – September 30, 2007<br />
3 Exports-imports <strong>of</strong> organic chemicals, 2003–2007 19<br />
viii<br />
<strong>Sustainable</strong> <strong>Development</strong> <strong>Impacts</strong> <strong>of</strong> <strong>Investment</strong> <strong>Incentives</strong>: A <strong>Case</strong> Study <strong>of</strong> the Chemical Industry in Indonesia
trade knowledge network<br />
1 Introduction<br />
Foreign direct investment inflow has assumed great importance for the Indonesian economy, especially<br />
after the 1997 economic crisis. High unemployment, poverty and low economic growth over the past<br />
decade, call for substantial investment inflow to propel the economy out <strong>of</strong> the doldrums. However,<br />
investment in the economy continues to show sluggish performance. For instance investment over the<br />
last six years grew by about 7.2 per cent. Meanwhile, investment expenditure to GDP in Indonesia is<br />
around 20 per cent. In contrast, in other Asian countries such as South Korea investment expenditure<br />
contributes 29 per cent to GDP, and China was 44.9 per cent in 2006. Thus, the Indonesian economy<br />
requires injection <strong>of</strong> foreign investment in general and FDI in particular.<br />
In order to attract the needed foreign investment into the country, Indonesia is not only involved in<br />
forming cooperation agreements with other countries, but also <strong>of</strong>fers various investment incentives to<br />
potential investors. The incentives take several forms, which include:<br />
■<br />
■<br />
■<br />
■<br />
Import duty exemptions: exemptions from import duties for foreign and domestic investors for<br />
imports <strong>of</strong> machinery and equipment, raw materials and supporting materials.<br />
Tax facilities: an investment tax allowance in the form <strong>of</strong> taxable income reduction as much as<br />
30 per cent <strong>of</strong> the realized investment spread over six years; accelerated depreciation and<br />
amortization; a loss carried forward facility for a period <strong>of</strong> no more than ten years; a ten per cent<br />
income tax on dividends, and possibly lower if stipulated in the provisions <strong>of</strong> an existing<br />
particular tax treaty.<br />
Export manufacturing: restitution (drawback) <strong>of</strong> import duties and import charges on<br />
imported goods and materials needed to manufacture exported finished products; exemption<br />
from Value Added Tax and Sales Tax on Luxury Goods and Materials Purchased Domestically,<br />
to be used in the manufacturing <strong>of</strong> the exported products; the ability to import raw materials<br />
required regardless <strong>of</strong> the availability <strong>of</strong> comparable domestic products.<br />
Bonded zones: industrial companies located in the bonded areas receive many incentives.<br />
FDI in the chemical and pharmaceutical industry is the second largest after transportation services industry,<br />
warehousing and telecommunications (see Table 4 for a description <strong>of</strong> the chemical and pharmaceutical<br />
industry). In 2007, 16 per cent <strong>of</strong> total FDI in Indonesia was in the chemical and pharmaceutical industry,<br />
which, in comparison with the manufacturing industry, constituted more than 35 per cent <strong>of</strong> total FDI. The<br />
high percentage <strong>of</strong> FDI in the chemical and pharmaceutical industry has remained unchanged over several<br />
years, an indication that Indonesia is an attractive destination for FDI in the global chemical industry.<br />
1.1 Scope and methodology<br />
This country study assesses the extent and impacts <strong>of</strong> investment incentives on the chemicals sector in<br />
Indonesia. In particular, the study aims to:<br />
■<br />
■<br />
■<br />
Analyze developments in the incentives that Indonesia <strong>of</strong>fers to foreign investors;<br />
Examine the impact <strong>of</strong> FDI incentives on the decision to locate FDI in Indonesia, especially in<br />
chemical companies; and<br />
Analyze the impact <strong>of</strong> FDI on the environmental and socio-economic development in<br />
Indonesia’s chemical industry.<br />
<strong>Sustainable</strong> <strong>Development</strong> <strong>Impacts</strong> <strong>of</strong> <strong>Investment</strong> <strong>Incentives</strong>: A <strong>Case</strong> Study <strong>of</strong> the Chemical Industry in Indonesia<br />
1
trade knowledge network<br />
In order to address the first objective, the research uses a qualitative descriptive method to identify<br />
existing investment incentives issued by the GOI, and the extent to which they are implemented on the<br />
ground in the chemical industry. The questionnaire was distributed to companies within the chemical<br />
industry in Banten (when possible, paired with in-depth interview) and in-depth interviews were also<br />
held with stakeholders who live in the area.<br />
Regression analysis was used to achieve the second research objective (see Annex 2 for further details).<br />
The influence <strong>of</strong> FDI incentives on actual FDI figures in Indonesia was analyzed, with special reference<br />
to the chemical industry. Explanatory variables were not only limited to investment incentives but also<br />
various factors that influence the decision to invest. Such variables include the domestic and world<br />
lending interest rate, inflation, and various incentives, which include environment protection standards<br />
(to compare emission standards).<br />
In the beginning, the regression in our proposal included more complex variables, particularly for<br />
incentive variables. However, we found that Indonesia does not have incentives variables for the period<br />
used in our study. For example, Law <strong>of</strong> 1967 stated that there were tax incentives and import duty<br />
incentives for foreign companies, but starting in 1983, most <strong>of</strong> the incentives were amended by Law <strong>of</strong><br />
Taxes. The chemical industry FDI had just started its business in Indonesia in 1992; hence we are quite<br />
sure that the companies did not consider tax incentives as the main reason to invest in Indonesia. This<br />
statement is supported by the interview results <strong>of</strong> six company respondents. Our regression is derived<br />
from the model used by Lipsey (1999), Chantasaswat (2004), and Gast (2005).<br />
Quarterly data from first quarter <strong>of</strong> 1990 to fourth quarter <strong>of</strong> 2006 were used in the regression equation.<br />
The following regression function was used:<br />
Whereby:<br />
■<br />
■<br />
■<br />
■<br />
FDI t is real foreign direct investment (billion rupiah).<br />
gdp t is real gross domestic product (billion rupiah).<br />
ISBI-INF t is Bank Indonesia Rate minus Indonesia Inflation. This is the measure <strong>of</strong> real Bank<br />
Indonesia rate.<br />
LIBOR-INFF t is LIBOR interest rate minus U.S. inflation. This is the measure <strong>of</strong> the real<br />
foreign (world) interest rate.<br />
■ rer t is the real exchange rate <strong>of</strong> rupiah for the $.<br />
■<br />
INCTV t is the dummy variable for investment incentive in Indonesia. The incentive dummy is used<br />
to proxy for foreign shareholding, which rose to 100 per cent <strong>of</strong> shares since 1994. In the same year,<br />
the government enacted a regulation that made it easier than before for foreign workers to stay in<br />
Indonesia. The dummy variable used was 1 for 1994 and above and 0 for the period prior to 1994.<br />
Lower case figures in the equation represent log value. Technically, FDI figures were not transformed<br />
into a natural logarithm because the figures for some years were negative values. Smoothing the FDI<br />
variable was done by using FDI/1000.<br />
2<br />
<strong>Sustainable</strong> <strong>Development</strong> <strong>Impacts</strong> <strong>of</strong> <strong>Investment</strong> <strong>Incentives</strong>: A <strong>Case</strong> Study <strong>of</strong> the Chemical Industry in Indonesia
trade knowledge network<br />
Besides regression, the research collected primary data, which were used to answer the second objective. The<br />
researchers conducted in-depth interviews with businessmen involved in the chemical industry to obtain their<br />
perception about the impact <strong>of</strong> various FDI incentives on their investment decisions. The 10 companies<br />
interviewed are in the chemical industry in Banten (where there is a cluster <strong>of</strong> chemical companies).<br />
To address the third objective, the research team used field observation and qualitative analysis. Focus<br />
group discussions were carried out with several key stakeholders, who among others, included<br />
practitioners in the chemical industry, related authorities, parties responsible for controlling<br />
environmental protection and members <strong>of</strong> society who use chemical products.<br />
Field research was carried out in Anyer and Merak industrial areas in Banten. The following reasons were<br />
behind the decision to take samples in Banten:<br />
■<br />
■<br />
Indonesia has four chemical industrial centres: Medan, Banten, East Java and East Kalimantan.<br />
Banten was chosen because it is the nearest area to Yogyakarta (the location <strong>of</strong> Center <strong>of</strong> Asia<br />
Pacific Studies).<br />
The chemical industry located in Gresik (East Java) is in the main state-owned facility, and<br />
hence falls outside the privately owned FDI criteria.<br />
Questionnaires were distributed to 15 companies as listed in Table 1.<br />
Table 1. Companies targeted by the survey<br />
No Company Name Plant/Site<br />
1 PT.NIPPON SHOKUBAI INDONESIA Kawasan Industri Panca Puri<br />
JI . Raya Anyer Km.122 Ciwandan, Cilegon, Indonesia<br />
2 PT.CHANDRA ASRI Jl. Raya Anyer Km. 123<br />
Ciwandan, Cilegon, Banten, Indonesia<br />
3 PT. TRIPOLYTA INDONESIA,Tbk. Jl. Raya Anyer Km. 123 Ciwandan, Cilegon, Banten<br />
www.tripolyta.com<br />
4 PT AMOCO MITSUI PTA INDONESIA Komplek PENI, Jl. Raya Merak Km. 116<br />
Banten, Indonesia<br />
5 PT. ASAHIMAS CHEMICAL Desa Gunung Sugih, Jl. Raya Anyer Km. 122,<br />
www.asc.co.id<br />
Cilegon, Banten, Indonesia<br />
6 PT. DOW CHEMICAL INDONESIA Jalan Raya Merak Km. 117.5<br />
Cilegon 42438, Banten, Indonesia<br />
7 PT. UNGGUL INDAH CAHAYA,Tbk Jl. Raya Cilegon - Merak, Km. 117.5 Desa Gerem, Kecamatan Pulomerak,<br />
www.uic.co.id<br />
Banten, Indonesia.<br />
8 PT. TITAN Petrokimia Nusantara Jl. Raya Merak Km. 116 Desa Rawa Arum, Pulo Merak,<br />
Banten, Indonesia<br />
9 PT. CABOT INDONESIA Jl. Amerika I - Kav. A5, Kawasan Industri Estate Cilegon,<br />
Indonesia<br />
10 PT. LAUTAN OTSUKA CHEMICAL (LOC) Factory address: Jl. Raya Anyer Km.123<br />
Cilegon, Banten<br />
11 PT. POLYPET KARYAPERSADA Jl. Raya Anyer Km. 121, Ciwandan<br />
http://www.polypet.co.id/<br />
Cilegon, Banten, Indonesia<br />
12 PT. POLYPRIMA KARYAREKSA Jl. Raya Anyer Km.121<br />
http://www.polyprima.co.id<br />
Ciwandan, Cilegon, Banten<br />
13 PT. BLUESCOPE STEEL INDONESIA Krakatau Industrial Estate Cilegon (KIEC)<br />
www.bluescopesteelasia.com<br />
Jl. Asia Raya Kav. O2 Cilegon, Banten<br />
14 PT. DOVER CHEMICAL Jl. Raya Merak Km 117, Desa Gerem, Gerogol<br />
www.dovechem.com<br />
Kodya Cilegon, Banten, Indonesia<br />
15 PT BAYER MATERIAL SCIENCE INDONESIA Jl. Raya Anyer Km. 121 Tanjung Leneng, Ciwandan Cilegon, Banten,<br />
Indonesia<br />
<strong>Sustainable</strong> <strong>Development</strong> <strong>Impacts</strong> <strong>of</strong> <strong>Investment</strong> <strong>Incentives</strong>: A <strong>Case</strong> Study <strong>of</strong> the Chemical Industry in Indonesia<br />
3
trade knowledge network<br />
According to the Ministry <strong>of</strong> Environmental Protection sources (not the National <strong>Investment</strong><br />
Coordination Board), Banten has FDI in these 15 chemical companies, on which the research team<br />
collected data and made observations. The response rate to the questionnaires was 40 per cent, with a<br />
sample <strong>of</strong> six companies providing data for further analysis. All six companies are involved with the<br />
chemical industry as well as foreign direct investment. One <strong>of</strong> the companies in the sample is the largest<br />
chemical company in Indonesia.<br />
Subsequently, the research team conducted in-depth interviews concerning motivation and business<br />
developments in Indonesia. Observational findings indicated that three companies (50 per cent) were<br />
established prior to 1992, and three companies (50 per cent) were established during the 1992–1997<br />
period. Respondent companies that started up prior to 1992 are considered to have commenced in<br />
1992.<br />
With respect to investors’ origins, three firms are from Japan; one firm is from Malaysia, one firm is from<br />
Singapore, and one is from Japan and the United Kingdom. Viewed from the perspective <strong>of</strong> structure<br />
<strong>of</strong> ownership, 50 per cent <strong>of</strong> interviewed companies are fully fledged foreign companies, and the rest<br />
joint venture companies.<br />
2 Overview <strong>of</strong> <strong>Investment</strong> <strong>Incentives</strong><br />
Indonesia started providing incentives to foreign investors in 1967 when Law No. 1/1967 came into<br />
effect (see Annex 1 for a list <strong>of</strong> investment-related regulations). Lack <strong>of</strong> capital, experience and<br />
technology hampered Indonesia’s efforts to transform its economic potential into real economic growth.<br />
Therefore, the underlying goal <strong>of</strong> <strong>of</strong>fering incentives to foreign investors was to transform its resources<br />
into real economic strength through investment, technology, expansion <strong>of</strong> knowledge, and enhancement<br />
<strong>of</strong> skills and organizational managerial capabilities.<br />
Law No. 1/1967 on Foreign <strong>Investment</strong> <strong>of</strong>fered tax and levy reduction and exemptions to foreign capital<br />
enterprises.<br />
a) Foreign capital enterprises were granted tax exemption incentives such as:<br />
■<br />
■<br />
■<br />
■<br />
■<br />
Exemptions from corporate taxes on pr<strong>of</strong>its during a specified period not to exceed five years<br />
from the commencement <strong>of</strong> enterprise production.<br />
Exemptions from dividend taxes on some <strong>of</strong> the accrued pr<strong>of</strong>its paid to shareholders as long as<br />
these pr<strong>of</strong>its are earned during a period that does not exceed five years from the commencement<br />
<strong>of</strong> enterprise production.<br />
Exemption from corporate tax on pr<strong>of</strong>its accruing to capital subtraction <strong>of</strong> taxes and other<br />
financial obligations in Indonesia that are reinvested in the enterprise in Indonesia, for a<br />
specified period not exceeding five years from the time <strong>of</strong> reinvestment.<br />
Exemption from import duties on fixed assets such as machinery, tools or instruments needed<br />
for the operation <strong>of</strong> said enterprise at the time <strong>of</strong> entry into Indonesia.<br />
Exemption from capital stamp duties on the issuance <strong>of</strong> capital originating from foreign<br />
investment.<br />
4<br />
<strong>Sustainable</strong> <strong>Development</strong> <strong>Impacts</strong> <strong>of</strong> <strong>Investment</strong> <strong>Incentives</strong>: A <strong>Case</strong> Study <strong>of</strong> the Chemical Industry in Indonesia
trade knowledge network<br />
b) Relief incentives were also granted:<br />
■<br />
■<br />
■<br />
■<br />
Corporate tax relief through a proportional rate <strong>of</strong> not more than 50 per cent for a period not<br />
exceeding five years after expiration <strong>of</strong> the exemption period (as intended by point a.1. above).<br />
Relief by <strong>of</strong>fsetting losses suffered during the period <strong>of</strong> exemption intended by point a.1. above,<br />
and against pr<strong>of</strong>it subject to tax following the exemption period.<br />
Allowing accelerated depreciation <strong>of</strong> fixed assets.<br />
The incentives on taxes and other levies were granted after considering the priority on fields <strong>of</strong><br />
activity. Details <strong>of</strong> activity fields prioritized were determined whenever the government prepares<br />
medium- and long-term development plans, taking into consideration developments in the<br />
economy and technology.<br />
Law No. 1 <strong>of</strong> 1967 was amended by Law No. 11 <strong>of</strong> 1970 on Amendments and Supplement to Law No.<br />
1 <strong>of</strong> 1967. Essentially, the tax concessions were the same: foreign capital enterprises were granted an<br />
exemption from capital stamp duties, import duties and sales tax (import) <strong>of</strong> capital goods (fixed assets)<br />
such as machinery, tools or instruments needed for the operation <strong>of</strong> said enterprise at the time <strong>of</strong> entry<br />
into Indonesia, and exemption from corporate tax. In Law No. 11 <strong>of</strong> 1970, foreign capital enterprises<br />
were granted additional tax incentives as follows:<br />
■<br />
■<br />
■<br />
Exemption from conversion <strong>of</strong> ownership fees for first-time ship registration documents until<br />
two years after the enterprise commences production.<br />
For new enterprises investing in fields <strong>of</strong> priority activities, the Minister <strong>of</strong> Finance has the<br />
power to grant an exemption from corporate tax during a specified period <strong>of</strong> at least two years<br />
(tax holiday) from the moment the enterprise commences production. Other concessions, by<br />
Peraturan Pemerintah/PP (Government Regulations), could be given to foreign capital<br />
enterprises that have made a great contribution to economic growth.<br />
Import duties and sales taxes (import) on capital goods imported by foreign enterprises would<br />
be specified in Surat Keputusan Menteri Keuangan (Decree <strong>of</strong> The Minister <strong>of</strong> Finance) No.<br />
Kep-289/MK/IV/4/1971. The regulation granted exemptions/relief <strong>of</strong> import duties on<br />
machinery, tools or spare parts needed for the development and production <strong>of</strong> foreign<br />
enterprise.<br />
<strong>Incentives</strong> to foreign enterprises have experienced ups and downs as a result <strong>of</strong> political developments<br />
and the development <strong>of</strong> the Indonesian economy. In 1974, the government, in a reaction to the Malari<br />
riots, limited access <strong>of</strong> foreign investors, including by: 1<br />
■<br />
■<br />
■<br />
Requiring foreign investors to form partnerships with local investors in terms <strong>of</strong> shares and<br />
equities ownership.<br />
Tightening foreign workers’ regulations.<br />
Closing several business sectors to joint investment.<br />
1 Hill (2001), p. 133<br />
<strong>Sustainable</strong> <strong>Development</strong> <strong>Impacts</strong> <strong>of</strong> <strong>Investment</strong> <strong>Incentives</strong>: A <strong>Case</strong> Study <strong>of</strong> the Chemical Industry in Indonesia<br />
5
trade knowledge network<br />
Moreover, until the late-1970s, the entry procedure for foreign enterprises remained obscure, complex,<br />
time-consuming and costly. In 1984, all tax concessions were rescinded in line with Law No. 7/1983 on<br />
Income Tax. By the time the law was fully implemented, all tax concessions given to foreign enterprises<br />
as regulated in Law No. 1/1967 and Law No. 11 /1970 had been revoked. Consequently, 1984 tax<br />
regulations, especially those concerning corporate income tax, were harmonized, meaning that both<br />
foreign and local investors paid the same tax rates.<br />
In 1985, as a result <strong>of</strong> weakening economic growth, Indonesia tried to attract foreign investment by<br />
granting a limited number <strong>of</strong> incentives through the simplification <strong>of</strong> administration procedures and<br />
investment deregulation implemented between 1986 and 1988. The aftermath <strong>of</strong> such incentives saw a<br />
rise in export-oriented foreign investment. One <strong>of</strong> the incentives that had significant impact on<br />
investment was the regulation that allowed foreign companies to own 100 per cent <strong>of</strong> company shares.<br />
This regulation was embodied in Government Regulation No. 20/1994 on Share Ownership in<br />
Companies Established for Foreign <strong>Investment</strong>. Before 1994, share ownership was regulated under<br />
Government Regulation No. 17/1992, which allowed the establishment <strong>of</strong> foreign companies that met<br />
several criteria: at the time <strong>of</strong> establishment, five per cent <strong>of</strong> company shares were in domestic hands,<br />
which had to be increased to a minimum <strong>of</strong> 20 per cent not longer than ten to twenty years for specified<br />
regions such as Irian, Maluku and other areas outside Java.<br />
As regards FDI in the chemical industry, the regulation on shared ownership had significant effects. In<br />
the aftermath <strong>of</strong> the regulation, the first FDI-based chemical industry with 100 per cent <strong>of</strong> its shares<br />
under foreign ownership, PT Chandra Asri, was established. 2<br />
Other than 100 per cent foreign share ownership, the government <strong>of</strong>fered several additional incentives<br />
to foreign investors. These took the form <strong>of</strong> simplified residence permit arrangements for foreigners as<br />
regulated in Government Regulation No. 32/1994 on Visas, Entry Permits, and Immigration Permits.<br />
As mentioned earlier, in 1974, the regulation on foreign workers was tightened. This regulation was<br />
embodied in Presidential Decree No. 23/1974 on Limiting the Employment <strong>of</strong> New Foreign Workers.<br />
The regulation stipulated that the use <strong>of</strong> foreign workers in foreign companies and other activities in<br />
Indonesia was henceforth limited and regulated by the Minister <strong>of</strong> Labor Affairs. Later regulations have<br />
since allowed foreign workers to possess residence permits.<br />
Other incentives <strong>of</strong>fered related to opening business sectors to foreign investors which were hitherto<br />
closed (commonly called a negative list). Business sectors that used to be closed to foreign investors,<br />
according to Law No. 1/1967, were opened to 95 per cent ownership by foreign investors in 2000 (by<br />
Presidential Decree No. 96/2000). The sectors involved included harbour development and exertion;<br />
production, transmission and distribution <strong>of</strong> electric power; aviation; drinking water management and<br />
supplies; and atomic energy development.<br />
The most extensive incentive was the enactment <strong>of</strong> Law No. 25/2007 on <strong>Investment</strong>. The law essentially<br />
allows equalization and non-discriminatory treatment for both foreign and domestic investors. Besides<br />
stipulating equal treatment, the law also guarantees that there will not be nationalization or<br />
expropriation against the proprietary rights <strong>of</strong> investors and <strong>of</strong>fers investors the right to transfer and<br />
repatriate in foreign currencies.<br />
Since Law No. 7/1983 on Income Taxes came into effect, fiscal incentives tailored to investors in<br />
Indonesia no longer focus on foreign and domestic dimensions, but rather are oriented toward specified<br />
2 Hill (1996), p. 177<br />
6<br />
<strong>Sustainable</strong> <strong>Development</strong> <strong>Impacts</strong> <strong>of</strong> <strong>Investment</strong> <strong>Incentives</strong>: A <strong>Case</strong> Study <strong>of</strong> the Chemical Industry in Indonesia
trade knowledge network<br />
products and regions. In terms <strong>of</strong> tax incentives, there are few regulations, for example Government<br />
Regulation No. 45/1996 on Income Tax on Obligatory Tax Income for Specified Business Industry;<br />
Government Regulation No. 147/2000 on Tax Treatment in Integrated Regional Economic<br />
<strong>Development</strong> Zones (KAPET); Government Regulation No. 148/2000 on Corporate Taxes Facilities<br />
for <strong>Investment</strong> in Specified Business Sectors and/or Specified Regions; Government Regulation No.<br />
12/2001 on Import and/or Delivery <strong>of</strong> Taxable Specified Goods Strategic in Nature Exempt from Value<br />
Added Tax; and Government Regulation No. 1/2007 on Corporate Tax Facilities for <strong>Investment</strong>s in<br />
Specified Business Sectors and/or Specified Regions.<br />
Government Regulation No. 1/2007 replaced Government Regulation No. 148/2000, which faced<br />
implementation hurdles as there were presidential decrees issued to regulate specified sectors and/or<br />
specified regions granted such facilities. Government Regulation No.1/2007 <strong>of</strong>fers income tax<br />
dispensation facilities to 15 sectors, one <strong>of</strong> which is the chemical industry (both inorganic and organic).<br />
The pharmaceutical industry is one <strong>of</strong> the other chemical industries that was granted the facility. The<br />
incentive is strongly related to the petrochemical industry, one <strong>of</strong> the strategic industries in the<br />
Manufacturing Industry <strong>Development</strong> Blueprint in Indonesia Year 2007 by Ministry <strong>of</strong> Industry.<br />
The blueprint states that the chemical industry development strategy encompasses many things, for<br />
example cluster location development (i.e., Kalimantan, Tuban and Cilegon), while strategies to achieve<br />
supporting investment and business climates are implemented through fiscal, monetary and<br />
administration incentives, including legal and safety guarantees. The fiscal incentives in particular are<br />
promoted through tax incentive policies.<br />
Other laws enacted to support the investment regime include Law No. 40/2007 on Limited Liability<br />
Companies; Presidential Regulation No. 76/2007 on the Formulation Criteria and Requirement <strong>of</strong> List<br />
<strong>of</strong> Lines <strong>of</strong> Businesses Closed and Open, Conditional to <strong>Investment</strong>; Presidential Regulation No.<br />
111/2007 on the Amendment <strong>of</strong> Presidential Regulation No. 77/2007 on The List <strong>of</strong> Lines <strong>of</strong> Businesses<br />
Closed and Open with Conditions to <strong>Investment</strong>; Government Regulation No. 7/2007 on the Import<br />
and/or Transfer <strong>of</strong> Strategic Certain Taxable Items, which include the Value Added Tax Exemption.<br />
3 Bilateral and Multilateral <strong>Investment</strong> Treaties and<br />
Negotiations<br />
3.1 Bilateral agreements<br />
The Government <strong>of</strong> Indonesia has signed bilateral investment treaties (BITs) with other countries under<br />
investment guarantee agreements (IGA). By signing an IGA, the government guarantees both<br />
compensation and transfer <strong>of</strong> losses that occur as a consequence <strong>of</strong> wars and other armed conflicts,<br />
revolutions, states <strong>of</strong> national emergency, revolts, insurrections or riots. The number <strong>of</strong> agreements<br />
signed has increased gradually from 33 in 1996 to 61 in 2006. The latest countries to sign were Japan<br />
and Russia in 2007, bringing the total IGAs signed by Indonesia to date to 63. 3 On April 16, 2008,<br />
Indonesia agreed to begin bilateral investment treaty negotiations with Canada under Foreign<br />
<strong>Investment</strong> Promotion and Protection Agreement (FIPA).<br />
3 These countries include Argentina, Australia, Bangladesh, Belgium, Cambodia, Chile, Cuba, Czech Republic, Denmark, Egypt,<br />
Finland, France, Germany, Hungary, India, Italy, Jamaica, Jordan, Kyrgyzstan, Laos, Malaysia, Mauritius, Mongolia, Morocco,<br />
Mozambique, North Korea, Norway, Pakistan, People’s Republic <strong>of</strong> China, Poland, Qatar, Romania, Singapore, Slovak Republic,<br />
South Korea, Spain, Sri Lanka, Sudan, Suriname, Syria, Sweden, Switzerland, Thailand, The Netherlands, Tunisia, Turkey,<br />
Turkmenistan, Ukraine, United Kingdom, Uzbekistan, Vietnam, Yemen and Zimbabwe.<br />
<strong>Sustainable</strong> <strong>Development</strong> <strong>Impacts</strong> <strong>of</strong> <strong>Investment</strong> <strong>Incentives</strong>: A <strong>Case</strong> Study <strong>of</strong> the Chemical Industry in Indonesia<br />
7
trade knowledge network<br />
Indonesia is currently discussing a free trade agreement (FTA) with the U.S. that may include<br />
investment provisions. However, prospects for an FTA are hampered by free trade “fatigue” in the U.S.;<br />
delays and challenges to implementing critical reforms in Indonesia; and heavy demands on Indonesia<br />
by the U.S. that are part <strong>of</strong> the FTA process. Closer ties with the U.S. are not a “political plus” in<br />
Indonesia today; and the Doha Round <strong>of</strong> trade talks at the World Trade Organization (WTO) is in need<br />
<strong>of</strong> more immediate attention before bilateral negotiations are likely to proceed. 4<br />
Although Indonesia has clearly decided to go down the path <strong>of</strong> signing BITs to attract greater FDI flows,<br />
there is no evidence or <strong>of</strong>ficial data that supports the idea that more BITs have resulted in more investments.<br />
In addition, the Government <strong>of</strong> Indonesia has signed a number <strong>of</strong> agreements (tax treaties) to avoid<br />
incidental double taxation on certain income such as pr<strong>of</strong>its, dividends, interests, fees and royalties,<br />
namely the Avoidance <strong>of</strong> Double Taxation Agreements. Since 1996, the number <strong>of</strong> bilateral agreements<br />
has increased to 47 agreements in 1997, 50 agreements in 2002, and has since then risen to 57<br />
agreements. 5 The benefit <strong>of</strong> signing the agreements lies in the fact that the process leads to the reduction<br />
<strong>of</strong> withholding tax rates applied to residents <strong>of</strong> the signatory countries based on the provisions <strong>of</strong> the<br />
particular tax treaty. Tax treaties with other countries are being negotiated.<br />
3.2 Multilateral agreements<br />
Since 1992, Indonesia has been a member <strong>of</strong> the Multilateral <strong>Investment</strong> Guarantee Agency (MIGA),<br />
an organization that protects investments against various political risks. Membership to the Agency<br />
ensures that Indonesia guarantees a favourable investment climate.<br />
As a member <strong>of</strong> the Association <strong>of</strong> Southeast Asian Nations (ASEAN), Indonesia signed the Framework<br />
Agreement on the ASEAN <strong>Investment</strong> Area (AIA) on October 7, 1998 in Manila. The AIA aims to<br />
make ASEAN a competitive, conducive and liberal investment area by the following actions:<br />
■<br />
■<br />
■<br />
■<br />
■<br />
Implementing coordinated ASEAN investment cooperation and facilitation programs;<br />
Implementing a coordinated promotion program and investment awareness activities;<br />
Immediate opening up <strong>of</strong> all industries for investment, with some exceptions as specified in the<br />
Temporary Exclusion List (TEL) and the Sensitive List (SL), to ASEAN investors by 2010 and<br />
to all investors by 2020;<br />
Granting immediate national treatment, with some exceptions as specified in the Temporary<br />
Exclusion List (TEL) and the Sensitive List (SL), to ASEAN investors by 2010 and to all<br />
investors by 2020;<br />
Actively involving the private sector in the AIA development process;<br />
4 Hufbauer and Katz (2007)<br />
5 Indonesia has signed agreements with the following countries: Algeria, Australia, Austria, Belgium, Bulgaria, Brunei Darussalam,<br />
Canada, Czech, China, Denmark, Finland, Egypt, France, Germany, Hungary, India, Italy, Japan, Jordan, Rep. <strong>of</strong> Korea,<br />
Democratic People’s Republic <strong>of</strong> Korea, Kuwait, Luxembourg, Malaysia, Mexico, Mongolia, Netherlands, New Zealand, Norway,<br />
Pakistan, Philippines, Poland, Romania, Russia, Saudi Arabia, Seychelles, Singapore, Slovak, South Africa, Spain, Sri Lanka, Sudan,<br />
Sweden, Switzerland, Syria, Taipei, Thailand, Tunisia, Turkey, Ukraine, Uni Arab Emirate (UAE), United Kingdom, United States<br />
<strong>of</strong> America, Uzbekistan, Venezuela and Vietnam.<br />
8<br />
<strong>Sustainable</strong> <strong>Development</strong> <strong>Impacts</strong> <strong>of</strong> <strong>Investment</strong> <strong>Incentives</strong>: A <strong>Case</strong> Study <strong>of</strong> the Chemical Industry in Indonesia
trade knowledge network<br />
■<br />
■<br />
■<br />
■<br />
Promoting freer flows <strong>of</strong> capital, skilled labour, pr<strong>of</strong>essional expertise and technology amongst<br />
the member countries;<br />
Providing transparency in investment policies, rules, procedures and administrative processes;<br />
Providing a more streamlined and simplified investment process; and<br />
Eliminating investment barriers and liberalizing investment rules and policies in the sectors<br />
covered by the Agreement.<br />
The benefit <strong>of</strong> AIA arrangements for investors are: greater investment access to industries and economic<br />
sectors as a result <strong>of</strong> the opening up <strong>of</strong> industries under the AIA arrangements, if investors qualify as<br />
ASEAN investors; national treatment, if investors qualify as ASEAN investors; greater transparency,<br />
information and awareness <strong>of</strong> investment opportunities in the region; more liberal and competitive<br />
investment regimes; and lower transaction costs for business operations across the region.<br />
The ASEAN ministers, including from Indonesia, want to combine, revise, and enhance investment<br />
agreements in ASEAN, i.e. the ASEAN <strong>Investment</strong> Area (AIA) Agreement and the ASEAN <strong>Investment</strong><br />
Guarantee Agreement (IGA) into one comprehensive agreement, called the ASEAN Comprehensive<br />
<strong>Investment</strong> Agreement (ACIA). It is scheduled to be signed at the ASEAN Summit in early 2009. The<br />
objective <strong>of</strong> ACIA is to enhance the investment environment in ASEAN to attract domestic investments<br />
and FDI by including elements <strong>of</strong> transparency, consistency, and detailed mechanisms to address<br />
disputes. Some <strong>of</strong> the differences between ACIA and AIA/ASEAN IGA are:<br />
■<br />
■<br />
■<br />
■<br />
■<br />
ACIA grants immediate benefits to both ASEAN investors and ASEAN-based foreign investors<br />
(in the AIA Agreement, there were differentiated timelines).<br />
In the ACIA, the procedures for investors to register their investment in order to benefit from<br />
protection under the agreement is outlined clearly so that the procedures are transparent to<br />
investors.<br />
Policy-makers will be able to more easily consider the views and feedback <strong>of</strong> the business<br />
community, as the ACIA has a consultations mechanism giving ASEAN countries an <strong>of</strong>ficial<br />
platform to stay engaged on ACIA matters and its implementation, (which the AIA Agreement<br />
did not have).<br />
The ACIA stipulates that if any country modifies their commitments that lead to an investor<br />
being negatively affected, the country would have to give compensation (in the AIA Agreement,<br />
there was no such provision).<br />
The ACIA has Investor-to-State Dispute Settlement (ISDS) provisions that are more<br />
comprehensive and detailed (than under ASEAN IGA).<br />
The benefits <strong>of</strong> ACIA for the investors are:<br />
1. ASEAN-based investors can enjoy non-discriminatory treatment when they invest in other<br />
ASEAN countries. They will be granted similar treatment as domestic (host country) investors,<br />
and also similar treatment vis-à-vis other ASEAN-based investors;<br />
<strong>Sustainable</strong> <strong>Development</strong> <strong>Impacts</strong> <strong>of</strong> <strong>Investment</strong> <strong>Incentives</strong>: A <strong>Case</strong> Study <strong>of</strong> the Chemical Industry in Indonesia<br />
9
trade knowledge network<br />
2. In case <strong>of</strong> disputes with host governments, investors have a choice to bring a claim in domestic<br />
courts (where applicable) or international arbitration; and<br />
3. Investors and their investments will be granted fair and equitable treatment and full protection<br />
and security.<br />
ASEAN members are cooperating with China, Japan and Korea in ASEAN Plus Three (APT). In<br />
November 2007, APT formulated a master plan to enhance APT relations and cooperation from 2007<br />
through 2017. The work plan for investments are as follows:<br />
■<br />
■<br />
■<br />
■<br />
■<br />
To promote the transparency <strong>of</strong> policies to facilitate trade and investment expansion, including<br />
those enhancing conducive business environments, business mobility and trade financing;<br />
To provide regional support to foster an attractive investment climate through sharing best<br />
practices, giving mutual encouragement, responding to the requirements <strong>of</strong> investors, extending<br />
technical assistance and exchanging statistical information;<br />
To consider conducting comprehensive studies on the possible establishment <strong>of</strong> an East Asia<br />
<strong>Investment</strong> Area by expanding the ASEAN <strong>Investment</strong> Area;<br />
To promote cooperation among investment promotion agencies and facilitate mutual<br />
investment promotion missions by respective business communities; and<br />
To promote an understanding <strong>of</strong> each other’s policies, regulations and legislation pertaining or<br />
related to trade, competition policy, services, investment and industry as well as the sharing <strong>of</strong><br />
experiences and best practices among ASEAN Plus Three countries.<br />
ASEAN has also been negotiating FTAs with dialogue partners Australia, New Zealand, Korea and China.<br />
At the sub-regional level, two agreements are in place: BIMP–EAGA (Brunei Darussalam – Indonesia<br />
– Malaysia – Philippines – East Asian Growth Area), and IMT-GT (Indonesia – Malaysia – Thailand –<br />
Growth Triangle), which declared cooperation within the framework <strong>of</strong> investment facilitation and<br />
promotion.<br />
Indonesia is also a signatory member <strong>of</strong> the International Center on the Settlement <strong>of</strong> <strong>Investment</strong><br />
Disputes (ICSID) in Washington D.C. and has signed the UNCITRAL (United Nations Commission<br />
on International Trade Laws) arbitration rules in order to deal with foreign investment disputes. In case<br />
there are two parties to a dispute that is submitted for arbitration, the Indonesian <strong>Investment</strong> Arbitration<br />
Board (Badan Arbitrase Nasional Indonesia, BANI) renders assistance. Indonesia is also party to the<br />
1958 New York Convention on the Recognition and Enforcement <strong>of</strong> Foreign Arbitral Awards. However,<br />
in practice, foreign companies have encountered difficulties in enforcing foreign arbitration awards or<br />
enforcing the judicial system to honour arbitration clauses in contracts that involve foreign investors.<br />
4 <strong>Impacts</strong> <strong>of</strong> <strong>Investment</strong> <strong>Incentives</strong> on FDI Decisions<br />
4.1 Depiction <strong>of</strong> developments in FDI in Indonesia<br />
Overall, FDI in the chemical and pharmaceutical industry has experienced very rapid growth during the<br />
2002–2007 periods (growth contracted in 2006 after the macroeconomic instability in 2005). This is<br />
an indication that Indonesia continues to be an attractive destination for investment in the chemical<br />
10<br />
<strong>Sustainable</strong> <strong>Development</strong> <strong>Impacts</strong> <strong>of</strong> <strong>Investment</strong> <strong>Incentives</strong>: A <strong>Case</strong> Study <strong>of</strong> the Chemical Industry in Indonesia
trade knowledge network<br />
industry. In 2002, FDI in the chemical and pharmaceutical industry was a mere $530.9 million, 6 but<br />
as <strong>of</strong> September 30, 2007, it had surged to $1,563.7 million. There was a faster upward trend in the<br />
investment in the chemical and pharmaceutical industry over the 2002–2007 periods as compared with<br />
other industries in Indonesia. Realized project investment in the industry from 2002 to September 2007<br />
was 26 projects, 29 projects, 39 projects, 41 projects, 32 projects and 26 projects, respectively.<br />
Figure 1. Value <strong>of</strong> foreign direct investment realization by sector, 2002 – September 30, 2007 ($ million)<br />
Source: National <strong>Investment</strong> Coordination Board<br />
Table 2. Ranking <strong>of</strong> direct investment realization by sector, January 1–September 30, 2007<br />
Sector Project Value ($ million)<br />
Chemical and Pharmaceutical Industry 26 1,563.7<br />
Food Industry 45 572.1<br />
Paper and Printing Industry 10 428.5<br />
Motor Vehicles and Other Transport Equip. Ind. 29 336.9<br />
Metal, Machinery and Electronic Industry 80 265.3<br />
Wood Industry 13 125.5<br />
Rubber and Plastic Industry 26 116.5<br />
Textile Industry 53 114.0<br />
Leather Goods and Footwear Industry 7 33.2<br />
Other Industry 21 29.5<br />
Non-metallic Mineral Industry 5 26.8<br />
Medical, Precision Optical Instru., Watch & Clock Ind. 1 10.9<br />
Source: National <strong>Investment</strong> Coordination Board<br />
6 Unless otherwise indicated, all $ amounts are in U.S. dollars.<br />
<strong>Sustainable</strong> <strong>Development</strong> <strong>Impacts</strong> <strong>of</strong> <strong>Investment</strong> <strong>Incentives</strong>: A <strong>Case</strong> Study <strong>of</strong> the Chemical Industry in Indonesia<br />
11
trade knowledge network<br />
<strong>Investment</strong> realizations in the chemical and pharmaceutical industry between January 1 and September<br />
20, 2007 were high in the country (Table 2). Thus, despite having fewer projects than those recorded<br />
for the textile industries (53) and the metal, machinery and electronics industries (28), the chemical and<br />
pharmaceutical industry is foremost in returns due to the high value <strong>of</strong> the projects—$1,563.7 million<br />
compared to $265.3 million for textile and metal industries.<br />
Four countries contribute, i.e., Singapore, the United Kingdom, Japan and South Korea, constituting<br />
the major source <strong>of</strong> investments in the chemical and pharmaceutical industry. In 2007, Singapore<br />
invested in two projects with a value <strong>of</strong> $11.8 million, the United Kingdom made investments in four<br />
projects worth $1,312.6 million, while Japan and South Korean each had three investment projects<br />
worth $11.2 million and $120.5 million, respectively.<br />
According to the state <strong>of</strong> the base chemical industry and the chemical and pharmaceutical industry from<br />
1970 to 2007, FDI approvals show a significant improvement (Table 3). Total new investment stocks<br />
since 1970 are 794 projects, worth $86,647,174,000, while expansion <strong>of</strong> investment projects total 563<br />
projects, worth $9,071,321,000. The FDI agreements, however, are not always followed by realization.<br />
Table 3. FDI approval by state <strong>of</strong> development, 1970–2007<br />
Sector: Base chemical industry, chemical and pharmaceutical industry<br />
No Country New Expansion Status Alteration Total<br />
Project <strong>Investment</strong> Project <strong>Investment</strong> Project <strong>Investment</strong> Project <strong>Investment</strong><br />
(thousand $) (thousand $) (thousand $) (thousand $)<br />
1 Liberia 1 375,000 4 5,700 1 17,602 2 398,302<br />
2 Mauritania 1 515,000 0 - 0 - 1 51,500<br />
3 Mauritius 1 90,970 3 57,732 2 409,759 3 558,461<br />
4 Nigeria 1 1,000 0 - 0 - 1 1,000<br />
AFRICA 4 518,470 7 63,432 3 427,361 7 1,009,263<br />
5 United States 55 11,524,774 38 321,656 6 5,062,318 61 16,908,747<br />
6 Bahamas 1 2,000 1 5,500 3 31,042 4 38,542<br />
7 Cayman Islands 0 - 0 - 4 7,917 4 7,917<br />
8 Canada 5 536,025 4 4,153 0 - 5 540,178<br />
THE AMERICAS 61 12,062,799 43 331,309 13 5,101,277 74 17,495,384<br />
9 Hong Kong 31 5,823,876 17 330,122 10 143,813 41 6,297,811<br />
10 India 14 414,969 3 10,634 1 964 15 426,567<br />
11 Indonesia 0 - 0 - 0 - 0 -<br />
12 Japan 97 7,278,144 126 2,615,323 6 434,251 103 10,327,718<br />
13 South Korea 118 1,021,553 36 424,615 5 6,611 123 1,452,779<br />
14 Kuwait 1 1,661,019 0 - 0 - 1 1,661,019<br />
15 Malaysia 34 465,375 9 168,159 1 83,748 35 717,282<br />
16 Thailand 1 1,500 2 3,781 0 - 1 5,281<br />
17 China 16 42,113 3 13,475 1 1,601 17 57,189<br />
18 Saudi Arabia 5 7,517,900 0 - 0 - 5 7,517,900<br />
19 Singapore 64 1,096,391 34 362,260 16 239,553 80 1,698,204<br />
20 Sri Lanka 1 1,500 0 - 1 1,153 2 2,653<br />
21 Taiwan 62 193,600 22 57,200 7 7,363 69 258,163<br />
ASIA 444 25,517,938 252 3,985,570 48 919,059 492 30,422,567<br />
22 Australia 24 3,669,456 15 83,216 0 - 24 3,752,672<br />
AUSTRALIA 24 3,669,456 15 83,216 0 - 24 3,752,672<br />
12<br />
<strong>Sustainable</strong> <strong>Development</strong> <strong>Impacts</strong> <strong>of</strong> <strong>Investment</strong> <strong>Incentives</strong>: A <strong>Case</strong> Study <strong>of</strong> the Chemical Industry in Indonesia
trade knowledge network<br />
No Country New Expansion Status Alteration Total<br />
Project <strong>Investment</strong> Project <strong>Investment</strong> Project <strong>Investment</strong> Project <strong>Investment</strong><br />
(thousand $) (thousand $) (thousand $) (thousand $)<br />
23 The Netherlands 30 743,347 35 1,008,422 3 14,627 33 1,757,395<br />
24 Belgium 0 - 1 70 0 - 0 70<br />
25 Denmark 1 683 5 9,207 0 - 1 9,889<br />
26 Finland 0 - 1 1,600 0 - 0 1,600<br />
27 Hungary 1 117 0 - 0 - 1 117<br />
28 England 39 16,917,582 34 178,660 19 470,805 58 17,567,047<br />
29 Ireland 2 1,111 2 8,414 0 - 2 9,525<br />
30 Italy 6 39,438 0 - 0 - 6 39,438<br />
31 Germany 22 1,177,498 31 164,125 5 188,971 27 1,530,594<br />
32 Lichtenstein 0 - 0 - 1 217 1 217<br />
33 Luxembourg 1 175 3 1,330,597 0 - 1 1,330,772<br />
34 Norway 7 213,015 4 16,246 0 - 7 229,261<br />
35 France 10 44,364 11 102,582 0 - 10 146,946<br />
36 Spain 2 9,721 1 10,112 0 - 2 19,833<br />
37 Switzerland 22 279,615 24 221,479 0 - 22 501,094<br />
EUROPE 143 19,417,665 152 3,051,512 28 674,621 171 23,143,798<br />
38 Gabungan Negara 118 25,460,845 94 5,925,634 6 1,949,004 124 33,335,483<br />
Total 794 86,647,174 563 13,440,672 98 9,071,321 892 109,159,167<br />
Source: National <strong>Investment</strong> Coordination Board<br />
Table 4. PMA approval based on sub-sector, 1970–2007<br />
Sector: Base chemical industry, chemical and pharmaceutical industry<br />
Code Sector New Expansion Change <strong>of</strong> status Total<br />
Project <strong>Investment</strong> Project <strong>Investment</strong> Project <strong>Investment</strong> Project <strong>Investment</strong><br />
2411 Basic organic 339 15,322,915 199 25,153 42 3,377,657 381 26,425,725<br />
and inorganic<br />
chemical<br />
2412 Fertilizers 21 500,347 10 44,962 4 207,920 25 853,229<br />
2413 Synthetic resins 79 2,496,383 44 21,703 6 99,549 85 4,217,634<br />
2421 Pesticides and 19 126,673 22 83,975 5 10,478 24 221,126<br />
plantation<br />
generating<br />
chemicals<br />
2422 Paints, varnishes, 55 108,458 28 56,113 6 8,409 61 272,980<br />
lacquers<br />
2423 Pharmaceutical 70 266,893 83 54,217 7 12,549 77 533,659<br />
and herbal<br />
medicine<br />
2424 Soap, cleaning 40 162,862 64 84,143 8 654,793 48 2,101,798<br />
preparations,<br />
cosmetics<br />
2429 Chemicals 86 296,554 50 23,398 11 42,985 97 462,936<br />
2430 Artificial filament 34 1,020,516 54 48,064 5 227,827 39 3,196,406<br />
and staple fibre<br />
Basic chemical 794 86,646,693 563 475,197 98 6,068,684 892 109,090,574<br />
industry, chemical<br />
products and<br />
pharmaceuticals<br />
Source: National <strong>Investment</strong> Coordination Board<br />
<strong>Sustainable</strong> <strong>Development</strong> <strong>Impacts</strong> <strong>of</strong> <strong>Investment</strong> <strong>Incentives</strong>: A <strong>Case</strong> Study <strong>of</strong> the Chemical Industry in Indonesia<br />
13
trade knowledge network<br />
Asian countries are the largest foreign investors in the chemical industry, contributing 55 per cent <strong>of</strong><br />
total investment projects and 28 per cent <strong>of</strong> total investment value. Among Asian countries, Japan is the<br />
largest investor in the Indonesian chemical industry. European countries also contribute substantially to<br />
the investment value. Since 1970, there have been 171 projects worth US$3,752,672, or 19 per cent <strong>of</strong><br />
the total number <strong>of</strong> projects, and 21 per cent <strong>of</strong> total investment. England and The Netherlands are the<br />
two largest investment contributors from European countries. The growth in the number and value <strong>of</strong><br />
projects is an indication that Indonesia is an attractive place for investment. Table 4 shows FDI’s subsectors<br />
in the chemical industry for the 1970–2007 period.<br />
4.2 The impact <strong>of</strong> incentives on the decision to invest<br />
The regression results using variables foreign direct investment, real gross domestic product, real Bank<br />
Indonesia rate, real foreign (world) interest rate, real exchange rate <strong>of</strong> Rupiah for the dollar, and the<br />
dummy variable for investment incentive in Indonesia indicate that the foreign interest rate is the most<br />
significant variable that influences FDI in the chemical industry in Indonesia. Foreign interest rates are<br />
an important factor for investors, as high rates in the international market mean that the cost <strong>of</strong> external<br />
financing is high. Investors need a high return on their investment, which can be obtained by investing<br />
in developing countries like Indonesia. Therefore, when the international rate rises, FDI in Indonesia<br />
also rises because Indonesia has the developing country characteristic <strong>of</strong> high risk, high return.<br />
In contrast, other variables, which include incentives to investors such as allowing 100 per cent share<br />
ownership or extending the time allowed for foreign workers to stay in Indonesia, do not seem to have<br />
an impact on chemical companies’ decisions to invest in Indonesia. In the short run, GDP has no<br />
significant effect. However, GDP is a significant variable in the long run. Gross domestic product is a<br />
measure <strong>of</strong> the state <strong>of</strong> the economy, which implies that higher GDP translates into higher purchasing<br />
power or market, which in turn increases investment. The real exchange rate <strong>of</strong> the Rupiah against the<br />
dollar also has significant influence on foreign direct investment—depreciation <strong>of</strong> the Rupiah adversely<br />
affects foreign direct investment. Depreciation represents an economic condition that reduces the<br />
investors’ return in placing their capital in the country.<br />
In-depth interviews with six sample companies confirmed that factors other than incentives were the key<br />
determinants influencing foreign companies’ decision to invest in Indonesia. The large Indonesian market is the<br />
single most important factor that underlies their decision to invest in Indonesia (Table 5). Sample companies<br />
believe that the large population <strong>of</strong>fers potentially immense business prospects and opportunities. The large<br />
market also makes it possible for output produced by one industry to serve as inputs for other industries.<br />
Another source <strong>of</strong> motivation for foreign investor includes the low labour cost and availability <strong>of</strong> inputs.<br />
Table 5. <strong>Investment</strong> motivation<br />
<strong>Investment</strong> motivation Number <strong>of</strong> Companies Respondent Percentage ( per cent)<br />
Big market 6 100<br />
Incentive 1 16.7<br />
Low cost <strong>of</strong> labour 1 16.7<br />
Availability <strong>of</strong> input 1 16.7<br />
Source: in depth interview<br />
Some companies also consider a conducive social-political environment and unambiguous regulations<br />
as key factors behind their decision to undertake new investments and expand their operations. Some<br />
companies still consider the 1998 economic crisis and recent macroeconomic vulnerability as important<br />
14<br />
<strong>Sustainable</strong> <strong>Development</strong> <strong>Impacts</strong> <strong>of</strong> <strong>Investment</strong> <strong>Incentives</strong>: A <strong>Case</strong> Study <strong>of</strong> the Chemical Industry in Indonesia
trade knowledge network<br />
factors that influence their decisions not to make new investments and expand their operations in<br />
Indonesia. A few regulations, such as those on regional decentralization, were perceived by some<br />
respondents to be disincentives to investment, as they hamper the production process. New labour<br />
regulations that have been in the spotlight have caused concern among company management teams<br />
because they curb the companies’ authority to determine wages and salaries by giving employees<br />
disproportionate bargaining power in wage and salary negotiation process.<br />
Though investment incentives do not constitute the main determinant <strong>of</strong> foreign direct investment in<br />
Indonesia, investors consider the investment regime in their decision to invest. The interview findings<br />
showed that investment incentives constitute a crucial issue for half <strong>of</strong> respondents, with one respondent<br />
perceiving them as important (Table 6). The respondents stated that although incentive is not the main<br />
reason for FDI, they would be happy to have incentives available. In the long term, FDIs regard<br />
incentives as beneficial because they would reduce tax costs or import duties they have to pay out.<br />
Table 6. The importance <strong>of</strong> investment incentive<br />
The importance <strong>of</strong> investment incentive Number <strong>of</strong> companies Respondent percentage ( per cent)<br />
Very important 3 50.0<br />
Important 1 16.7<br />
Not important 1 16.7<br />
Neutral 1 16.7<br />
Source: in depth interview<br />
In connection with the impact <strong>of</strong> incentives on business development, two thirds <strong>of</strong> respondents<br />
expressed the view that incentives do not significantly influence their businesses (Table 7). Those who<br />
perceived that incentives have a significant impact on business development cited reasons that ranged<br />
from increasing integration, business scale, output, labour utilization and mechanization. Meanwhile<br />
only one respondent was <strong>of</strong> the view that incentives had an impact on the location.<br />
Table 7. Incentive impact on corporate action<br />
Incentive impact Number <strong>of</strong> companies Respondent percentage (per cent)<br />
No impact 4 66.7<br />
Increased integration level 2 33.3<br />
Increased business scale 2 33.3<br />
Increased output 2 33.3<br />
Increased usage <strong>of</strong> labour 2 33.3<br />
Increased mechanization 2 33.3<br />
Location 1 16.7<br />
Source: in depth interview<br />
Companies identify incentives that affect import duties/levies applicable to capital goods as the most<br />
attractive <strong>of</strong> all incentives because most industries in Indonesia depend heavily on imported intermediate<br />
goods as inputs in their production processes (Table 8). Most machinery used in the production process<br />
is still imported. Many companies complain about the difficulties they face in carrying out expansion and<br />
renewal <strong>of</strong> machinery, largely due to the high cost <strong>of</strong> importing machinery. To that end, incentives in the<br />
form <strong>of</strong> lowering/exempting tariffs on capital goods and intermediate products are vital for attracting<br />
foreign investors. It is worth noting that some <strong>of</strong> the inputs used in the production process in the chemical<br />
industry are imported, which makes reductions or exemptions <strong>of</strong> tariffs/duties a very attractive<br />
proposition for investors. Other incentives perceived as important are value added tax incentives.<br />
<strong>Sustainable</strong> <strong>Development</strong> <strong>Impacts</strong> <strong>of</strong> <strong>Investment</strong> <strong>Incentives</strong>: A <strong>Case</strong> Study <strong>of</strong> the Chemical Industry in Indonesia<br />
15
trade knowledge network<br />
Table 8. Most attractive investment incentives<br />
Incentive Type Number <strong>of</strong> Companies Respondent Percentage (per cent)<br />
Tariff incentives for capital goods 5 83.33<br />
Tariff incentives for imported immediate goods 3 50.00<br />
Value added tax incentives 3 50.00<br />
Low interest loan 1 16.70<br />
Special concessions from government 1 16.70<br />
Imported input tariffs 1 16.70<br />
Land buying subsidies 1 16.70<br />
Source: in depth interview<br />
Respondents would like to see the duration <strong>of</strong> incentives extended beyond the current duration <strong>of</strong> five<br />
years (Table 9). This is understandable given the advantages in terms <strong>of</strong> financial, production,<br />
marketing, and general management benefits that businessmen enjoy as long as incentives apply.<br />
Table 9. Ideal period for investment incentives<br />
Incentive period Number <strong>of</strong> Companies Respondent Percentage (per cent)<br />
1-5 years 1 16.7<br />
>5 years 3 50.0<br />
No answer 2 33.3<br />
Source: in depth interview<br />
5 The Impact <strong>of</strong> FDI in the Chemical Industry on<br />
<strong>Sustainable</strong> <strong>Development</strong><br />
Although FDI inflows into the chemical and pharmaceutical industry have experienced brisk<br />
performance over the years, indications point to a continuing lack <strong>of</strong> sufficient supporting conditions in<br />
the industry. The structure <strong>of</strong> the chemical industry in Indonesia is lopsidedly downstream, depending<br />
heavily, as it does, on imports <strong>of</strong> raw materials from abroad.<br />
Accelerating the growth <strong>of</strong> the chemical industry in Indonesia faces obstacles in the form <strong>of</strong> limited<br />
technology and supporting infrastructure. In fact, the technology that is used in the industry is largely<br />
imported. Limited application <strong>of</strong> technology in the industry is also attributed to limited research in the<br />
industry, which has hampered its growth. Another problem that faces the industry is the rising cost <strong>of</strong><br />
raw materials, compounded by poor infrastructure in rural areas, the main producers <strong>of</strong> raw materials.<br />
Feeder roads linking villages to towns and cities, where chemical industries are located, are still in poor<br />
state relatively.<br />
5.1 Economic impacts<br />
5.1.1 Employment generation<br />
Foreign direct investment generated employment for 73,839 people in 2002, a figure that rose to<br />
105,141 people in 2007 (Table 10). In comparison with other industries such as textiles, and metal,<br />
machinery and electronics, the chemical industry does not provide as many employment<br />
opportunities.<br />
16<br />
<strong>Sustainable</strong> <strong>Development</strong> <strong>Impacts</strong> <strong>of</strong> <strong>Investment</strong> <strong>Incentives</strong>: A <strong>Case</strong> Study <strong>of</strong> the Chemical Industry in Indonesia
trade knowledge network<br />
Table 10. Manpower absorption <strong>of</strong> foreign direct investment realization by sector, 2002 – September 30, 2007<br />
Sector 2002 2003 2004 2005 2006 2007<br />
Textile Industry 12,426 17,452 24,640 15,332 67,335 32,078<br />
Metal, Machinery & Electronic Industry 14,847 10,887 9,766 18,122 21,257 15,308<br />
Food Industry 11,653 7,730 17,759 13,092 12,729 14,921<br />
Motor Vehicles & Other Transport Equip. Industry 1,989 5,642 5,597 7,384 12,751 12,123<br />
Leather Goods & Footwear Industry 15,653 4,337 3,303 5,652 7,886 10,388<br />
Wood Industry 2,692 7,568 1,248 6,197 6,854 7,828<br />
Other Industry 4,882 5,903 6,590 7,041 5,115 3,865<br />
Rubber and Plastic Industry 2,670 4,325 3,110 10,323 6,744 3,656<br />
Chemical and Pharmaceutical Industry 4,981 3,848 8,019 11,312 4,488 3,082<br />
Non-Metallic Mineral Industry 1,561 969 4,315 2,147 1,461 923<br />
Paper and Printing Industry 420 269 4,776 668 6,153 875<br />
Medical & Optical Instrument, Watches & Clock Industry 65 266 2,605 56 42 94<br />
Total manpower absorption 73,839 69,196 91,728 97,326 152,815 105,141<br />
Source: National <strong>Investment</strong> Coordination Board<br />
Employment generated by FDI in the chemical industry fluctuated during the 2002-2007 period. In<br />
2002, the chemical industry absorbed 4,981 people or seven per cent <strong>of</strong> the total labour force employed<br />
in FDI industries, which increased to 11 per cent in 2005. However, in 2007, employment in the<br />
industry declined to 3,082 people or seven per cent <strong>of</strong> the labour force in FDI industries. The only time<br />
when job absorption in the chemical industry experienced a rapid increase was in 2004, registering 108<br />
per cent growth, and in 2006 and 2007, employment in the industry dropped by 60 per cent and 31<br />
per cent, respectively. This indicates that the chemical industry is moving to a more capital intensive<br />
industry or lowering the capacity, which is why its capacity to generate employment decreased.<br />
Figure 2. Manpower absorption <strong>of</strong> foreign direct investment realization in the chemical and pharmaceutical industry, 2002 –<br />
September 30, 2007<br />
Source: National <strong>Investment</strong> Coordination Board<br />
According to results <strong>of</strong> the in-depth interview carried out in Banten province, five <strong>of</strong> the six interviewed<br />
companies employ less than 50 per cent <strong>of</strong> local population, with the rest coming from areas neighbouring the<br />
<strong>Sustainable</strong> <strong>Development</strong> <strong>Impacts</strong> <strong>of</strong> <strong>Investment</strong> <strong>Incentives</strong>: A <strong>Case</strong> Study <strong>of</strong> the Chemical Industry in Indonesia<br />
17
trade knowledge network<br />
Banten area (Table 11). Few companies employ foreign employees for specific management positions. One<br />
fully-fledged FDI company employs local citizens right from bottom to top managerial level positions, with<br />
only one expatriate serving as vice president. The Indonesian government requires FDI companies to employ<br />
local people, a regulation that is <strong>of</strong>ten difficult to fulfill due to the lower skill and competence levels <strong>of</strong> local<br />
workers compared with foreign manpower. However, companies <strong>of</strong>ten carry out job training before the job<br />
placement and employ local citizens as outsourced employees in positions that lie outside production processes.<br />
Table 11. Labour source<br />
Labour sources Number Number <strong>of</strong> companies Respondent percentage (per cent)<br />
Local (Banten area) More than 50 per cent 1 16.7<br />
Less than 50 per cent 5 83.33<br />
Domestic More than 50 per cent 5 83.33<br />
Less than 50 per cent 1 16.7<br />
International More than 10 per cent 0 -<br />
Source: in depth interview<br />
Less than 10 per cent 6 100.0<br />
Regarding wages, work opportunity, work leave, career opportunities and gender equality, research<br />
findings indicate that chemical companies in general are performing well. The wages <strong>of</strong> FDI companies<br />
are also higher than regional minimum wages. In light <strong>of</strong> that, chemical industries in Banten have a<br />
vitally important influence on improving socioeconomic conditions <strong>of</strong> the community. People living in<br />
surrounding areas regard chemical companies as beneficial to their community as they provide muchneeded<br />
employment opportunities. As a result, people who were farmers prior to the establishment <strong>of</strong><br />
the chemical factories have had the opportunity to become employees in manufacturing and service<br />
industries. Moreover, the local people have had to seek higher education to qualify for educational<br />
requirements demanded by the factories. Community income has risen, as remuneration in the chemical<br />
industry is higher than in agriculture. Thus, there is no doubt the chemical industry has made a positive<br />
contribution to the well-being <strong>of</strong> the society in the study area.<br />
5.1.2 Trade aspect<br />
Based on in-depth interviews, most inputs are imported goods (five <strong>of</strong> six respondents say that they use<br />
more than 50 per cent imported input), while only very few are from local surrounding production<br />
(Table 12). The imported input dependency in chemical industries makes imported tariff incentives an<br />
important aspect in the development <strong>of</strong> the chemical industry.<br />
Table 12. Input source<br />
Input location Proportion Number <strong>of</strong> Companies Respondent percentage (per cent)<br />
Local None 2 33.33<br />
Less than 50 per cent 3 10.00<br />
More than 50 per cent 1 16.67<br />
Domestic None 1 16.67<br />
Less than 50 per cent 5 83.33<br />
More than 50 per cent - -<br />
Import None - -<br />
Source: in depth interview<br />
Less than 50 per cent 1 16.67<br />
More than 50 per cent 5 83.33<br />
18<br />
<strong>Sustainable</strong> <strong>Development</strong> <strong>Impacts</strong> <strong>of</strong> <strong>Investment</strong> <strong>Incentives</strong>: A <strong>Case</strong> Study <strong>of</strong> the Chemical Industry in Indonesia
trade knowledge network<br />
The imported inputs are used due to their competitive price according to five <strong>of</strong> the six respondents; half<br />
<strong>of</strong> the respondents said that they used imported inputs because <strong>of</strong> a contract with an investor’s company,<br />
and others mentioned the higher quality <strong>of</strong> imported inputs as the reason they use imports (Table 13).<br />
Table 13. Reasons for using imported input<br />
Reason <strong>of</strong> using imported input Number <strong>of</strong> companies Respondent percentage (per cent)<br />
Input quality 2 33.33<br />
Price 5 83.33<br />
Contract 3 50.00<br />
Source: in depth interview<br />
The largest percentage <strong>of</strong> output (more than 50 per cent) is sold in the domestic market, and a small<br />
percentage is sold in the local market (Table 14). Research findings indicate that half <strong>of</strong> the respondents<br />
exported their output, while a third did not.<br />
Table 14. Market destination<br />
Market Destination Proportion Number <strong>of</strong> companies Respondent percentage (per cent)<br />
Local (Banten Local area) None 5 83.33<br />
Less than 50 per cent 1 16.67<br />
More than 50 per cent 0 -<br />
Domestic None 0 -<br />
Less than 50 per cent 0 -<br />
More than 50 per cent 6 100.00<br />
Export None 2 33.33<br />
Source: in depth interview<br />
Less than 50 per cent 4 66.67<br />
More than 50 per cent - -<br />
Figure 3. Exports-imports <strong>of</strong> organic chemicals 2003–2007<br />
Source: National <strong>Investment</strong> Coordination Board<br />
<strong>Sustainable</strong> <strong>Development</strong> <strong>Impacts</strong> <strong>of</strong> <strong>Investment</strong> <strong>Incentives</strong>: A <strong>Case</strong> Study <strong>of</strong> the Chemical Industry in Indonesia<br />
19
trade knowledge network<br />
In general, FDI in the chemical industry has not generated a positive balance <strong>of</strong> trade in chemical<br />
products for Indonesia. Imports <strong>of</strong> organic chemicals continued to outstrip exports each year from 2003<br />
through 2007. In 2003, organic imports were valued at $2,078.9 million, while exports <strong>of</strong> the same were<br />
reached $1,283.8 million. In 2007, imports <strong>of</strong> organic chemical products were valued at $3,734.8<br />
million, while exports reached $2,701.7 million. The largest percentage <strong>of</strong> imports in the chemical<br />
industry is composed <strong>of</strong> intermediate products.<br />
5.2 Social impacts<br />
This section discusses the social impact <strong>of</strong> FDI in the chemical industry (located in Banten province).<br />
The social impact presented here covers employment generation, social welfare, and various aspects <strong>of</strong><br />
human resource improvement, development and social environment recorded in the province in the<br />
aftermath <strong>of</strong> the establishment <strong>of</strong> FDI activities.<br />
Table 15. Pr<strong>of</strong>ile <strong>of</strong> community respondents<br />
Pr<strong>of</strong>ile Number Percentage<br />
Gender Male 23 54.76<br />
Female 19 45.24<br />
Occupation Civil servant/Military personnel/police 2 4.76<br />
Private sector employees 7 16.67<br />
Businesspeople 21 50.00<br />
Homemakers 5 11.90<br />
Community personnel 2 4.76<br />
Others 5 11.90<br />
Origin Indigent 34 80.95<br />
In-migrants 8 19.05<br />
Relationship with Factory employees 9 21.43<br />
chemical industry Dependants <strong>of</strong> factory employees 2 4.76<br />
Source: Primary data<br />
Service providers 0 0.00<br />
No relation 31 73.81<br />
To determine the social impact <strong>of</strong> FDI in the chemical industry on the community, the research team<br />
used results obtained from a sample <strong>of</strong> 42 respondents drawn from a cross section <strong>of</strong> people living in<br />
close proximity to the chemical factory premises, both factory employees and otherwise. Table 15 gives<br />
a detailed account <strong>of</strong> the pr<strong>of</strong>iles <strong>of</strong> the 42 respondents.<br />
Some respondents work as parking assistants, while others undertake itinerant economic activities close<br />
to factory premises such as selling food stuffs, repairing flat tires or selling mobile phone vouchers.<br />
Others are public transportation drivers, civil servants, military personnel, community leaders and<br />
harbour employees. Interviews showed that the existence <strong>of</strong> chemical factories in the area has generated<br />
both benefits and costs to the local community. However, all in all, benefits do outweigh costs.<br />
In general, the biggest benefit to the local community is employment opportunities in factories, albeit<br />
in unskilled and non-managerial roles. The social impact <strong>of</strong> the establishment <strong>of</strong> the factories as<br />
perceived by the local community is shown in Table 16.<br />
20<br />
<strong>Sustainable</strong> <strong>Development</strong> <strong>Impacts</strong> <strong>of</strong> <strong>Investment</strong> <strong>Incentives</strong>: A <strong>Case</strong> Study <strong>of</strong> the Chemical Industry in Indonesia
trade knowledge network<br />
Table 16. Social impact<br />
Explanation Number Percentage<br />
Perception about the industry Pleased 21 50.00<br />
Unchanged 7 16.67<br />
Not pleased 14 33.33<br />
Benefits derived from the industry Derive benefits 19 45.24<br />
No change 13 30.95<br />
Adverse effects 10 23.81<br />
The existence <strong>of</strong> the industry has made life better Better 16 38.10<br />
Unchanged 26 61.90<br />
Worse 0 0.00<br />
Impact <strong>of</strong> the industry on the life <strong>of</strong> the local community in general Better 24 57.14<br />
Unchanged 18 42.86<br />
Worse 0 0.00<br />
Level <strong>of</strong> eviction <strong>of</strong> in-migrants High 7 16.67<br />
Normal 22 52.38<br />
Rejection 13 30.95<br />
Acceptance <strong>of</strong> in-migrants by indigenous population High 22 52.38<br />
Normal 20 47.62<br />
Rejection 0 0.00<br />
Local community perception <strong>of</strong> gender discrimination by the industry Rife 0 0.00<br />
Non existent 4 .52<br />
No idea 38 90.48<br />
Social assistance provided by the industry to the local community There is 11 26.19<br />
Source: Primary data<br />
There isn’t 12 28.57<br />
No idea 19 45.24<br />
The above table shows that most respondents expressed satisfaction with the establishment <strong>of</strong> the factory<br />
in their area because it induced many people to live within the vicinity <strong>of</strong> the factory, serving as a<br />
convergent point for in-migrants who serve as employees. The in-migrants, in general, have higher skills<br />
than the local population. The increasing number <strong>of</strong> factory employees, who are mainly non-locals, has<br />
become a source <strong>of</strong> economic welfare for the local population through the provision <strong>of</strong> parking services,<br />
washing and houses for rent. Most members <strong>of</strong> the local community also take this as an opportunity to<br />
establish eateries, which indirectly contributes to the betterment <strong>of</strong> community income, and forces them<br />
to shift their livelihoods from agriculture-based activities to industry and services.<br />
The establishment <strong>of</strong> chemical factories has fostered infrastructure modernization and physical<br />
improvement <strong>of</strong> roads (surfacing them) and electricity. This, in turn, has paved the way to regional<br />
development, as transport improvement has led to better distribution, modernization and society<br />
socialization.<br />
Nonetheless, some respondents contended that most benefits went to those who have large tracts <strong>of</strong> land<br />
and capital as they are able to construct houses for hire, which is not possible for those without such an<br />
advantage. Those with sufficient capital can also start eateries and other small businesses. These two<br />
economic activities constitute the main spillover effects <strong>of</strong> chemical factories in the community.<br />
<strong>Sustainable</strong> <strong>Development</strong> <strong>Impacts</strong> <strong>of</strong> <strong>Investment</strong> <strong>Incentives</strong>: A <strong>Case</strong> Study <strong>of</strong> the Chemical Industry in Indonesia<br />
21
trade knowledge network<br />
Local community members were <strong>of</strong> the view that the benefits they derive from the existence <strong>of</strong> the<br />
factories in their midst are constrained by their lack <strong>of</strong> education, which is vital for working in the<br />
chemical factories. This explains why there are few members <strong>of</strong> the local communities who are employed<br />
by chemical factories. For those who have the opportunity to work in the chemical factories, they serve<br />
in minor roles suitable for employees with secondary technical education.<br />
A small section <strong>of</strong> the local community perceived the existence <strong>of</strong> the chemical factories with strong<br />
scepticism, citing the lack <strong>of</strong> benefits. These people are primarily those who are not employed by the factories<br />
due to their lack <strong>of</strong> education. Nonetheless, most respondents perceived no significant negative side effects<br />
caused by the existence <strong>of</strong> the factories in their midst. However, as will be elaborated in the following section,<br />
pollution—though still within tolerable limits—is cause for concern <strong>of</strong> many respondents.<br />
5.3 <strong>Impacts</strong> on the environment<br />
Besides the state and condition <strong>of</strong> investment and prospects <strong>of</strong> the chemical industry in Indonesia, one<br />
issue that needs special attention is environmental safety. Industrial pollution is <strong>of</strong>ten generated by<br />
various energy uses in operating facilities, which is compounded by a lack <strong>of</strong> emission control equipment<br />
such as an electrostatic precipitator, a fuel gas desulfurization, a scrubber and others. Pollution can be<br />
caused by the industrial process and raw materials used in the production facilities.<br />
The chemical industry is the number one polluter in Indonesia. 7 The production process in chemical<br />
industries such as alcohol requires a lot <strong>of</strong> water and releases a large volume <strong>of</strong> effluents to surrounding<br />
areas. Liquid effluents cause contamination because they contain micro-organisms, in the form <strong>of</strong><br />
solutions and suspensions, among others, that arise from direct fermentation. The industry generates<br />
other liquid pollutants during the production process: contaminated water from washing equipment<br />
and tools, solid effluents from metals parts, residues <strong>of</strong> CaSO4, gas effluents in the form <strong>of</strong> alcohol<br />
vapours. These forms <strong>of</strong> industrial pollutants are very dangerous and poisonous causing environmental<br />
damage to air and water.<br />
The policies adopted to control industrial pollution revolve around emphasizing the use <strong>of</strong> clean sources<br />
<strong>of</strong> energy, reviewing regulations such as the emission standards and reinforcing self-supervision. Based<br />
on the outcome <strong>of</strong> findings by the State Ministry for Environmental Protection, most industries are yet<br />
to comply with the provisions. These are the forms <strong>of</strong> non-compliance within the provisions:<br />
■<br />
■<br />
■<br />
■<br />
■<br />
■<br />
■<br />
Ejecting emissions through chimneys;<br />
Not supervising emission standards;<br />
Not fulfilling emission standards;<br />
Not carrying out periodic self-supervision;<br />
The sampling hole and the supporting facilities are not in accordance with regulations;<br />
Non-installation <strong>of</strong> Continuous Emissions Monitoring equipment; and<br />
Monitoring equipment is dysfunctional.<br />
7 KLH (2003)<br />
22<br />
<strong>Sustainable</strong> <strong>Development</strong> <strong>Impacts</strong> <strong>of</strong> <strong>Investment</strong> <strong>Incentives</strong>: A <strong>Case</strong> Study <strong>of</strong> the Chemical Industry in Indonesia
trade knowledge network<br />
In order to protect the environment, the Indonesian Government issued Act No. 23/1997 on Managing<br />
the Environment and Attendant Implementing Legal Instruments. Environmental management is not<br />
only reported to the government but also to the public in the form <strong>of</strong> corporate social responsibility. The<br />
State Ministry for the Environment assesses environmental management to measure the degree <strong>of</strong><br />
compliance with legal instruments, under the acronym PROPER. PROPER findings are announced<br />
annually to the public, creating an incentive or disincentive for the company, depending on its ranking.<br />
The performance <strong>of</strong> the company is assessed and categorized into five colour rankings as follows:<br />
■<br />
■<br />
■<br />
■<br />
■<br />
■<br />
Gold ranking: for a company that has succeeded in conducting good environmental<br />
management in a satisfactory manner.<br />
Green ranking: for a company that succeeds in conducting environmental management beyond<br />
legal standards.<br />
Blue ranking: for a company that succeeds in conducting environmental management in line<br />
with the basic minimum legal requirements.<br />
Blue minus ranking: for a company that attempts to carry out environmental management,<br />
though some <strong>of</strong> the attempts have not met legal requirements.<br />
Red ranking: for a company that carries out environmental management below minimum legal<br />
standards.<br />
Black ranking: for a company that has so far failed to carry out meaningful environmental<br />
management.<br />
The outcomes <strong>of</strong> compliance rankings indicate that FDI companies perform better than domestic<br />
investment companies. The following is a detailed account <strong>of</strong> the categories and compliance in the<br />
chemical industry in Cilegon City, Banten province, Indonesia.<br />
Table 17. Environmental compliance in the chemical industry in Cilegon, Banten Province (2007)<br />
Category FDI Chemical industry Domestic Chemical Industry<br />
Gold - -<br />
Green 5 -<br />
Blue 8 1<br />
Blue – (new classification since 2007) 9 -<br />
Red 1 5<br />
Black - -<br />
Source: State Ministry for the Environment, 2007<br />
Data in Table 12 show that foreign companies in the chemical industry in 2007 generally perform well.<br />
Five chemical companies fall into the Green category, eight into the Blue category, and nine into the<br />
Blue-minus category. Two chemical companies fell into the Red category, and none fell into the Black<br />
category. In general, FDI chemical companies outperformed domestic chemical companies in<br />
environmental safety compliance in the area survey.<br />
Moreover, the ranking achieved by respondent companies shows an upward trend. Out <strong>of</strong> six companies<br />
that were observed in 2007, five fell under the Green category, with only one still in the Blue category.<br />
<strong>Sustainable</strong> <strong>Development</strong> <strong>Impacts</strong> <strong>of</strong> <strong>Investment</strong> <strong>Incentives</strong>: A <strong>Case</strong> Study <strong>of</strong> the Chemical Industry in Indonesia<br />
23
trade knowledge network<br />
It is also worth noting that one company was able to improve its category ranking from Blue in 2005<br />
to Green in 2007.<br />
The outcome <strong>of</strong> environmental protection compliance evaluation shows that foreign companies in<br />
Indonesia tend to apply higher standards than required by Indonesian law. This was confirmed during the<br />
interviews when the foreign companies stated that they use environmental standards originating from their<br />
holding companies, which are tighter than Indonesia’s. In light <strong>of</strong> such a finding, the fear expressed by some<br />
that Indonesia is turning into a “pollution haven” due to the relocation <strong>of</strong> “dirty” may not be entirely true.<br />
Since the negative impact caused by pollutants emitted by the chemical industry is not strictly the<br />
responsibility <strong>of</strong> the Indonesian government, but rather predominantly that <strong>of</strong> the business community,<br />
companies in the chemical industry in Indonesia have formed National Responsible Care ® (KN-RCI)<br />
to serve as a tool companies can use to apply Responsible Care ® principles. Members <strong>of</strong> Responsible<br />
Care ® are obliged to follow a six-principle code <strong>of</strong> ethics:<br />
■<br />
■<br />
■<br />
■<br />
■<br />
■<br />
Care for the community and response to emergencies through communications and dialogue<br />
with the local community (CAER-Community Awareness & Emergency Response Code)<br />
Pollution Prevention Code<br />
Process Safety Code for production processes/industrial facilities<br />
Safety Distribution Code<br />
Employee Safety and Health Code<br />
Product Stewardship Code (handling product design to disintegration in nature)<br />
The synergy between the government and chemical companies in Indonesia attests to the fact that the<br />
Indonesian government and the chemical industry are concerned about minimizing the impact that<br />
chemical products cause on the environment and society.<br />
From the companies’ standpoint, research findings indicate that respondents are concerned about the<br />
environment (Table 18). Some companies have slogans stuck in various places on factory grounds<br />
serving as awareness raisers to the public about environment and work safety. Companies have allocated<br />
special funds to handle public complaints and deal with waste management. All the companies surveyed<br />
had sound waste management systems in place, which was why no public complaints arose. However,<br />
chemical companies and members <strong>of</strong> the community did not agree on the impact <strong>of</strong> operations <strong>of</strong><br />
chemical industries on environmental quality. While chemical companies considered their operations<br />
safe for the environment, members <strong>of</strong> the general public were concerned about the contamination <strong>of</strong><br />
water and air caused by company operations.<br />
Based on the community members’ perceptions, the factory and its operations have adversely affected<br />
water and air quality, but there are as yet no indications that it has directly been the cause <strong>of</strong> sickness<br />
affecting members <strong>of</strong> the local community. Air pollution, caused by smoke, fumes and odours spewed<br />
by factory chimneys <strong>of</strong>ten cause severe irritation and discomfort. Some people who have high sensitivity<br />
to pungent odours suffer from headaches. The air temperature surrounding the chemical plants tends<br />
to be relatively higher, which is attributed to the fact that many trees have been cut down to clear the<br />
way for the establishment <strong>of</strong> the chemical plants.<br />
24<br />
<strong>Sustainable</strong> <strong>Development</strong> <strong>Impacts</strong> <strong>of</strong> <strong>Investment</strong> <strong>Incentives</strong>: A <strong>Case</strong> Study <strong>of</strong> the Chemical Industry in Indonesia
trade knowledge network<br />
Table 18. Environmental treatment<br />
Kind <strong>of</strong> treatment Availability Number <strong>of</strong> companies Response percentage (per cent)<br />
Cost allocation for waste management Available 6 100<br />
Not available 0 0<br />
Have effluents processing system Available 6 100<br />
Not available 0 0<br />
Local community complaint Available 0 0<br />
Not available 6 100<br />
Degradation <strong>of</strong> water quality Available 0 0<br />
Not available 6 100<br />
Degradation <strong>of</strong> air quality Available 0 0<br />
Source: in depth interview<br />
Not available 6 100<br />
Noise pollution, caused by rumbling and droning sounds generated by factory installations and running<br />
truck engines to and from the factory, has become a constant headache for members <strong>of</strong> the local<br />
community living in the vicinity <strong>of</strong> chemical plant.<br />
Several respondents stated that the surrounding areas around chemical factories are uninhabitable<br />
because <strong>of</strong> severe air pollution, though the pollution is invisible to naked eye. Detailed responses about<br />
the impact <strong>of</strong> chemical plants on the environment appear in Table 19.<br />
Table 19 shows that most respondents were unhappy with air pollution caused by chemical plants in the<br />
area. Incidentally, a chemical leak occurred in one <strong>of</strong> the facilities at the time the field work was underway<br />
(not one <strong>of</strong> the companies interviewed), which caused a lot <strong>of</strong> discomfort to the local community. As a result<br />
<strong>of</strong> the chemical leak, 37 people had to undergo medical treatment after inhaling poisonous substances.<br />
Table 19. Respondents’ perception on environmental impact<br />
Keterangan Jumlah Percentage<br />
Negative impact on water quality There is 2 4.76<br />
None 23 54.76<br />
No idea 17 40.48<br />
Negative impact on air quality There is 41 97.62<br />
None 1 2.38<br />
No idea 0 0.00<br />
Negative impact on environmental quality in general There is 40 95.24<br />
None 2 4.76<br />
No idea 0 0.00<br />
Community perception about effluents management by the industry There is 14 33.33<br />
None 1 2.38<br />
No idea 27 64.29<br />
Community perception about tolerance limit <strong>of</strong> pollution produced Tolerable 29 69.05<br />
Source: Primary Data<br />
No idea 0 0.00<br />
Not tolerable 13 30.95<br />
Ground water within the vicinity <strong>of</strong> the chemical plants was found to be safe for consumption and use<br />
by the local community. However, some respondents contended that, though safe for drinking, since the<br />
<strong>Sustainable</strong> <strong>Development</strong> <strong>Impacts</strong> <strong>of</strong> <strong>Investment</strong> <strong>Incentives</strong>: A <strong>Case</strong> Study <strong>of</strong> the Chemical Industry in Indonesia<br />
25
trade knowledge network<br />
establishment <strong>of</strong> the chemical plants underground water had become murky. That said, some<br />
respondents believed that it was in fact a local coral that had contaminated the water, and not pollution<br />
caused chemical plants in their areas.<br />
In general, however, members <strong>of</strong> the local community perceived such effects as within tolerable limits,<br />
which in any case they had become accustomed to, and not a major source <strong>of</strong> serious health problems.<br />
6 Policy Recommendations<br />
Domestic and foreign investment is vital for the development <strong>of</strong> Indonesia’s economy. Foreign direct<br />
investment as a source <strong>of</strong> foreign capital inflow is important in fostering economic growth. Efforts must<br />
be made to increase both domestic and foreign investment. The Government <strong>of</strong> Indonesia has many<br />
tasks to accomplish if it is to enhance its attractiveness to foreign investors. There is a need to improve<br />
legal certainty and investment security guarantees, as well as the provision <strong>of</strong> public services and good<br />
infrastructure. The GOI must create an environment that provides the best services to investors in order<br />
to attract FDI to Indonesia.<br />
Although investment incentives are not a key influence on the decision <strong>of</strong> foreign investors to invest in<br />
Indonesia, they are still an important element in attracting FDI to Indonesia. In particular, there is a need for<br />
incentives and policies tailored to promoting the development <strong>of</strong> inputs industries for the chemical industry,<br />
which should help in elevating industrialization and, in turn, will raise Indonesia’s value added. Furthermore,<br />
to increase the spillover effect generated by the chemical industry to the local community, human resources<br />
must improve. Poor human resources within the local community hampers the capacity <strong>of</strong> employees to<br />
derive many benefits they should from the operations <strong>of</strong> the chemical plants located in their areas.<br />
Foreign-invested chemical companies in general outperform their domestic counterparts in protecting the<br />
local environment in the areas surveyed. However, considering the fact that the PROPER category <strong>of</strong> many<br />
companies still falls below Green, GOI should increase pressure on the chemical industry to build up their<br />
waste processing facilities. Such a policy will enable the companies to achieve Green environmental quality<br />
standards, thereby reducing the negative impact on the surrounding community. There is also need for<br />
incentives tailored to encouraging better environmental quality in areas where chemical industries carry out<br />
their operations. Environment incentives could include publishing the names <strong>of</strong> firms that have achieved<br />
Green or Gold standard. In addition, the firms can show their status in their own promotional materials—<br />
both to promote their business and to act as a mentor to other businesses.<br />
7 References<br />
Law References<br />
Decree <strong>of</strong> the Minister <strong>of</strong> Finance No. Kep-289/MK/IV/4/1971 on Import Duties and Sales Tax<br />
(Import) <strong>of</strong> Capital Goods Imported by Foreign Enterprises.<br />
Government Regulation No. 17/1992 on Share Ownership in Foreign Enterprises.<br />
Government Regulation No. 20/1994 on Share Ownership in Companies Established for Foreign<br />
<strong>Investment</strong>.<br />
Government Regulation No.32/1994 on Visas, Entry Permits, and Immigration Permits.<br />
26<br />
<strong>Sustainable</strong> <strong>Development</strong> <strong>Impacts</strong> <strong>of</strong> <strong>Investment</strong> <strong>Incentives</strong>: A <strong>Case</strong> Study <strong>of</strong> the Chemical Industry in Indonesia
trade knowledge network<br />
Government Regulation No. 45/1996 on Income Tax on Obligatory Tax Income for Specified<br />
Business Industry.<br />
Government Regulation No. 147/2000 on Tax Treatment in Integrated Regional Economic<br />
<strong>Development</strong> Zone (KAPET).<br />
Government Regulation No. 148/2000 on Corporate Taxes Facilities for <strong>Investment</strong> in Specified<br />
Business Sectors and/or Specified Regions.<br />
Government Regulation No. 7/2007 and Government Regulation No. 31/2007 as substitution <strong>of</strong><br />
Government Regulation No. 12/2001 on Import and/or Delivery <strong>of</strong> Taxable Specified Goods<br />
Strategic in Nature Exempt from Value Added Tax.<br />
Government Regulation No. 1/2007 as substitution <strong>of</strong> Government Regulation No. 148/2000 on<br />
Corporate Tax Facilities for <strong>Investment</strong>s in Specified Business Sectors and/or Specified Regions.<br />
Law No.1/1967 on Foreign <strong>Investment</strong>.<br />
Law No.11/1970 on Amendments and Supplement to Law No.1/1967.<br />
Law No. 7/1983 on Income Taxes.<br />
Law No. 25/2007 on <strong>Investment</strong>.<br />
Presidential Decree No. 23/1974 on Limiting the Employment <strong>of</strong> New Foreign Workers.<br />
Presidential Decree No. 96/2000 on Business Sectors Closed to Foreign Investors.<br />
General references<br />
Engle, R. F. and Granger, C.W.J. (1987). Co-Integration and error correction: Representation,<br />
estimation, and testing. Econometrica, 55(2), 251–76.<br />
Engel, Robert, B. Yoo, B. “Forecasting and Testing in Co-Integrated System,” Journal <strong>of</strong> Econometrics,<br />
35 (1987): 143-159.<br />
Gast, M., (2005) Determinants <strong>of</strong> Foreign Direct <strong>Investment</strong> <strong>of</strong> OECD Countries 1991–2001. Giessen:<br />
Center for International <strong>Development</strong> and Environmental Research.<br />
Hill, H. (2000). The Indonesian Economy. 2nd ed. Cambridge: Cambridge University Press.<br />
———. (2001), Ekonomi Indonesia. Edisi kedua. Indonesia: Murai Kencana.<br />
Lipsey, R. E. (1999). The Location and Characteristics <strong>of</strong> U.S. Affiliates in Asia. NBER Working<br />
Paper No. 6876.<br />
Haufbauer, G. C. and Katz, D. (2007). Toward a US-Indonesia Free Trade Agreement. A brief<br />
prepared for the United States-Indonesia Society.<br />
<strong>Sustainable</strong> <strong>Development</strong> <strong>Impacts</strong> <strong>of</strong> <strong>Investment</strong> <strong>Incentives</strong>: A <strong>Case</strong> Study <strong>of</strong> the Chemical Industry in Indonesia<br />
27
trade knowledge network<br />
National <strong>Investment</strong> Coordination Board (2008). <strong>Investment</strong> Statistics. Retrieved January, 2008 from:<br />
http://www.bkpm.go.id/index.php/main/statistik<br />
KLH (2003). PROPER. Retrieved June, 2008 from: http://www.menlh.go.id/proper/<br />
28<br />
<strong>Sustainable</strong> <strong>Development</strong> <strong>Impacts</strong> <strong>of</strong> <strong>Investment</strong> <strong>Incentives</strong>: A <strong>Case</strong> Study <strong>of</strong> the Chemical Industry in Indonesia
trade knowledge network<br />
Annex 1: List <strong>of</strong> regulations on investment incentives<br />
No. Regulation Concerning Contents<br />
1. Act No. 1/1967 Foreign <strong>Investment</strong> <strong>Incentives</strong><br />
Exemption and tax reduction on corporate pr<strong>of</strong>its for a period not longer than five years<br />
Tax on dividends out <strong>of</strong> company pr<strong>of</strong>its paid to shareholders for pr<strong>of</strong>its accrued within a<br />
period not exceeding five years<br />
Lower corporate tax on pr<strong>of</strong>its that are re-invested in Indonesia<br />
Import duty at the time <strong>of</strong> importing fixed equipment such as machinery, tools, and work<br />
utensils required in facilitating company operations<br />
Excise tax on FDI<br />
FDI negative list<br />
Areas that are <strong>of</strong> strategic importance to the state/nation, and affect the well being <strong>of</strong> the<br />
public :<br />
• Harbours<br />
• Generation, transmission, and distribution <strong>of</strong> electricity for the public<br />
• Telecommunication<br />
• Water transportation<br />
• Air transportation<br />
• Drinking water services<br />
• Public railway transportation<br />
• Nuclear energy generation<br />
• Mass media<br />
• Areas that are <strong>of</strong> strategic importance to national defence:<br />
• Production <strong>of</strong> arms and ammunition<br />
• Dynamite<br />
• Explosives<br />
• War weaponry<br />
2. Act No. 11/1970 Amendment and addition (1) Tax <strong>Incentives</strong> given to FDI companies:<br />
made to Act No. 1/1967 • Excise tax on capital /investment<br />
on FDI • Excise tax and tax on sales<br />
• Excise on changing ownership<br />
• Corporate tax<br />
• Tax on dividends<br />
(2). For new legal entities undertaking investment in government priority areas/sectors or<br />
production in areas declared by government to be <strong>of</strong> priority, the Ministry <strong>of</strong> Finance is<br />
authorized to exempt the company from tax commitments for a period <strong>of</strong> two years <strong>of</strong><br />
the commencement <strong>of</strong> company operations (can be extended).<br />
(3). Besides tax incentives, the government can issue regulations for additional incentives to<br />
FDI companies that are deemed pivotal for the country’s economic development.<br />
3. Ministry <strong>of</strong> Exemption/reduction <strong>of</strong> Exempted or reduced import duty and sales tax on imports made by an FDI or domestic<br />
Finance Decree import duty and tax on investment company with an operational permit for:<br />
No. Kep-289/MK/ imports • Company machinery and equipment<br />
IV/4/1971 • Spare parts<br />
• Raw materials and supporting materials<br />
• Transportation equipment, tools and construction materials<br />
Exemption is applicable if:<br />
• The goods/materials are not produced in the country<br />
• The goods/materials have been included in capital expenditure plan<br />
• The cost <strong>of</strong> importing the goods is not drawn from country’s foreign currency.<br />
4. Presidential Restricting/limiting the Restricts the use <strong>of</strong> foreign manpower in FDI and domestic direct investment.<br />
Decree use <strong>of</strong> foreign manpower The company employing foreign manpower is obliged to conduct training and education<br />
No. 23/1974<br />
programs for Indonesian employees who are supposed to replace the expatriates.<br />
5. Act No. 7/1983 Income tax Retracts exemption <strong>of</strong> excise tax on company fixed goods such as machinery, worker<br />
equipment, and tools /aircraft to facilitate company operations.<br />
Restores imposition <strong>of</strong> excise tax on FDI.<br />
Retracts tax incentives and other levies that are applicable.<br />
6. Government Requirements for owning A company that is established within the framework <strong>of</strong> a FDI is, in principle, a joint venture<br />
Regulation shares in FDI companies in which the Indonesian partners must hold not less than 20 per cent <strong>of</strong> the total value <strong>of</strong><br />
No. 17/1992<br />
the company at the time <strong>of</strong> establishment, and can be raised to become 51 per cent in a<br />
period <strong>of</strong> 20 years from when the company commenced its production on a commercial<br />
basis (as noted in its operational permit/license).<br />
<strong>Sustainable</strong> <strong>Development</strong> <strong>Impacts</strong> <strong>of</strong> <strong>Investment</strong> <strong>Incentives</strong>: A <strong>Case</strong> Study <strong>of</strong> the Chemical Industry in Indonesia<br />
29
trade knowledge network<br />
No. Regulation Concerning Contents<br />
7. Government Requirements for share Foreign Direct <strong>Investment</strong> can take the forms <strong>of</strong>:<br />
Regulation ownership in FDI • Joint venture<br />
No. 20/1994 companies • Direct, meaning the entirety <strong>of</strong> its capital is controlled by foreign nationals or foreign<br />
legal entity.<br />
8. Government Visa, entry permit, and Visiting permits for foreign nationals for business purposes.Visiting permits can be<br />
Regulation immigration permits changed to become temporary stay permits, and temporary stay permits can be changed<br />
No. 32/1994<br />
to become permanent stay permits.<br />
9. Government Income tax on taxable Income tax on certain companies in certain industries can be guaranteed by the<br />
Regulation entities for certain government for a period <strong>of</strong> 10 years.The industries in question will be regulated in a<br />
No. 45/1996 industries presidential decree upon the recommendation <strong>of</strong> a team charged with the task <strong>of</strong> giving<br />
business facilities.<br />
10. Presidential Areas <strong>of</strong> business closed List <strong>of</strong> areas that are <strong>of</strong>f limits to foreign direct investment:<br />
Decree to investment • Forestry and plantations sector: seeds; plasma husbandry; the right <strong>of</strong> doing business<br />
No. 96/2000<br />
in natural forestry; contractors in timber logging.<br />
• Transportation:Taxi/bus operations and public water transportation.<br />
• Trade sector: trading and trade support services, with the exception <strong>of</strong>: large retailing<br />
(malls, supermarket, department stores; shopping centers)<br />
• Air broadcasting: radio and television broadcasting; multimedia services and press<br />
media; movie/film making.<br />
11. Presidential Implementation <strong>of</strong> tax Companies that carry out activities in integrated economic development zones (KAPET)<br />
Regulation imposition on integrated are entitled to:<br />
No. 147/2000 economic development • Reduction <strong>of</strong> income tax by 30 per cent net from total investment made.<br />
zones • Choice to apply accelerated depreciation or amortization.<br />
• Compensation for fiscal loss continuously for a period <strong>of</strong> 10 years.<br />
• Imposition <strong>of</strong> income tax amounting to 10 per cent on dividends paid to foreign<br />
taxable entities, or a lower tax rate in accordance with the agreement on double tax<br />
incidence tax that apply.<br />
12. Government Income tax on investment Reduction <strong>of</strong> net incomes by 30 per cent <strong>of</strong> total investment made.<br />
Regulation in certain areas in certain Accelerated depreciation or amortization.<br />
No. 148/2000 regions Extension <strong>of</strong> compensation periods, not to exceed 10 years.<br />
Imposing a 10 per cent income tax on dividends paid to foreign taxable entities or lower<br />
tax rate in line with agreement on double tax incidence avoidance that apply.<br />
Note: Certain areas and businesses are determined by presidential decree, but when that<br />
doesn’t materialize, the application there<strong>of</strong> is annulled<br />
13. Government Exemption <strong>of</strong> value added Goods that constitute machinery and factory equipment, both fixed or installed or not<br />
Regulation tax on imports/ mobile/loose, with the exception <strong>of</strong> spare parts;<br />
No. 7/2007 and relinquishing certain goods Livestock, poultry and fishery feedstuffs;<br />
Government that are classified as Agricultural produce/primary products;<br />
Regulation strategic. Seeds/seedlings in agriculture, estates/plantations, forestry, livestock, conservancies and<br />
No. 31/2007<br />
fisheries;<br />
replacing<br />
Clean water channelled through pipes by clean water company;<br />
Government<br />
Electricity, with the exception <strong>of</strong> for homes that use more than 600 watts<br />
Regulation<br />
No. 12/2001<br />
14. Act No. 25/2007 Foreign Direct <strong>Investment</strong> Applies equal treatment to domestic direct investment and foreign direct investment.<br />
Guarantees that no nationalization <strong>of</strong> confiscation <strong>of</strong> investment.<br />
Gives investors the right to transfer and remit foreign currency.<br />
15. Presidential Income tax on investment Reduces income tax by 30 per cent <strong>of</strong> the total value <strong>of</strong> investment made.<br />
Regulation in certain areas in certain Offers compensation for a longer period not exceeding 10 years.<br />
No. 1/2007 regions Ten per cent in income tax on dividends paid to foreign taxable entities, or lower tax rate<br />
replacing<br />
in accordance with prevailing agreement on double tax incidence avoidance.<br />
Government<br />
Accelerated depreciation and amortization.<br />
Regulation<br />
Note: Areas fall into 15 areas <strong>of</strong> business endeavours; one <strong>of</strong> which is the chemical<br />
No. 148/2000<br />
and pharmaceutical industry.<br />
30<br />
<strong>Sustainable</strong> <strong>Development</strong> <strong>Impacts</strong> <strong>of</strong> <strong>Investment</strong> <strong>Incentives</strong>: A <strong>Case</strong> Study <strong>of</strong> the Chemical Industry in Indonesia
trade knowledge network<br />
Annex 2: Methodology<br />
Lower case figures in the equation represent log value. Technically, FDI figures were not transformed<br />
into natural logarithms because the figures for some years were negative values. Smoothing the FDI<br />
variable was done by using FDI/1000.<br />
In light <strong>of</strong> that, the following long run regression function was used:<br />
Whereby:<br />
■<br />
■<br />
■<br />
■<br />
FDIt is real foreign direct investment (billion rupiah).<br />
gdpt is real gross domestic product (billion rupiah).<br />
ISBI-INFt is Bank Indonesia Rate minus Indonesia Inflation. This is the measure <strong>of</strong> real Bank<br />
Indonesia rate.<br />
LIBOR-INFFt is LIBOR interest rate minus U.S. inflation. This is the measure <strong>of</strong> the real<br />
foreign (world) interest rate.<br />
■ rert is the real exchange rate <strong>of</strong> rupiah for the $.<br />
■<br />
INCTVt is the dummy variable for investment incentive in Indonesia. The incentive dummy is<br />
used to proxy for foreign shareholding, which rose to 100 per cent <strong>of</strong> shares since 1994. In the<br />
same year, the government enacted a regulation that made it easier than before for foreign<br />
workers to stay in Indonesia. The dummy variable used was 1 for 1994 and above and 0 for the<br />
period prior to 1994.<br />
The following dynamic regression equation using the error correction model approach (ECM) was used:<br />
Regression analysis was used to determine key factors that influence FDI in Indonesia. The first step was<br />
to carry out unit root tests, which aim at establishing whether or data are stationary or otherwise. If data<br />
are found to be non-stationary, this should imply that the dynamic model is the appropriate mode to<br />
use in the analysis. Unit root tests <strong>of</strong> level data should produce unit roots for all the variables used in the<br />
model.<br />
<strong>Sustainable</strong> <strong>Development</strong> <strong>Impacts</strong> <strong>of</strong> <strong>Investment</strong> <strong>Incentives</strong>: A <strong>Case</strong> Study <strong>of</strong> the Chemical Industry in Indonesia<br />
31
trade knowledge network<br />
Table 20.Unit root test: Level<br />
Variable lags DF ADF Inference<br />
Gdp 3 -0.917559 -1.77050 unit root<br />
Fdi 2 -2.162966 -2.127760 unit root<br />
ISBI-INF (real BI interest rate) 5 -3.235689 -3.512072 unit root<br />
LIBOR-INFF (real foreign interest rate) 1 -1.700125 -1.306240 unit root<br />
Rer 2 -2.615880 -2.798644 unit root<br />
Source: analyzed data<br />
Meanwhile, results from unit root tests indicate that the first difference unit root test produces<br />
significant estimates, leading to the inference that data are stationary.<br />
Table 21. Unit root test: First difference<br />
Variable lags DF ADF Inference<br />
Gdp 3 -5.011448 -4.965730 stationary<br />
FDI 2 -5.392151 -5.396805 stationary<br />
ISBI-INF (real BI interest rate) 5 -4.755406 -4.715646 stationary<br />
LIBOR-INFF (real foreign interest rate) 1 -5.345417 -5.409380 stationary<br />
Rer 2 -5.148076 -5.129394 stationary<br />
Source: analyzed data<br />
If the level data has unit root, the dynamic regression equation, taking the form <strong>of</strong> error correction<br />
model (ECM) should be used. To ensure that the model produces valid and unbiased estimates, the next<br />
step involves a co-integration test. The co-integration test was done using Dickey Fuller test (DF),<br />
Augmented Dickey Fuller test (ADF) and CRDW.<br />
Table 22. Co-integration test<br />
DF ADF CRDW Inference<br />
-5.643762 -5.598580 1.326011 Stationary<br />
Source : analyzed data<br />
The above table presents results <strong>of</strong> the unit root tests on the co-integration function residuals and<br />
CRDW value. The critical value <strong>of</strong> CRDW is obtained from Engel and Yoo (1987), which, for a sample<br />
<strong>of</strong> 100, and a significance level <strong>of</strong> one per cent, the CRDW statistic is 0.51; at the five per cent<br />
significance level the CRDW statistic is 0.39 and at 10 per cent significant level, the CRDW statistic is<br />
0.32. CRDW test results also indicate that the equation has a significant CRDW value, which means<br />
that Ho’s assertion that there is no co-integration is rejected. Estimation <strong>of</strong> residuals generated by the<br />
equations using DF test and ADF at one pecent to 10 per cent significance level, all produce stationery<br />
outcomes, which clears the way for using the ECM. 8<br />
8 Engle and Granger (1977)<br />
32<br />
<strong>Sustainable</strong> <strong>Development</strong> <strong>Impacts</strong> <strong>of</strong> <strong>Investment</strong> <strong>Incentives</strong>: A <strong>Case</strong> Study <strong>of</strong> the Chemical Industry in Indonesia
trade knowledge network<br />
Table 23. Error correction model estimation<br />
Dependent Variable: D((FDI_RP/IHK)*100)/1000<br />
Method: Least Squares<br />
Date: 09/24/08 Time: 18:09<br />
Sample(adjusted): 1990:2 2006:4<br />
Included observations: 67 after adjusting endpoints<br />
Variable Coefficient Std. Error t-Statistic Prob.<br />
DLOG((GDP/IHK)*100) -20.90770 29.60872 -0.706133 0.4828<br />
D(ISBI-INF) 0.209336 0.464595 0.450576 0.6539<br />
D(LIBOR-INFF) 6.688684 2.890285 2.314195 0.0240<br />
DLOG(RER) 10.34278 17.11135 0.604440 0.5478<br />
INCTV 0.275621 2.418954 0.113942 0.9097<br />
ECT1_RERSBI(-1) -0.499739 0.116546 -4.287904 0.0001<br />
R-squared 0.340917 Mean dependent var 0.582723<br />
Adjusted R-squared 0.286894 S.D. dependent var 20.32557<br />
S.E. <strong>of</strong> regression 17.16406 Akaike info criterion 8.608798<br />
Sum squared resid 17970.90 Schwarz criterion 8.806233<br />
Log likelihood -282.3947 F-statistic 6.310563<br />
Durbin-Watson stat 2.004196 Prob (F-statistic) 0.000088<br />
Source : analyzed data<br />
Table 24. Co-integration equation extimation<br />
Dependent Variable: ((FDI_RP/IHK)*100)/1000<br />
Method: Least Squares<br />
Date: 09/24/08 Time: 18:06<br />
Sample: 1990:1 2006:4<br />
Included observations: 68<br />
Variable Coefficient Std. Error t-Statistic Prob.<br />
C -136.5213 159.3013 -0.857001 0.3947<br />
LOG((GDP/IHK)*100) 33.88370 15.39631 2.200768 0.0315<br />
ISBI-INF -0.591608 0.392238 -1.508289 0.1366<br />
LIBOR-INFF 1.528785 1.609615 0.949783 0.3459<br />
LOG(RER) -31.22415 10.03551 -3.111366 0.0028<br />
INCTV -14.97050 9.913553 -1.510104 0.1361<br />
R-squared 0.179938 Mean dependent var -0.417996<br />
Adjusted R-squared 0.113804 S.D. dependent var 21.55949<br />
S.E. <strong>of</strong> regression 20.29566 Akaike info criterion 8.942789<br />
Sum squared resid 5538.67 Schwarz criterion 9.138628<br />
Log likelihood -298.0548 F-statistic 2.720810<br />
Durbin-Watson stat 1.326011 Prob (F-statistic) 0.027548<br />
Source : analyzed data<br />
<strong>Sustainable</strong> <strong>Development</strong> <strong>Impacts</strong> <strong>of</strong> <strong>Investment</strong> <strong>Incentives</strong>: A <strong>Case</strong> Study <strong>of</strong> the Chemical Industry in Indonesia<br />
33