Sustainable Development Impacts of Investment Incentives: A Case ...
Sustainable Development Impacts of Investment Incentives: A Case ...
Sustainable Development Impacts of Investment Incentives: A Case ...

Create successful ePaper yourself
Turn your PDF publications into a flip-book with our unique Google optimized e-Paper software.
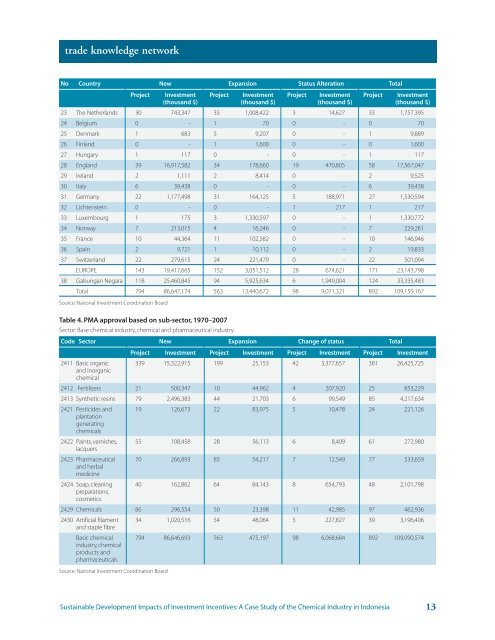
trade knowledge network<br />
No Country New Expansion Status Alteration Total<br />
Project <strong>Investment</strong> Project <strong>Investment</strong> Project <strong>Investment</strong> Project <strong>Investment</strong><br />
(thousand $) (thousand $) (thousand $) (thousand $)<br />
23 The Netherlands 30 743,347 35 1,008,422 3 14,627 33 1,757,395<br />
24 Belgium 0 - 1 70 0 - 0 70<br />
25 Denmark 1 683 5 9,207 0 - 1 9,889<br />
26 Finland 0 - 1 1,600 0 - 0 1,600<br />
27 Hungary 1 117 0 - 0 - 1 117<br />
28 England 39 16,917,582 34 178,660 19 470,805 58 17,567,047<br />
29 Ireland 2 1,111 2 8,414 0 - 2 9,525<br />
30 Italy 6 39,438 0 - 0 - 6 39,438<br />
31 Germany 22 1,177,498 31 164,125 5 188,971 27 1,530,594<br />
32 Lichtenstein 0 - 0 - 1 217 1 217<br />
33 Luxembourg 1 175 3 1,330,597 0 - 1 1,330,772<br />
34 Norway 7 213,015 4 16,246 0 - 7 229,261<br />
35 France 10 44,364 11 102,582 0 - 10 146,946<br />
36 Spain 2 9,721 1 10,112 0 - 2 19,833<br />
37 Switzerland 22 279,615 24 221,479 0 - 22 501,094<br />
EUROPE 143 19,417,665 152 3,051,512 28 674,621 171 23,143,798<br />
38 Gabungan Negara 118 25,460,845 94 5,925,634 6 1,949,004 124 33,335,483<br />
Total 794 86,647,174 563 13,440,672 98 9,071,321 892 109,159,167<br />
Source: National <strong>Investment</strong> Coordination Board<br />
Table 4. PMA approval based on sub-sector, 1970–2007<br />
Sector: Base chemical industry, chemical and pharmaceutical industry<br />
Code Sector New Expansion Change <strong>of</strong> status Total<br />
Project <strong>Investment</strong> Project <strong>Investment</strong> Project <strong>Investment</strong> Project <strong>Investment</strong><br />
2411 Basic organic 339 15,322,915 199 25,153 42 3,377,657 381 26,425,725<br />
and inorganic<br />
chemical<br />
2412 Fertilizers 21 500,347 10 44,962 4 207,920 25 853,229<br />
2413 Synthetic resins 79 2,496,383 44 21,703 6 99,549 85 4,217,634<br />
2421 Pesticides and 19 126,673 22 83,975 5 10,478 24 221,126<br />
plantation<br />
generating<br />
chemicals<br />
2422 Paints, varnishes, 55 108,458 28 56,113 6 8,409 61 272,980<br />
lacquers<br />
2423 Pharmaceutical 70 266,893 83 54,217 7 12,549 77 533,659<br />
and herbal<br />
medicine<br />
2424 Soap, cleaning 40 162,862 64 84,143 8 654,793 48 2,101,798<br />
preparations,<br />
cosmetics<br />
2429 Chemicals 86 296,554 50 23,398 11 42,985 97 462,936<br />
2430 Artificial filament 34 1,020,516 54 48,064 5 227,827 39 3,196,406<br />
and staple fibre<br />
Basic chemical 794 86,646,693 563 475,197 98 6,068,684 892 109,090,574<br />
industry, chemical<br />
products and<br />
pharmaceuticals<br />
Source: National <strong>Investment</strong> Coordination Board<br />
<strong>Sustainable</strong> <strong>Development</strong> <strong>Impacts</strong> <strong>of</strong> <strong>Investment</strong> <strong>Incentives</strong>: A <strong>Case</strong> Study <strong>of</strong> the Chemical Industry in Indonesia<br />
13