JIST - Society for Imaging Science and Technology
JIST - Society for Imaging Science and Technology
JIST - Society for Imaging Science and Technology

You also want an ePaper? Increase the reach of your titles
YUMPU automatically turns print PDFs into web optimized ePapers that Google loves.
Lai et al.: Relationship between paper properties <strong>and</strong> fuser oil uptake in a high-speed digital xerographic printing fuser<br />
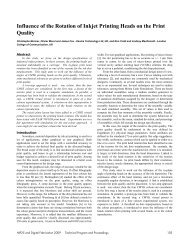
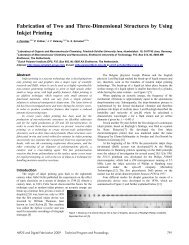
Figure 2. Oil uptake amounts <strong>for</strong> all paper samples. Sheet size is 8.5<br />
11 in.<br />
Oil Uptake Data<br />
Oil uptake data <strong>for</strong> all paper samples are shown in Figure 2.<br />
It is important to note that the experimental technique used<br />
to quantify oil uptake results in higher oil uptake values than<br />
observed when printing on a commercial press. There<strong>for</strong>e,<br />
the results should be interpreted in terms of relative oil uptake<br />
amounts among the paper samples.<br />
In general, coated papers appear to have higher oil uptake<br />
amounts than uncoated papers. However, some coated<br />
papers, such as sample 6, have small oil uptake values that<br />
are similar to that of uncoated papers. To gain insight into<br />
the relationships between paper properties <strong>and</strong> oil uptake,<br />
the oil uptake data are correlated with the properties of all<br />
the samples using PLS regression.<br />
Figure 3. Loading plot <strong>for</strong> the PLS model. Key paper properties x correlated<br />
with oil uptake y are identified. R 2 Y=0.72 <strong>and</strong> Q 2 =0.61 with<br />
=R 2 Y−Q 2 =0.11.<br />
Figure 4. Observed oil uptake data y measured vs predicted oil uptake<br />
ŷ PLS predicted values from the PLS model. R 2 Y=0.72 <strong>and</strong> Q 2 =0.61. Each<br />
data point represents a different paper sample.<br />
Key Paper Properties Identified by the PLS Regression<br />
Model<br />
PLS regression was per<strong>for</strong>med on the oil uptake y <strong>and</strong><br />
paper properties x data sets. All the paper properties listed<br />
inTableIwereusedasx-variable inputs into the initial PLS<br />
regression model. The data were mean centered <strong>and</strong> scaled<br />
to unit variance. One principal component, calculated<br />
through cross-validation, was found to sufficiently explain<br />
the variance in the data, resulting in R 2 Y <strong>and</strong> Q 2 values of<br />
0.72 <strong>and</strong> 0.61 respectively with =R 2 Y−Q 2 =0.11.<br />
The correlation structure between paper properties <strong>and</strong><br />
oil uptake are identified in the loading plot (Figure 3). Variables<br />
with a PLS weighting factor, w * c, of the same magnitude<br />
<strong>and</strong> sign as that of oil uptake have strong positive correlations,<br />
while variables with negative w * c values have<br />
negative correlations with oil uptake. rms roughness <strong>and</strong><br />
contact angle measurements, <strong>for</strong> example, are furthest from<br />
zero in the negative direction w * c−0.5, <strong>and</strong> thus have a<br />
strong negative correlation with oil uptake. Surface free energy<br />
has the highest PLS weight w * c0.5, <strong>and</strong> there<strong>for</strong>e<br />
has the strongest positive correlation with oil uptake. Basis<br />
weight, bending stiffness, <strong>and</strong> caliper have moderate positive<br />
correlations with oil uptake, with PLS weight values between<br />
0.2 <strong>and</strong> 0.4. With the lowest PLS weight w * c0.2, porosity<br />
based on Gurley seconds has the weakest positive correlation<br />
with oil uptake. There<strong>for</strong>e, the loading plot reveals that papers<br />
with high roughness <strong>and</strong> high surface energy correspond<br />
with large oil uptake amounts.<br />
For this PLS regression model, Figure 4 compares the<br />
observed y measured <strong>and</strong> the predicted values ŷ PLS predicted of<br />
oil uptake. The model’s ability to predict oil uptake well is<br />
shown in Fig. 4, where a good scatter of the data points<br />
around the 45° line is present.<br />
The equation <strong>for</strong> the final PLS regression model is<br />
ŷ PLS predicted = 0.22x SFE + 0.16x BWT + 0.13x STF + 0.11x CAL<br />
+ 0.08x POR − 0.22x RMS − 0.20x CA + 6.4, 1<br />
where SFEsurface free energy of paper, BWTbasis<br />
weight, STFbending stiffness, CALcaliper,<br />
PORporosity in Gurley seconds, RMSrms roughness,<br />
<strong>and</strong> CAambient contact angle measurements of oil on paper.<br />
The coefficients are based on mean centered <strong>and</strong> unit<br />
variance scaled data. To accurately predict absolute values<br />
<strong>for</strong> oil uptake, this model must be validated with an external<br />
data set, consisting of a large number of new <strong>and</strong> well characterized<br />
paper samples.<br />
426 J. <strong>Imaging</strong> Sci. Technol. 515/Sep.-Oct. 2007