JIST - Society for Imaging Science and Technology
JIST - Society for Imaging Science and Technology
JIST - Society for Imaging Science and Technology

Create successful ePaper yourself
Turn your PDF publications into a flip-book with our unique Google optimized e-Paper software.
Lee et al.: Digital color image halftone: Hybrid error diffusion using the mask perturbation <strong>and</strong> quality verification<br />
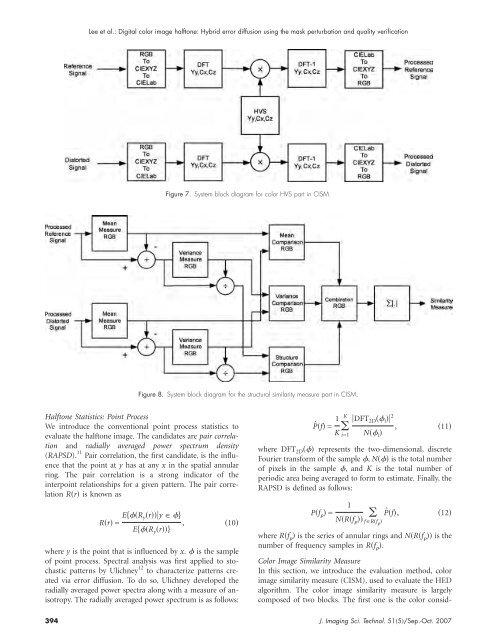
Figure 7. System block diagram <strong>for</strong> color HVS part in CISM.<br />
Figure 8. System block diagram <strong>for</strong> the structural similarity measure part in CISM.<br />
Halftone Statistics: Point Process<br />
We introduce the conventional point process statistics to<br />
evaluate the halftone image. The c<strong>and</strong>idates are pair correlation<br />
<strong>and</strong> radially averaged power spectrum density<br />
(RAPSD). 11 Pair correlation, the first c<strong>and</strong>idate, is the influence<br />
that the point at y has at any x in the spatial annular<br />
ring. The pair correlation is a strong indicator of the<br />
interpoint relationships <strong>for</strong> a given pattern. The pair correlation<br />
Rr is known as<br />
Rr = ER yry <br />
, 10<br />
ER y r<br />
where y is the point that is influenced by x. is the sample<br />
of point process. Spectral analysis was first applied to stochastic<br />
patterns by Ulichney 12 to characterize patterns created<br />
via error diffusion. To do so, Ulichney developed the<br />
radially averaged power spectra along with a measure of anisotropy.<br />
The radially averaged power spectrum is as follows:<br />
Pˆf = 1 K DFT 2D i 2<br />
, 11<br />
K i=1 N i <br />
where DFT 2D represents the two-dimensional, discrete<br />
Fourier trans<strong>for</strong>m of the sample , N is the total number<br />
of pixels in the sample , <strong>and</strong> K is the total number of<br />
periodic area being averaged to <strong>for</strong>m to estimate. Finally, the<br />
RAPSD is defined as follows:<br />
Pf =<br />
1<br />
Pˆf,<br />
NRf fRf <br />
12<br />
where Rf is the series of annular rings <strong>and</strong> NRf is the<br />
number of frequency samples in Rf .<br />
Color Image Similarity Measure<br />
In this section, we introduce the evaluation method, color<br />
image similarity measure (CISM), used to evaluate the HED<br />
algorithm. The color image similarity measure is largely<br />
composed of two blocks. The first one is the color consid-<br />
394 J. <strong>Imaging</strong> Sci. Technol. 515/Sep.-Oct. 2007