JIST - Society for Imaging Science and Technology
JIST - Society for Imaging Science and Technology
JIST - Society for Imaging Science and Technology

Create successful ePaper yourself
Turn your PDF publications into a flip-book with our unique Google optimized e-Paper software.
Maeda, Maekawa, <strong>and</strong> Takeuchi: Simulation of traveling wave toner transport considering air drag<br />
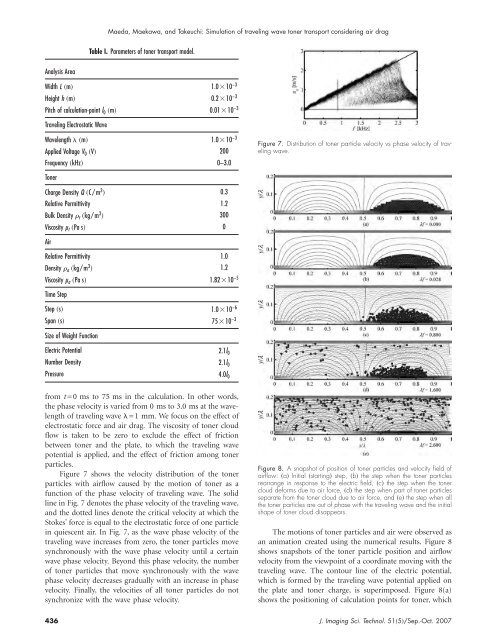
Table I. Parameters of toner transport model.<br />
Analysis Area<br />
Width L m<br />
Height h m<br />
Pitch of calculation-point l 0 m<br />
1.0 10 −3<br />
0.2 10 −3<br />
0.01 10 −3<br />
Traveling Electrostatic Wave<br />
Wavelength m<br />
1.0 10 −3<br />
Pressure 4.0l 0<br />
Applied Voltage V 0 V 200<br />
Figure 7. Distribution of toner particle velocity vs phase velocity of traveling<br />
wave.<br />
Frequency kHz 0–3.0<br />
Toner<br />
Charge Density Q C/m 3 0.3<br />
Relative Permittivity 1.2<br />
Bulk Density t kg/ m 3 300<br />
Viscosity µ t Pa s 0<br />
Air<br />
Relative Permittivity 1.0<br />
Density a kg/ m 3 1.2<br />
Viscosity µ a Pa s<br />
1.82 10 −5<br />
Time Step<br />
Step s<br />
1.0 10 −6<br />
Span s<br />
75 10 −3<br />
Size of Weight Function<br />
Electric Potential 2.1l 0<br />
Number Density 2.1l 0<br />
from t=0 ms to 75 ms in the calculation. In other words,<br />
the phase velocity is varied from 0msto 3.0 ms at the wavelength<br />
of traveling wave =1 mm. We focus on the effect of<br />
electrostatic <strong>for</strong>ce <strong>and</strong> air drag. The viscosity of toner cloud<br />
flow is taken to be zero to exclude the effect of friction<br />
between toner <strong>and</strong> the plate, to which the traveling wave<br />
potential is applied, <strong>and</strong> the effect of friction among toner<br />
particles.<br />
Figure 7 shows the velocity distribution of the toner<br />
particles with airflow caused by the motion of toner as a<br />
function of the phase velocity of traveling wave. The solid<br />
line in Fig. 7 denotes the phase velocity of the traveling wave,<br />
<strong>and</strong> the dotted lines denote the critical velocity at which the<br />
Stokes’ <strong>for</strong>ce is equal to the electrostatic <strong>for</strong>ce of one particle<br />
in quiescent air. In Fig. 7, as the wave phase velocity of the<br />
traveling wave increases from zero, the toner particles move<br />
synchronously with the wave phase velocity until a certain<br />
wave phase velocity. Beyond this phase velocity, the number<br />
of toner particles that move synchronously with the wave<br />
phase velocity decreases gradually with an increase in phase<br />
velocity. Finally, the velocities of all toner particles do not<br />
synchronize with the wave phase velocity.<br />
Figure 8. A snapshot of position of toner particles <strong>and</strong> velocity field of<br />
airflow: a Initial starting step, b the step when the toner particles<br />
rearrange in response to the electric field, c the step when the toner<br />
cloud de<strong>for</strong>ms due to air <strong>for</strong>ce, d the step when part of toner particles<br />
separate from the toner cloud due to air <strong>for</strong>ce, <strong>and</strong> e the step when all<br />
the toner particles are out of phase with the traveling wave <strong>and</strong> the initial<br />
shape of toner cloud disappears.<br />
The motions of toner particles <strong>and</strong> air were observed as<br />
an animation created using the numerical results. Figure 8<br />
shows snapshots of the toner particle position <strong>and</strong> airflow<br />
velocity from the viewpoint of a coordinate moving with the<br />
traveling wave. The contour line of the electric potential,<br />
which is <strong>for</strong>med by the traveling wave potential applied on<br />
the plate <strong>and</strong> toner charge, is superimposed. Figure 8(a)<br />
shows the positioning of calculation points <strong>for</strong> toner, which<br />
436 J. <strong>Imaging</strong> Sci. Technol. 515/Sep.-Oct. 2007