Out of Reach 2012 - National Low Income Housing Coalition
Out of Reach 2012 - National Low Income Housing Coalition
Out of Reach 2012 - National Low Income Housing Coalition
You also want an ePaper? Increase the reach of your titles
YUMPU automatically turns print PDFs into web optimized ePapers that Google loves.
Missouri<br />
FY12 HOUSING WAGE<br />
HOUSING COSTS<br />
AREA MEDIAN INCOME (AMI)<br />
RENTER HOUSEHOLDS<br />
Hourly wage<br />
necessary to<br />
afford 2 BR<br />
FMR<br />
Twobedroom<br />
1<br />
FMR<br />
<strong>Income</strong> needed<br />
to afford<br />
2 BR FMR<br />
Full-time jobs<br />
at minimum<br />
wage needed to<br />
afford 2 BR FMR<br />
Annual<br />
AMI<br />
Rent<br />
affordable<br />
at AMI<br />
30%<br />
<strong>of</strong> AMI<br />
2 3 4<br />
Rent<br />
affordable<br />
at 30%<br />
<strong>of</strong> AMI<br />
Number<br />
(2006-2010)<br />
% <strong>of</strong> total<br />
households<br />
(2006-2010)<br />
Estimated<br />
mean renter<br />
hourly wage<br />
(<strong>2012</strong>)<br />
Rent<br />
affordable<br />
at mean<br />
wage<br />
Full-time jobs<br />
at mean renter<br />
wage needed to<br />
afford 2 BR FMR<br />
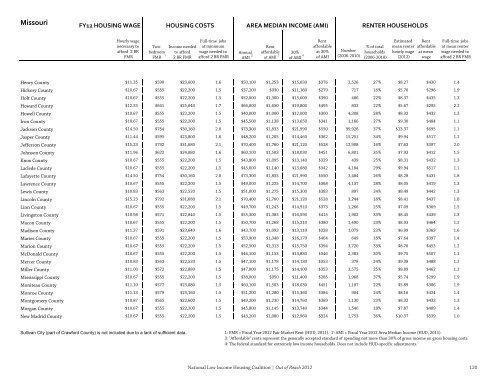
Henry County $11.35 $590 $23,600 1.6 $50,100 $1,253 $15,030 $376<br />
2,526 27% $8.27 $430 1.4<br />
Hickory County $10.67 $555 $22,200 1.5 $37,200 $930 $11,160 $279<br />
717 16% $5.70 $296 1.9<br />
Holt County $10.67 $555 $22,200 1.5 $52,000 $1,300 $15,600 $390<br />
486 22% $8.37 $435 1.3<br />
Howard County $12.33 $641 $25,640 1.7 $66,000 $1,650 $19,800 $495<br />
832 22% $5.67 $295 2.2<br />
Howell County $10.67 $555 $22,200 1.5 $40,000 $1,000 $12,000 $300<br />
4,308 28% $8.32 $432 1.3<br />
Iron County $10.67 $555 $22,200 1.5 $45,500 $1,138 $13,650 $341<br />
1,166 27% $9.30 $484 1.1<br />
Jackson County $14.50 $754 $30,160 2.0 $73,300 $1,833 $21,990 $550 99,926 37% $13.37 $695 1.1<br />
Jasper County $11.44 $595 $23,800 1.6 $48,200 $1,205 $14,460 $362 15,251 34% $9.94 $517 1.2<br />
Jefferson County $15.23 $792 $31,680 2.1 $70,400 $1,760 $21,120 $528 12,908 16% $7.63 $397 2.0<br />
Johnson County $11.96 $622 $24,880 1.6 $60,100 $1,503 $18,030 $451<br />
6,801 35% $7.93 $412 1.5<br />
Knox County $10.67 $555 $22,200 1.5 $43,800 $1,095 $13,140 $329<br />
439 25% $8.31 $432 1.3<br />
Laclede County $10.67 $555 $22,200 1.5 $45,600 $1,140 $13,680 $342<br />
4,184 29% $9.94 $517 1.1<br />
Lafayette County $14.50 $754 $30,160 2.0 $73,300 $1,833 $21,990 $550<br />
3,484 26% $8.28 $431 1.8<br />
Lawrence County $10.67 $555 $22,200 1.5 $49,000 $1,225 $14,700 $368<br />
4,137 28% $8.05 $419 1.3<br />
Lewis County $10.83 $563 $22,520 1.5 $51,000 $1,275 $15,300 $383<br />
897 24% $8.49 $442 1.3<br />
Lincoln County $15.23 $792 $31,680 2.1 $70,400 $1,760 $21,120 $528<br />
3,244 18% $8.41 $437 1.8<br />
Linn County $10.67 $555 $22,200 1.5 $49,700 $1,243 $14,910 $373<br />
1,266 25% $7.09 $369 1.5<br />
Livingston County $10.98 $571 $22,840 1.5 $55,300 $1,383 $16,590 $415<br />
1,902 33% $8.45 $439 1.3<br />
Macon County $10.67 $555 $22,200 1.5 $50,700 $1,268 $15,210 $380<br />
1,490 23% $8.93 $464 1.2<br />
Madison County $11.37 $591 $23,640 1.6 $43,700 $1,093 $13,110 $328<br />
1,079 23% $6.99 $363 1.6<br />
Maries County $10.67 $555 $22,200 1.5 $53,900 $1,348 $16,170 $404<br />
649 18% $7.64 $397 1.4<br />
Marion County $10.67 $555 $22,200 1.5 $52,500 $1,313 $15,750 $394<br />
3,720 33% $8.70 $453 1.2<br />
McDonald County $10.67 $555 $22,200 1.5 $46,100 $1,153 $13,830 $346<br />
2,383 30% $9.75 $507 1.1<br />
Mercer County $10.83 $563 $22,520 1.5 $47,100 $1,178 $14,130 $353<br />
378 24% $9.38 $488 1.2<br />
Miller County $11.00 $572 $22,880 1.5 $47,000 $1,175 $14,100 $353<br />
2,575 25% $8.89 $462 1.2<br />
Mississippi County $10.67 $555 $22,200 1.5 $38,000 $950 $11,400 $285<br />
1,968 37% $5.74 $299 1.9<br />
Moniteau County $11.10 $577 $23,080 1.5 $60,100 $1,503 $18,030 $451<br />
1,187 22% $5.89 $306 1.9<br />
Monroe County $11.13 $579 $23,160 1.5 $51,200 $1,280 $15,360 $384<br />
904 24% $8.16 $424 1.4<br />
Montgomery County $10.87 $565 $22,600 1.5 $49,200 $1,230 $14,760 $369<br />
1,130 23% $8.32 $433 1.3<br />
Morgan County $10.67 $555 $22,200 1.5 $45,800 $1,145 $13,740 $344<br />
1,540 18% $7.87 $409 1.4<br />
New Madrid County $10.67 $555 $22,200 1.5 $43,200 $1,080 $12,960 $324<br />
2,753 36% $10.37 $539 1.0<br />
Sullivan City (part <strong>of</strong> Crawford County) is not included due to a lack <strong>of</strong> sufficient data.<br />
1: FMR = Fiscal Year <strong>2012</strong> Fair Market Rent (HUD, 2011). 2: AMI = Fiscal Year <strong>2012</strong> Area Median <strong>Income</strong> (HUD, 2011).<br />
3: "Affordable" rents represent the generally accepted standard <strong>of</strong> spending not more than 30% <strong>of</strong> gross income on gross housing costs<br />
4: The federal standard for extremely low income households. Does not include HUD-specific adjustments.<br />
<strong>National</strong> <strong>Low</strong> <strong>Income</strong> <strong>Housing</strong> <strong>Coalition</strong> | <strong>Out</strong> <strong>of</strong> <strong>Reach</strong> <strong>2012</strong> 120 120


