Out of Reach 2012 - National Low Income Housing Coalition
Out of Reach 2012 - National Low Income Housing Coalition
Out of Reach 2012 - National Low Income Housing Coalition

You also want an ePaper? Increase the reach of your titles
YUMPU automatically turns print PDFs into web optimized ePapers that Google loves.
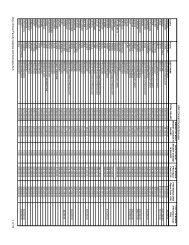
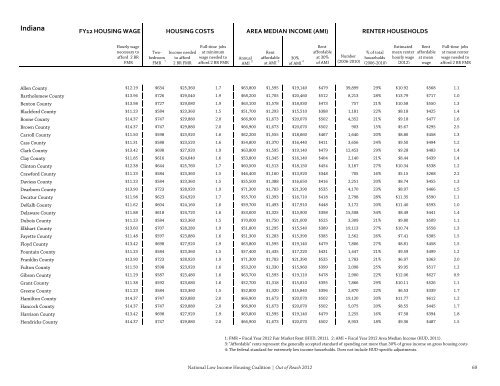
Indiana<br />
FY12 HOUSING WAGE<br />
HOUSING COSTS<br />
AREA MEDIAN INCOME (AMI)<br />
RENTER HOUSEHOLDS<br />
Hourly wage<br />
necessary to<br />
afford 2 BR<br />
FMR<br />
Twobedroom<br />
1<br />
FMR<br />
<strong>Income</strong> needed<br />
to afford<br />
2 BR FMR<br />
Full-time jobs<br />
at minimum<br />
wage needed to<br />
afford 2 BR FMR<br />
Annual<br />
AMI<br />
Rent<br />
affordable<br />
at AMI<br />
30%<br />
<strong>of</strong> AMI<br />
2 3 4<br />
Rent<br />
affordable<br />
at 30%<br />
<strong>of</strong> AMI<br />
Number<br />
(2006-2010)<br />
% <strong>of</strong> total<br />
households<br />
(2006-2010)<br />
Estimated<br />
mean renter<br />
hourly wage<br />
(<strong>2012</strong>)<br />
Rent<br />
affordable<br />
at mean<br />
wage<br />
Full-time jobs<br />
at mean renter<br />
wage needed to<br />
afford 2 BR FMR<br />
Allen County $12.19 $634 $25,360 1.7 $63,800 $1,595 $19,140 $479 39,899 29% $10.92 $568 1.1<br />
Bartholomew County $13.96 $726 $29,040 1.9 $68,200 $1,705 $20,460 $512<br />
8,213 28% $13.79 $717 1.0<br />
Benton County $13.98 $727 $29,080 1.9 $63,100 $1,578 $18,930 $473<br />
757 21% $10.58 $550 1.3<br />
Blackford County $11.23 $584 $23,360 1.5 $51,700 $1,293 $15,510 $388<br />
1,181 22% $8.18 $425 1.4<br />
Boone County $14.37 $747 $29,880 2.0 $66,900 $1,673 $20,070 $502<br />
4,352 21% $9.18 $477 1.6<br />
Brown County $14.37 $747 $29,880 2.0 $66,900 $1,673 $20,070 $502<br />
903 15% $5.67 $295 2.5<br />
Carroll County $11.50 $598 $23,920 1.6 $62,200 $1,555 $18,660 $467<br />
1,640 20% $8.80 $458 1.3<br />
Cass County $11.31 $588 $23,520 1.6 $54,800 $1,370 $16,440 $411<br />
3,656 24% $9.50 $494 1.2<br />
Clark County $13.42 $698 $27,920 1.9 $63,800 $1,595 $19,140 $479 12,453 29% $9.28 $483 1.4<br />
Clay County $11.85 $616 $24,640 1.6 $53,800 $1,345 $16,140 $404<br />
2,140 21% $8.44 $439 1.4<br />
Clinton County $12.38 $644 $25,760 1.7 $60,500 $1,513 $18,150 $454<br />
3,167 27% $10.34 $538 1.2<br />
Crawford County $11.23 $584 $23,360 1.5 $46,400 $1,160 $13,920 $348<br />
705 16% $5.15 $268 2.2<br />
Daviess County $11.23 $584 $23,360 1.5 $55,500 $1,388 $16,650 $416<br />
2,251 20% $8.74 $455 1.3<br />
Dearborn County $13.90 $723 $28,920 1.9 $71,300 $1,783 $21,390 $535<br />
4,170 23% $8.97 $466 1.5<br />
Decatur County $11.98 $623 $24,920 1.7 $55,700 $1,393 $16,710 $418<br />
2,798 28% $11.35 $590 1.1<br />
DeKalb County $11.62 $604 $24,160 1.6 $59,700 $1,493 $17,910 $448<br />
3,172 20% $11.40 $593 1.0<br />
Delaware County $11.88 $618 $24,720 1.6 $53,000 $1,325 $15,900 $398 15,508 34% $8.49 $441 1.4<br />
Dubois County $11.23 $584 $23,360 1.5 $70,000 $1,750 $21,000 $525<br />
3,309 21% $9.80 $509 1.1<br />
Elkhart County $13.60 $707 $28,280 1.9 $51,800 $1,295 $15,540 $389 19,113 27% $10.74 $558 1.3<br />
Fayette County $11.48 $597 $23,880 1.6 $51,300 $1,283 $15,390 $385<br />
2,562 26% $7.41 $385 1.5<br />
Floyd County $13.42 $698 $27,920 1.9 $63,800 $1,595 $19,140 $479<br />
7,806 27% $8.81 $458 1.5<br />
Fountain County $11.23 $584 $23,360 1.5 $57,400 $1,435 $17,220 $431<br />
1,447 21% $9.59 $499 1.2<br />
Franklin County $13.90 $723 $28,920 1.9 $71,300 $1,783 $21,390 $535<br />
1,783 21% $6.97 $363 2.0<br />
Fulton County $11.50 $598 $23,920 1.6 $53,200 $1,330 $15,960 $399<br />
2,098 25% $9.95 $517 1.2<br />
Gibson County $11.29 $587 $23,480 1.6 $63,700 $1,593 $19,110 $478<br />
2,900 22% $12.06 $627 0.9<br />
Grant County $11.38 $592 $23,680 1.6 $52,700 $1,318 $15,810 $395<br />
7,866 29% $10.11 $526 1.1<br />
Greene County $11.23 $584 $23,360 1.5 $52,800 $1,320 $15,840 $396<br />
2,870 22% $6.53 $339 1.7<br />
Hamilton County $14.37 $747 $29,880 2.0 $66,900 $1,673 $20,070 $502 19,120 20% $11.77 $612 1.2<br />
Hancock County $14.37 $747 $29,880 2.0 $66,900 $1,673 $20,070 $502<br />
5,075 20% $8.55 $445 1.7<br />
Harrison County $13.42 $698 $27,920 1.9 $63,800 $1,595 $19,140 $479<br />
2,255 16% $7.58 $394 1.8<br />
Hendricks County $14.37 $747 $29,880 2.0 $66,900 $1,673 $20,070 $502<br />
8,953 18% $9.36 $487 1.5<br />
1: FMR = Fiscal Year <strong>2012</strong> Fair Market Rent (HUD, 2011). 2: AMI = Fiscal Year <strong>2012</strong> Area Median <strong>Income</strong> (HUD, 2011).<br />
3: "Affordable" rents represent the generally accepted standard <strong>of</strong> spending not more than 30% <strong>of</strong> gross income on gross housing costs<br />
4: The federal standard for extremely low income households. Does not include HUD-specific adjustments.<br />
<strong>National</strong> <strong>Low</strong> <strong>Income</strong> <strong>Housing</strong> <strong>Coalition</strong> | <strong>Out</strong> <strong>of</strong> <strong>Reach</strong> <strong>2012</strong> 69<br />
<strong>National</strong> <strong>Low</strong> <strong>Income</strong> <strong>Housing</strong> <strong>Coalition</strong> | <strong>Out</strong> <strong>of</strong> <strong>Reach</strong> <strong>2012</strong> 69