Out of Reach 2012 - National Low Income Housing Coalition
Out of Reach 2012 - National Low Income Housing Coalition
Out of Reach 2012 - National Low Income Housing Coalition

You also want an ePaper? Increase the reach of your titles
YUMPU automatically turns print PDFs into web optimized ePapers that Google loves.
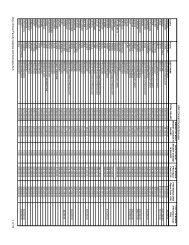
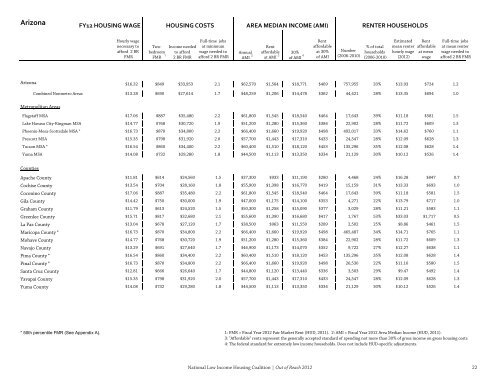
Arizona<br />
FY12 HOUSING WAGE<br />
HOUSING COSTS<br />
AREA MEDIAN INCOME (AMI)<br />
RENTER HOUSEHOLDS<br />
Hourly wage<br />
necessary to<br />
afford 2 BR<br />
FMR<br />
Twobedroom<br />
1<br />
FMR<br />
<strong>Income</strong> needed<br />
to afford<br />
2 BR FMR<br />
Full-time jobs<br />
at minimum<br />
wage needed to<br />
afford 2 BR FMR<br />
Annual<br />
AMI<br />
Rent<br />
affordable<br />
at AMI<br />
30%<br />
<strong>of</strong> AMI<br />
2 3 4<br />
Rent<br />
affordable<br />
at 30%<br />
<strong>of</strong> AMI<br />
Number<br />
(2006-2010)<br />
% <strong>of</strong> total<br />
households<br />
(2006-2010)<br />
Estimated<br />
mean renter<br />
hourly wage<br />
(<strong>2012</strong>)<br />
Rent<br />
affordable<br />
at mean<br />
wage<br />
Full-time jobs<br />
at mean renter<br />
wage needed to<br />
afford 2 BR FMR<br />
Arizona $16.32 $849 $33,953 2.1 $62,570 $1,564 $18,771 $469 757,955 33% $13.93 $724 1.2<br />
Combined Nonmetro Areas $13.28 $690 $27,614 1.7 $48,259 $1,206 $14,478 $362 44,421 28% $13.35 $694 1.0<br />
Metropolitan Areas<br />
Flagstaff MSA $17.06 $887 $35,480 2.2 $61,800 $1,545 $18,540 $464 17,643 39% $11.18 $581 1.5<br />
Lake Havasu City-Kingman MSA $14.77 $768 $30,720 1.9 $51,200 $1,280 $15,360 $384 22,902 28% $11.72 $609 1.3<br />
Phoenix-Mesa-Scottsdale MSA * $16.73 $870 $34,800 2.2 $66,400 $1,660 $19,920 $498 492,017 33% $14.62 $760 1.1<br />
Prescott MSA $15.35 $798 $31,920 2.0 $57,700 $1,443 $17,310 $433 24,547 28% $12.09 $628 1.3<br />
Tucson MSA * $16.54 $860 $34,400 2.2 $60,400 $1,510 $18,120 $453 135,296 35% $12.08 $628 1.4<br />
Yuma MSA $14.08 $732 $29,280 1.8 $44,500 $1,113 $13,350 $334 21,129 30% $10.12 $526 1.4<br />
Counties<br />
Apache County $11.81 $614 $24,560 1.5 $37,300 $933 $11,190 $280<br />
4,468 24% $16.28 $847 0.7<br />
Cochise County $13.54 $704 $28,160 1.8 $55,900 $1,398 $16,770 $419 15,159 31% $13.33 $693 1.0<br />
Coconino County $17.06 $887 $35,480 2.2 $61,800 $1,545 $18,540 $464 17,643 39% $11.18 $581 1.5<br />
Gila County $14.42 $750 $30,000 1.9 $47,000 $1,175 $14,100 $353<br />
4,271 22% $13.79 $717 1.0<br />
Graham County $11.79 $613 $24,520 1.5 $50,300 $1,258 $15,090 $377<br />
3,029 28% $11.21 $583 1.1<br />
Greenlee County $15.71 $817 $32,680 2.1 $55,600 $1,390 $16,680 $417<br />
1,767 53% $33.03 $1,717 0.5<br />
La Paz County $13.04 $678 $27,120 1.7 $38,500 $963 $11,550 $289<br />
2,502 25% $8.86 $461 1.5<br />
Maricopa County * $16.73 $870 $34,800 2.2 $66,400 $1,660 $19,920 $498 465,487 34% $14.71 $765 1.1<br />
Mohave County $14.77 $768 $30,720 1.9 $51,200 $1,280 $15,360 $384 22,902 28% $11.72 $609 1.3<br />
Navajo County $13.29 $691 $27,640 1.7 $46,900 $1,173 $14,070 $352<br />
9,722 27% $12.27 $638 1.1<br />
Pima County * $16.54 $860 $34,400 2.2 $60,400 $1,510 $18,120 $453 135,296 35% $12.08 $628 1.4<br />
Pinal County * $16.73 $870 $34,800 2.2 $66,400 $1,660 $19,920 $498 26,530 22% $11.16 $580 1.5<br />
Santa Cruz County $12.81 $666 $26,640 1.7 $44,800 $1,120 $13,440 $336<br />
3,503 29% $9.47 $492 1.4<br />
Yavapai County $15.35 $798 $31,920 2.0 $57,700 $1,443 $17,310 $433 24,547 28% $12.09 $628 1.3<br />
Yuma County $14.08 $732 $29,280 1.8 $44,500 $1,113 $13,350 $334 21,129 30% $10.12 $526 1.4<br />
* 50th percentile FMR (See Appendix A).<br />
1: FMR = Fiscal Year <strong>2012</strong> Fair Market Rent (HUD, 2011). 2: AMI = Fiscal Year <strong>2012</strong> Area Median <strong>Income</strong> (HUD, 2011).<br />
3: "Affordable" rents represent the generally accepted standard <strong>of</strong> spending not more than 30% <strong>of</strong> gross income on gross housing costs<br />
4: The federal standard for extremely low income households. Does not include HUD-specific adjustments.<br />
<strong>National</strong> <strong>Low</strong> <strong>Income</strong> <strong>Housing</strong> <strong>Coalition</strong> | <strong>Out</strong> <strong>of</strong> <strong>Reach</strong> <strong>2012</strong> 22 22