Out of Reach 2012 - National Low Income Housing Coalition
Out of Reach 2012 - National Low Income Housing Coalition
Out of Reach 2012 - National Low Income Housing Coalition

You also want an ePaper? Increase the reach of your titles
YUMPU automatically turns print PDFs into web optimized ePapers that Google loves.
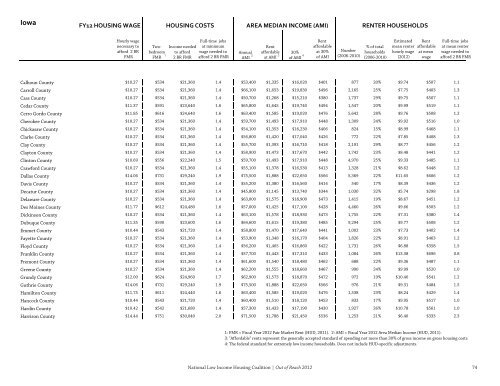
Iowa<br />
FY12 HOUSING WAGE<br />
HOUSING COSTS<br />
AREA MEDIAN INCOME (AMI)<br />
RENTER HOUSEHOLDS<br />
Hourly wage<br />
necessary to<br />
afford 2 BR<br />
FMR<br />
Twobedroom<br />
1<br />
FMR<br />
<strong>Income</strong> needed<br />
to afford<br />
2 BR FMR<br />
Full-time jobs<br />
at minimum<br />
wage needed to<br />
afford 2 BR FMR<br />
Annual<br />
AMI<br />
Rent<br />
affordable<br />
at AMI<br />
30%<br />
<strong>of</strong> AMI<br />
2 3 4<br />
Rent<br />
affordable<br />
at 30%<br />
<strong>of</strong> AMI<br />
Number<br />
(2006-2010)<br />
% <strong>of</strong> total<br />
households<br />
(2006-2010)<br />
Estimated<br />
mean renter<br />
hourly wage<br />
(<strong>2012</strong>)<br />
Rent<br />
affordable<br />
at mean<br />
wage<br />
Full-time jobs<br />
at mean renter<br />
wage needed to<br />
afford 2 BR FMR<br />
Calhoun County $10.27 $534 $21,360 1.4 $53,400 $1,335 $16,020 $401<br />
877 20% $9.74 $507 1.1<br />
Carroll County $10.27 $534 $21,360 1.4 $66,100 $1,653 $19,830 $496<br />
2,165 25% $7.75 $403 1.3<br />
Cass County $10.27 $534 $21,360 1.4 $50,700 $1,268 $15,210 $380<br />
1,737 29% $9.75 $507 1.1<br />
Cedar County $11.37 $591 $23,640 1.6 $65,800 $1,645 $19,740 $494<br />
1,547 20% $9.99 $519 1.1<br />
Cerro Gordo County $11.85 $616 $24,640 1.6 $63,400 $1,585 $19,020 $476<br />
5,642 28% $9.76 $508 1.2<br />
Cherokee County $10.27 $534 $21,360 1.4 $59,700 $1,493 $17,910 $448<br />
1,309 24% $9.92 $516 1.0<br />
Chickasaw County $10.27 $534 $21,360 1.4 $54,100 $1,353 $16,230 $406<br />
824 15% $8.99 $468 1.1<br />
Clarke County $10.27 $534 $21,360 1.4 $56,800 $1,420 $17,040 $426<br />
772 22% $7.85 $408 1.3<br />
Clay County $10.27 $534 $21,360 1.4 $55,700 $1,393 $16,710 $418<br />
2,191 29% $8.77 $456 1.2<br />
Clayton County $10.27 $534 $21,360 1.4 $58,900 $1,473 $17,670 $442<br />
1,742 23% $8.48 $441 1.2<br />
Clinton County $10.69 $556 $22,240 1.5 $59,700 $1,493 $17,910 $448<br />
4,970 25% $9.33 $485 1.1<br />
Crawford County $10.27 $534 $21,360 1.4 $55,100 $1,378 $16,530 $413<br />
1,328 21% $8.62 $448 1.2<br />
Dallas County $14.06 $731 $29,240 1.9 $75,500 $1,888 $22,650 $566<br />
5,369 22% $11.65 $606 1.2<br />
Davis County $10.27 $534 $21,360 1.4 $55,200 $1,380 $16,560 $414<br />
540 17% $8.39 $436 1.2<br />
Decatur County $10.27 $534 $21,360 1.4 $45,800 $1,145 $13,740 $344<br />
1,030 32% $5.74 $298 1.8<br />
Delaware County $10.27 $534 $21,360 1.4 $63,000 $1,575 $18,900 $473<br />
1,415 19% $8.67 $451 1.2<br />
Des Moines County $11.77 $612 $24,480 1.6 $57,000 $1,425 $17,100 $428<br />
4,460 26% $9.66 $503 1.2<br />
Dickinson County $10.27 $534 $21,360 1.4 $63,100 $1,578 $18,930 $473<br />
1,755 22% $7.31 $380 1.4<br />
Dubuque County $11.35 $590 $23,600 1.6 $64,600 $1,615 $19,380 $485<br />
9,294 25% $9.77 $508 1.2<br />
Emmet County $10.44 $543 $21,720 1.4 $58,800 $1,470 $17,640 $441<br />
1,002 23% $7.73 $402 1.4<br />
Fayette County $10.27 $534 $21,360 1.4 $53,900 $1,348 $16,170 $404<br />
1,826 22% $8.91 $463 1.2<br />
Floyd County $10.27 $534 $21,360 1.4 $56,200 $1,405 $16,860 $422<br />
1,731 26% $6.88 $358 1.5<br />
Franklin County $10.27 $534 $21,360 1.4 $57,700 $1,443 $17,310 $433<br />
1,084 26% $13.38 $696 0.8<br />
Fremont County $10.27 $534 $21,360 1.4 $61,600 $1,540 $18,480 $462<br />
688 22% $9.36 $487 1.1<br />
Greene County $10.27 $534 $21,360 1.4 $62,200 $1,555 $18,660 $467<br />
990 24% $9.99 $520 1.0<br />
Grundy County $12.00 $624 $24,960 1.7 $62,900 $1,573 $18,870 $472<br />
972 19% $10.40 $541 1.2<br />
Guthrie County $14.06 $731 $29,240 1.9 $75,500 $1,888 $22,650 $566<br />
976 21% $9.31 $484 1.5<br />
Hamilton County $11.75 $611 $24,440 1.6 $63,400 $1,585 $19,020 $476<br />
1,538 23% $8.24 $429 1.4<br />
Hancock County $10.44 $543 $21,720 1.4 $60,400 $1,510 $18,120 $453<br />
833 17% $9.95 $517 1.0<br />
Hardin County $10.42 $542 $21,680 1.4 $57,300 $1,433 $17,190 $430<br />
1,927 26% $10.78 $561 1.0<br />
Harrison County $14.44 $751 $30,040 2.0 $71,500 $1,788 $21,450 $536<br />
1,253 21% $6.40 $333 2.3<br />
1: FMR = Fiscal Year <strong>2012</strong> Fair Market Rent (HUD, 2011). 2: AMI = Fiscal Year <strong>2012</strong> Area Median <strong>Income</strong> (HUD, 2011).<br />
3: "Affordable" rents represent the generally accepted standard <strong>of</strong> spending not more than 30% <strong>of</strong> gross income on gross housing costs<br />
4: The federal standard for extremely low income households. Does not include HUD-specific adjustments.<br />
<strong>National</strong> <strong>Low</strong> <strong>Income</strong> <strong>Housing</strong> <strong>Coalition</strong> | <strong>Out</strong> <strong>of</strong> <strong>Reach</strong> <strong>2012</strong> 74 74