Out of Reach 2012 - National Low Income Housing Coalition
Out of Reach 2012 - National Low Income Housing Coalition
Out of Reach 2012 - National Low Income Housing Coalition

Create successful ePaper yourself
Turn your PDF publications into a flip-book with our unique Google optimized e-Paper software.
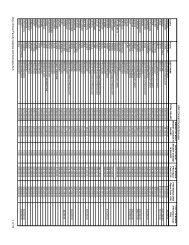
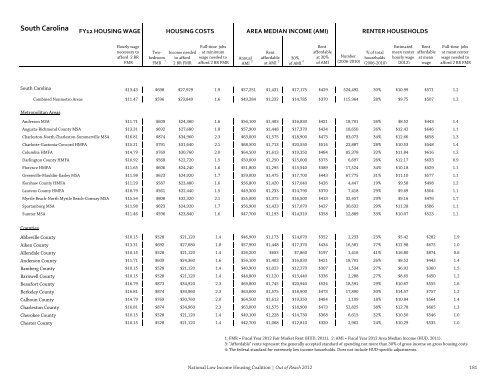
South Carolina<br />
FY12 HOUSING WAGE<br />
HOUSING COSTS<br />
AREA MEDIAN INCOME (AMI)<br />
RENTER HOUSEHOLDS<br />
Hourly wage<br />
necessary to<br />
afford 2 BR<br />
FMR<br />
Twobedroom<br />
1<br />
FMR<br />
<strong>Income</strong> needed<br />
to afford<br />
2 BR FMR<br />
Full-time jobs<br />
at minimum<br />
wage needed to<br />
afford 2 BR FMR<br />
Annual<br />
AMI<br />
Rent<br />
affordable<br />
at AMI<br />
30%<br />
<strong>of</strong> AMI<br />
2 3 4<br />
Rent<br />
affordable<br />
at 30%<br />
<strong>of</strong> AMI<br />
Number<br />
(2006-2010)<br />
% <strong>of</strong> total<br />
households<br />
(2006-2010)<br />
Estimated<br />
mean renter<br />
hourly wage<br />
(<strong>2012</strong>)<br />
Rent<br />
affordable<br />
at mean<br />
wage<br />
Full-time jobs<br />
at mean renter<br />
wage needed to<br />
afford 2 BR FMR<br />
South Carolina $13.43 $698 $27,929 1.9 $57,251 $1,431 $17,175 $429 524,492 30% $10.99 $571 1.2<br />
Combined Nonmetro Areas $11.47 $596 $23,849 1.6 $49,284 $1,232 $14,785 $370 115,964 28% $9.75 $507 1.2<br />
Metropolitan Areas<br />
Anderson MSA $11.71 $609 $24,360 1.6 $56,100 $1,403 $16,830 $421 18,701 26% $8.52 $443 1.4<br />
Augusta-Richmond County MSA $13.31 $692 $27,680 1.8 $57,900 $1,448 $17,370 $434 18,650 26% $12.42 $646 1.1<br />
Charleston-North Charleston-Summerville MSA $16.81 $874 $34,960 2.3 $63,000 $1,575 $18,900 $473 83,073 34% $12.66 $658 1.3<br />
Charlotte-Gastonia-Concord HMFA $15.21 $791 $31,640 2.1 $68,500 $1,713 $20,550 $514 22,887 28% $10.53 $548 1.4<br />
Columbia HMFA $14.79 $769 $30,760 2.0 $64,500 $1,613 $19,350 $484 85,378 32% $11.84 $616 1.2<br />
Darlington County HMFA $10.92 $568 $22,720 1.5 $50,000 $1,250 $15,000 $375<br />
6,697 26% $12.17 $633 0.9<br />
Florence HMFA $11.65 $606 $24,240 1.6 $51,800 $1,295 $15,540 $389 17,524 34% $10.18 $529 1.1<br />
Greenville-Mauldin-Easley MSA $11.98 $623 $24,920 1.7 $59,000 $1,475 $17,700 $443 67,775 31% $11.10 $577 1.1<br />
Kershaw County HMFA $11.29 $587 $23,480 1.6 $56,800 $1,420 $17,040 $426<br />
4,447 19% $9.58 $498 1.2<br />
Laurens County HMFA $10.79 $561 $22,440 1.5 $49,300 $1,233 $14,790 $370<br />
7,418 29% $9.69 $504 1.1<br />
Myrtle Beach-North Myrtle Beach-Conway MSA $15.54 $808 $32,320 2.1 $55,000 $1,375 $16,500 $413 32,457 29% $9.16 $476 1.7<br />
Spartanburg MSA $11.98 $623 $24,920 1.7 $56,900 $1,423 $17,070 $427 30,632 29% $11.28 $586 1.1<br />
Sumter MSA $11.46 $596 $23,840 1.6 $47,700 $1,193 $14,310 $358 12,889 33% $10.07 $523 1.1<br />
Counties<br />
Abbeville County $10.15 $528 $21,120 1.4 $46,900 $1,173 $14,070 $352<br />
2,233 23% $5.42 $282 1.9<br />
Aiken County $13.31 $692 $27,680 1.8 $57,900 $1,448 $17,370 $434 16,581 27% $12.98 $675 1.0<br />
Allendale County $10.15 $528 $21,120 1.4 $26,200 $655 $7,860 $197<br />
1,416 41% $16.80 $874 0.6<br />
Anderson County $11.71 $609 $24,360 1.6 $56,100 $1,403 $16,830 $421 18,701 26% $8.52 $443 1.4<br />
Bamberg County $10.15 $528 $21,120 1.4 $40,900 $1,023 $12,270 $307<br />
1,534 27% $6.92 $360 1.5<br />
Barnwell County $10.15 $528 $21,120 1.4 $44,800 $1,120 $13,440 $336<br />
2,288 27% $8.65 $450 1.2<br />
Beaufort County $16.79 $873 $34,920 2.3 $69,800 $1,745 $20,940 $524 18,591 29% $10.67 $555 1.6<br />
Berkeley County $16.81 $874 $34,960 2.3 $63,000 $1,575 $18,900 $473 17,890 30% $14.57 $757 1.2<br />
Calhoun County $14.79 $769 $30,760 2.0 $64,500 $1,613 $19,350 $484<br />
1,109 18% $10.84 $564 1.4<br />
Charleston County $16.81 $874 $34,960 2.3 $63,000 $1,575 $18,900 $473 52,825 38% $12.78 $665 1.3<br />
Cherokee County $10.15 $528 $21,120 1.4 $49,100 $1,228 $14,730 $368<br />
6,615 32% $10.50 $546 1.0<br />
Chester County $10.15 $528 $21,120 1.4 $42,700 $1,068 $12,810 $320<br />
2,962 24% $10.29 $535 1.0<br />
1: FMR = Fiscal Year <strong>2012</strong> Fair Market Rent (HUD, 2011). 2: AMI = Fiscal Year <strong>2012</strong> Area Median <strong>Income</strong> (HUD, 2011).<br />
3: "Affordable" rents represent the generally accepted standard <strong>of</strong> spending not more than 30% <strong>of</strong> gross income on gross housing costs<br />
4: The federal standard for extremely low income households. Does not include HUD-specific adjustments.<br />
<strong>National</strong> <strong>Low</strong> <strong>Income</strong> <strong>Housing</strong> <strong>Coalition</strong> | <strong>Out</strong> <strong>of</strong> <strong>Reach</strong> <strong>2012</strong> 181<br />
<strong>National</strong> <strong>Low</strong> <strong>Income</strong> <strong>Housing</strong> <strong>Coalition</strong> | <strong>Out</strong> <strong>of</strong> <strong>Reach</strong> <strong>2012</strong> 181