Chapter Nine- Activity-Based Costing
Chapter Nine- Activity-Based Costing
Chapter Nine- Activity-Based Costing
You also want an ePaper? Increase the reach of your titles
YUMPU automatically turns print PDFs into web optimized ePapers that Google loves.
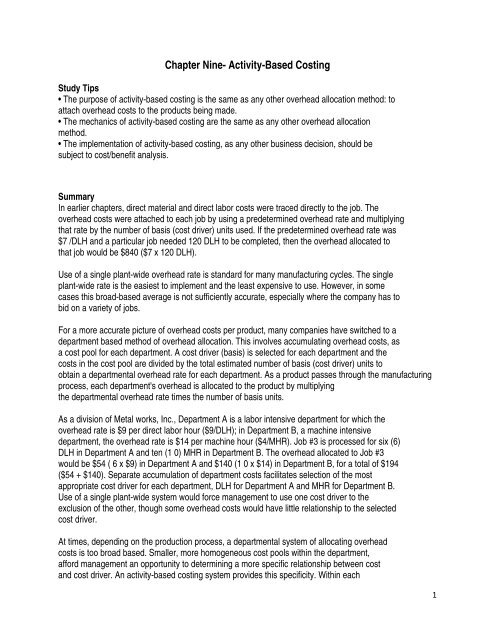
<strong>Chapter</strong> <strong>Nine</strong>- <strong>Activity</strong>-<strong>Based</strong> <strong>Costing</strong><br />
Study Tips<br />
• The purpose of activity-based costing is the same as any other overhead allocation method: to<br />
attach overhead costs to the products being made.<br />
• The mechanics of activity-based costing are the same as any other overhead allocation<br />
method.<br />
• The implementation of activity-based costing, as any other business decision, should be<br />
subject to cost/benefit analysis.<br />
Summary<br />
In earlier chapters, direct material and direct labor costs were traced directly to the job. The<br />
overhead costs were attached to each job by using a predetermined overhead rate and multiplying<br />
that rate by the number of basis (cost driver) units used. If the predetermined overhead rate was<br />
$7 /DLH and a particular job needed 120 DLH to be completed, then the overhead allocated to<br />
that job would be $840 ($7 x 120 DLH).<br />
Use of a single plant-wide overhead rate is standard for many manufacturing cycles. The single<br />
plant-wide rate is the easiest to implement and the least expensive to use. However, in some<br />
cases this broad-based average is not sufficiently accurate, especially where the company has to<br />
bid on a variety of jobs.<br />
For a more accurate picture of overhead costs per product, many companies have switched to a<br />
department based method of overhead allocation. This involves accumulating overhead costs, as<br />
a cost pool for each department. A cost driver (basis) is selected for each department and the<br />
costs in the cost pool are divided by the total estimated number of basis (cost driver) units to<br />
obtain a departmental overhead rate for each department. As a product passes through the manufacturing<br />
process, each department's overhead is allocated to the product by multiplying<br />
the departmental overhead rate times the number of basis units.<br />
As a division of Metal works, Inc., Department A is a labor intensive department for which the<br />
overhead rate is $9 per direct labor hour ($9/DLH); in Department B, a machine intensive<br />
department, the overhead rate is $14 per machine hour ($4/MHR). Job #3 is processed for six (6)<br />
DLH in Department A and ten (1 0) MHR in Department B. The overhead allocated to Job #3<br />
would be $54 ( 6 x $9) in Department A and $140 (1 0 x $14) in Department B, for a total of $194<br />
($54 + $140). Separate accumulation of department costs facilitates selection of the most<br />
appropriate cost driver for each department, DLH for Department A and MHR for Department B.<br />
Use of a single plant-wide system would force management to use one cost driver to the<br />
exclusion of the other, though some overhead costs would have little relationship to the selected<br />
cost driver.<br />
At times, depending on the production process, a departmental system of allocating overhead<br />
costs is too broad based. Smaller, more homogeneous cost pools within the department,<br />
afford management an opportunity to determining a more specific relationship between cost<br />
and cost driver. An activity-based costing system provides this specificity. Within each<br />
1
department there may be several activities, such as, setting up machines, drilling holes in a<br />
sheet of metal, and inserting components into that metal sheet, with some insertions done by<br />
hand and some by machine. Development of a separate cost pool for each activity is more<br />
time consuming and costly, but the improved accuracy of overhead allocation might<br />
outweigh the additional cost.<br />
In Metalworks, Inc., Division B the overhead rate was $14/MHR; this rate was<br />
predetermined by comparing the estimated overhead costs, $140,000, to the estimated<br />
number of machine hours, 10,000 ($140,000/1 0,000 MHR). Additional analysis led<br />
management to identify cost pool components as follows: $30,000 to machine set-up activity;<br />
$70,000 to hole drilling activity; $25,000 to machine insertion activity and $15,000 to<br />
manual insertion activity. Cost drivers selected were (respectively) number of set-ups,<br />
number of holes drilled, number of machine insertions, and number of manual insertions. An<br />
overhead rate can be computed for each activity, as follows.<br />
When processing Job #3 in Department Bit is now necessary to keep track of how many set-ups<br />
took place, how many holes were drilled, how many machine insertions took place, and how<br />
many manual insertions took place. The allocation process involves multiplying the overhead<br />
rate for each activity times the respective number of cost driver units. Overhead allocation Job #3<br />
is based on the following information: number of set-ups, 8; number of holes drilled, 1 0; number<br />
of machine insertions, 6; number of manual insertions, 3.<br />
Logistics for allocating overhead are the same whether one plant-wide rate, a department based<br />
system, or activity-based costing is used. Determine an overhead rate by estimating the cost pool<br />
and dividing it by the estimated level (number of units) of the cost driver. To allocate overhead<br />
costs to a particular job, multiply the overhead rate times the number of cost driver units used on<br />
the job. The difference between the various methods (plant-wide, department based or activity-based)<br />
lies in the homogeneity and size of the cost pools and the variety of cost drivers.<br />
2
Questions<br />
Mark each of the following questions as True (T) or False (F).<br />
1. <strong>Activity</strong>-based costing is preferred to traditional costing methods.<br />
2. A death spiral refers to a situation of decreasing rather than to increasing demand.<br />
3. Using a department allocation method, as opposed to a plant-wide allocation method, would<br />
provide greater accuracy but at a greater cost.<br />
4. Using a plant-wide allocation method, as opposed to activity-based costing, would provide<br />
greater accuracy at a lesser cost.<br />
5. In activity-based costing, a separate cost driver must be developed for each cost pool.<br />
6. The term "cost hierarchy" refers to the primacy of the material and labor costs.<br />
7. Computing the cost driver rate involves exactly the same type of computation necessary to<br />
compute any predetermined overhead rate.<br />
8. <strong>Activity</strong>-based costing often provides managers with specific information to help them better<br />
manage costs.<br />
9. Complexity is costly.<br />
10. <strong>Activity</strong>-based costing is specialized in use to the manufacturing area.<br />
Answers to True/False Questions<br />
1. False. The decision to implement an ABC system should be based on cost vs. benefit.<br />
2. False. If future demand is automatically assumed; this, too, can lead to negative results.<br />
3. True. There is greater accuracy because there are more cost pools, but there is greater cost to<br />
track this more complicated system.<br />
4. False. There is less cost; there is also less accuracy.<br />
5. True. This is what provides the greater accuracy. Each cost pool is more homogeneous than<br />
before and can be more accurately allocated to the products.<br />
6. False. The term refers to volume, batch, product and facility based costs.<br />
7. True. The computation is made several times, once for each cost pool, but it is the same type<br />
of computation as before.<br />
8. True. ABC analysis often leads to a better understanding of what causes costs to change,<br />
which in turn often leads to better management of those costs.<br />
9. True. Think of managing the production often blue pens versus the production of five blue<br />
pens and five red pens. The opportunity for error is greater in the second case and more costly.<br />
10. False. The principles of ABC can be applied anywhere.<br />
3
<strong>Chapter</strong> Eleven- Service Department and Joint Cost Allocation<br />
Study Tips<br />
• Service department costs increase the cost of the product and these costs should be attached<br />
to the products.<br />
• Different allocation methods are based on different assumptions: (1) direct allocation, no<br />
service department provides service to any other service department; (2) step allocation,<br />
service departments can provide service to other service departments but cannot, at the same<br />
time, receive service from other service departments; (3) reciprocal method, full reciprocity<br />
between service departments.<br />
• Judgments must be made considering the difference between the necessity of joint cost<br />
allocation for financial statements and the irrelevancy of such allocation for decision making.<br />
Summary<br />
Continuing the discussion of product cost determination, first there is a focus on service<br />
departments, why and how these costs relate to production. The remainder of the chapter is<br />
devoted to discussion of joint cost allocation.<br />
Service Department Cost Allocation<br />
The primary function of a service department is to provide service to other departments.<br />
Examples of a service department include a cafeteria, the buildings and grounds group, the<br />
computer center, and human resources. These service departments provide service to the<br />
producing departments (e.g., stamping, assembly, or finishing) and to non-producing<br />
departments (e.g., all the other service departments). The service department is a cost used by the<br />
production department; all costs of production should be attached to the products.<br />
Because there is usually no direct, traceable relationship to the products being manufactured, the<br />
service cost attachment process must be an indirect one. Relevant service department costs are<br />
allocated to the producing departments, which increases that department's overhead. This in turn<br />
will increase the producing department's overhead rate which, when applied to the products, will<br />
attach a portion of the service department's costs to each product.<br />
Assume that Kennesaw Manufacturing Company has two production departments, Assembly and<br />
Finishing; there are two service departments, the cafeteria and the buildings and grounds.<br />
Job #62 requires 400 machine hours in Assembly and 100 direct labor hours in Finishing. The<br />
amount of overhead applied to Job #62 would be $1,600 (400 x $3 + 100 x $4).<br />
4
When the service department costs are added, the production department cost is increased. The<br />
cafeteria costs are $24,000 and building and ground costs are $36,000. How should the service<br />
department costs be apportioned to the production departments and then to the products?<br />
Two methods are commonly used to allocate the service department costs to the producing<br />
departments; the step-down method, the direct method. A third, the reciprocal method, is more<br />
representative but requires a complicated set of simultaneous equations. The most simple<br />
(mathematically) to implement is the direct method. This method allocates the service<br />
department costs directly to the production departments and ignores any relationship to any other<br />
service departments. An allocation basis with a causal relationship should be selected.<br />
Direct Method<br />
For the Kennesaw cafeteria, it is logical to use the number of employees in each department as<br />
the allocation basis. The greater a department's number of employees, the greater the demand<br />
that department puts on the cafeteria. Assume there are twenty employees in the Assembly<br />
department and thirty employees in the Finishing department. Then 40% (20/50) of the cafeteria<br />
costs would be allocated to Assembly and 60% (30/50) would be allocated to Finishing.<br />
When allocating Kennesaw maintenance costs, a basic assumption is that larger departments<br />
require more maintenance; a common basis for allocating this type of cost is square footage.<br />
Consider the Assembly department has 48,000 square feet; the Finishing department has 12,000<br />
square feet.<br />
5
Analyze the overhead rates computed prior to and after service departments costs were included.<br />
Initially the rates were $3 per machine hour for Assembly and $4 per direct labor hour for<br />
Finishing. Including service costs increases the rates: $6.84 per machine hour for Assembly and<br />
$5.08 per direct labor hour for Finishing. With Job #62 requiring 400 machine hours in<br />
Assembly and 100 direct labor hours in the Finishing Department the overhead applied, using the<br />
new rates would now be $3,244.<br />
Step Method<br />
Although the direct method is straightforward and easy, it is theoretically less than accurate. The<br />
Kennesaw employees in B & G often eat in the cafeteria and B & G employees sometimes<br />
provide maintenance to the cafeteria. The step (step-down) method partially addresses this<br />
cross-provision of services.<br />
The step method allows for service department provision to other service departments, but only<br />
in one direction. If the cafeteria is considered the primary service department, then the step<br />
method assumes that Building and Grounds (B&G) provides no service to the Cafeteria. In<br />
practical terms, costs are "stepped-down"; once a service department's costs have been<br />
allocated to the other department it does not receive service from other service department.<br />
Under the step method the order of allocation (which service department costs are allocated first,<br />
which second, etc.), affects the overhead rate. Following are calculations which first demonstrate<br />
cost allocation with cafeteria service at the top of the hierarchy. Then, service costs are allocated<br />
6
under the assumption that B & G service costs are at the top of the hierarchy. In data presented to illustrate<br />
the direct method, note that the basis for allocation of Kennesaw cafeteria costs was the<br />
number of employees and the basis for allocation of buildings & grounds was square footage.<br />
Additional information indicates that Kennesaw's cafeteria has 20,000 square feet and there are<br />
ten employees in the B & G service department<br />
Notice in the step-down method that not all the cafeteria costs were allocated to the production<br />
departments. The $4,000 allocated to the Building and Grounds department must be included in<br />
B & G costs thereafter allocated to the production departments. Once a department's costs have<br />
been allocated that department no longer receives an allocation of another department's costs.<br />
The procedure to allocate B & G costs to the producing departments is the same as under the<br />
direct method (80% to Assembly, 20% to<br />
Finishing).<br />
Now, assume Building and Grounds (B & G) costs at the top of the hierarchy.<br />
7
And the overhead rate computation would be:<br />
Below is a summary comparison of the direct and step-down methods used in the examples.<br />
Reciprocal Method<br />
The reciprocal method is theoretically the best method because it allows for simultaneous<br />
intra-department services. Computationally it is more difficult; the method requires setting up<br />
simultaneous equations using the relative weights developed in the step method, assuming each<br />
service department goes first. Using the example of Kennesaw Cafeteria and B & G service<br />
departments, the equations would be:<br />
8
Solve the last two equations first, then substitute these values (C = 34,435; B&G = 41,739) in the<br />
first two equations. The results are the total overhead for Assembly, $66,522, and the total<br />
overhead for Finishing, $103,478. The ease of using spreadsheets has resulted in use of the<br />
reciprocal method becoming more prevalent. A comparison of the methods follows:<br />
Joint Cost Allocation<br />
Two or more products of relatively equal value resulting from one common process are<br />
identified as joint products. If two or more products result from a process but one product is<br />
significantly more valuable than the other(s), the valuable one is called the main product and the<br />
other( s) is called the by-product. If the second product is worthless, it is called scrap. These<br />
definitions may change over time as tastes and/or technology change. For example, at one time<br />
old and outdated equipment was left to rust and deteriorate, but now it is either sold to<br />
third-world countries to be used in the manufacturing process or is recycled as scrap iron.<br />
The point at which the various products become identifiable is called the split-off point. All costs<br />
incurred prior to the split-off point are called joint costs; these costs are common to all the<br />
outputs. Think of processing poultry; if the bones were discarded, the cost to process the chicken<br />
would not decrease. In such a situation joint costs are unavoidable.<br />
Two questions arise with regard to joint costs: how should they appear in financial statements<br />
and how do they affect decisions. The relevant accounts for financial statements are Cost of<br />
Goods Sold on the Income Statement, and Inventory on the Balance Sheet.<br />
Poultry processing yields edible products, as well as feathers used for bedding and non-edible<br />
parts used for fertilizer. Assume that split off occurs when the poultry is disassembled; joint costs<br />
incurred before the split-off point are $1,200. At disassembly point (split-off) the poultry can be<br />
identified as 200 pounds of edible product (meat) and 400 pounds of bones (fertilizer). The<br />
feathers are considered a by-product. Assume that meat at the split-off point sells for $12 per<br />
pound and the bones for $1.50 per pound. Joint costs can be allocated using the physical quantity<br />
method or the net realizable value method (essentially, sales value at split off).<br />
9
The physical quantity method allocates the joint costs in the same ratio as the physical quantities<br />
produced, in this case measured in pounds. This procedure of allocation (shown below) is the<br />
same used to allocate service department costs, but now the basis for allocation is pounds.<br />
The following income statement depicts gross margin if 80% of the meat were sold at $12 per<br />
pound and 60% of the bones for $1.50 per pound.<br />
The revenue for meat is 80% x 200 lbs x $12 and the revenue for bones is 60% x 400lbs x $1.50.<br />
The cost of goods sold is the relevant percentage (80% for meat, 60% for bones) multiplied by<br />
the joint cost allocated to that product, $800 to meat and $1 ,600 to bones. This method works in<br />
the sense that it is consistent and there is logic to it, but it makes little sense in this case because<br />
meat is much more valuable than soup bones and should probably bear more cost than the bones.<br />
In our example, the bones are not generating a profit. Perhaps they should just be thrown away?<br />
If they were discarded, no costs would be attached; the full $2,400 would attach to the meat.<br />
Now when 160 pounds of the meat is sold the revenue would be unchanged, $1 ,920, but the cost<br />
of goods sold would be $1,920 (80% x $2,400) and the gross margin would be zero. The joint<br />
costs are not incremental costs with regard to any one of the joint products. The only way to<br />
reduce the joint costs is to get rid of all of them, i.e., stop production before the split-off point.<br />
Perhaps a better method of allocating the joint costs is based on the relative economic value of<br />
the products at the split-off point; this method, the net realizable method considers the relative<br />
demand for each product. Calculate the economic sales value of the products at the split-off point<br />
and use these values as the basis for allocating the joint costs:<br />
10
Now assume sales of80% of the meat and 60% of the bones, the income statement improves:<br />
Computation of ending inventory on the balance sheet is also dependent on which method of<br />
joint cost allocation is used. Using the physical quantities method $800 was allocated to meat<br />
and $1,600 to bones. When 80% of the meat and 60% of the bones were sold this meant that<br />
20% of the meat and 40% of the bones were still left in inventory. The cost of this ending<br />
inventory would be, $800 (20% x $800 + 40% x $1 ,600). Of the joint costs of $2,400; $1,600<br />
appeared on the income statement and the remaining $800 is a current asset on the balance sheet.<br />
In the net realizable value method the ending inventory amount would be $576 (20% x $1,920<br />
+ 40% x $480). Note that the total joint cost, $2,400 minus the cost of goods sold, $1,824, is<br />
equal to the ending inventory, $576.<br />
Questions<br />
Mark each of the following questions as True (T) or False (F).<br />
I) The only departments that use service departments' service are production departments.<br />
2) A crucial decision for service department cost allocation is which basis to use.<br />
3) In the direct method, the order of departments allocated will have no effect on the allocation.<br />
4) In the step method, the order of departments allocated will have no effect on the allocation.<br />
5) The reciprocal method is the theoretically superior method of allocation.<br />
6) Joint products are forever linked; there cannot be one without the other.<br />
7) Joint cost allocation is necessary for financial statement presentation.<br />
8) Individual products are not identifiable before the split-off point.<br />
9) For the sell-or-process-further decision, joint cost allocation is always irrelevant.<br />
1 0) Because by-products are relatively important accountants have developed several ways of accounting<br />
for them.<br />
Answers to True/False Questions<br />
1. False. Any department, including other service departments, may be serviced.<br />
2. True. Service costs may be significant and if the allocation is not logical there may be a negative<br />
behavioral effect.<br />
3. True. Since the service departments are not recipients of any allocation, the order in which their costs<br />
are allocated will not affect the result.<br />
4. False. Since the service departments are recipients of some allocation, the order in which their costs are<br />
allocated will affect the result.<br />
5. True. The reciprocal method recognizes that service departments often exchange services.<br />
6. True. By the nature of the physical process one cannot exist without the other.<br />
7. True. Joint cost allocation is necessary to develop the cost of goods sold value for the income statement<br />
and the inventory value for the balance sheet.<br />
8. True. The split-off point is defined to be the first point where the individual products can be identified.<br />
9. True. Since part of the joint costs is unavoidable, the allocation is irrelevant.<br />
11
10. False. By-products are relatively unimportant; the method of accounting for them has negligible impact<br />
on the financial statements.<br />
<strong>Chapter</strong> Twelve - Fundamentals of Management Control Systems<br />
Study Tips<br />
• Because most large firms are decentralized their owners must think the advantages of<br />
decentralization outweigh any disadvantages.<br />
• Explore carefully the pyramid-type hierarchy of subunit structure: cost and revenue centers at the bottom,<br />
then profit centers, and, at the top, investment centers.<br />
• Distinguish between evaluating a subunit and evaluating its manager.<br />
Summary<br />
Often a situation arises where the decision maker may have a conflict between doing what is best<br />
for the employee versus what is best for the organization. Geographic diversity makes it is<br />
impossible for top management to always be on-site; this necessitates decentralization, the<br />
delegation of decision-making authority to a subordinate. Decision making is pushed down to<br />
lower levels of the organization and out to more geographically remote locations. There are<br />
advantages and disadvantages of decentralization.<br />
Advantages of Decentralization<br />
The advantages of decentralization include: (1) better use of local knowledge, (2) expedites<br />
response time, (3) more focused use of top management's time, (4) reduction of problems to<br />
manageable size, and (5) training and motivation of local managers.<br />
Because company headquarters is usually distanced from geographically dispersed subunits a<br />
local manager is better prepared to make immediate decisions (with some constraints) and can<br />
respond far more quickly than top-level managers. Modem communications tools have led to a<br />
certain amount of re-centralization, but local managers still may have a better working knowledge of local<br />
economy and customs. Training opportunities for subordinates can also be a<br />
stepping stone to promotion. Another advantage of decentralization is that it removes top<br />
management from daily decisions and provides more time to focus on long-term strategic<br />
decisions.<br />
Disadvantages of Decentralization<br />
Lack of goal congruence can be a major disadvantage of decentralization. "Self-interest"<br />
managers may work in their own best interests, which may be inconsistent with the company's<br />
best interests. An example of this dysfunctional decision making, or lack of goal congruence,<br />
might be where the company wants a division to report high net income and the division<br />
manager, in order to decrease expenses, discontinues routine maintenance. A reduction in any<br />
expense increases the division net income; but in the long term, lack of maintenance will harm<br />
the division and the company. In the near term the manager may be sufficiently impressive to<br />
receive a bonus or promotion but no benefit has accrued to the company.<br />
Management Control Systems<br />
12
Structure and procedures used to implement the organizational strategies is basic to a<br />
management control system; this limits the amount of dysfunctional decision making. The<br />
management control systems consist of three elements: (1) delegated decision authority,<br />
(2) performance evaluation and measurement systems and (3) compensation and reward systems.<br />
Empowerment of lower-level employees results when decision making authority is moved<br />
downward in the organization (delegated decision authority). The essence of this decentralization<br />
process is that performance evaluation is linked to the compensation and reward system;<br />
managers are then encouraged to align their personal goals with the goals of the organization.<br />
Responsibility Accounting<br />
Performance evaluation of organization subunits is central to responsibility accounting. Major<br />
models for a subunit are: (1) cost center, (2) revenue center, (3) profit center and 4) investment<br />
center. The major difference in the structure of the subunits is the degree of authority vested in<br />
the manager. In a cost center the manager is responsible for control of costs and perhaps the<br />
quality and timing of the output. A manufacturing unit would usually be organized as a cost<br />
center. The performance evaluation would be based on a budget; operating within the budget is a<br />
high priority.<br />
A revenue center is evaluated similarly to that of a cost center. Generation of revenues is under<br />
the control and responsibility of the manager. A marketing division is an example of a revenue<br />
center. With goals of improving price and quantity, the sales budget is determined; then the<br />
manager's performance is compared to the budget.<br />
Both revenues and costs are the responsibility of a profit center manager, with the ability to<br />
manipulate both revenues and expenses. A highly visible measure of performance is the<br />
subunit's net income. A profit center manager does not have control over investment in the<br />
division's assets.<br />
Greatest responsibility is that of the manager of an investment center with responsibility for<br />
divisional revenues and costs and the responsibility for investment in the division asset base. The<br />
usual measure of performance in an investment center is return on investment (ROI), linking net<br />
income to the investment base.<br />
Evaluating Performance<br />
Evaluating a manager may be different from evaluating the organization sub-unit. An automobile<br />
manufacturing sub-unit has been unprofitable for many years. Top management selects a<br />
manager who has documented experience in a different manufacturing sector and after a<br />
reasonable period of time the sluggish sub-unit begins to shown signs of break-even. The<br />
sub-unit is not successful in absolute terms, break-even is not a profitable situation, but in<br />
relative terms the sub-unit performance is much improved. The new manager should be amply<br />
rewarded.<br />
Compensation Systems<br />
Both positive and negative behavior can result from a compensation and reward system.<br />
Compensation can take two forms: fixed compensation or contingent compensation. Fixed<br />
13
compensation is not usually directly linked to a performance measure; an example is that of a<br />
salaried employee. Contingent compensation is based on measured performance, an example is a<br />
sales commission based on quantity of sales.<br />
Behavioral consequences of a compensation system may be undesirable. Assume that the sales<br />
staff in the cosmetic department receives a 25% commission on every product sold. As an<br />
accommodation, a member of the sales staff allows the customer to purchase two similar<br />
products with the suggestion that one can be returned without penalty. The salesperson helps the<br />
customer, secures a sale for the company and receives a double commission for making two<br />
sales. Good news travels fast and other customers line up for such a good deal. The health<br />
department becomes interested in what appears to be the resale of used cosmetics. The company<br />
receives negative publicity. Sales increase to the company, the sales person is motivated by the<br />
commission, but at what price!<br />
When a manager's compensation is based on departmental performance, how that perfom1ance is<br />
measured is of personal importance. Because cost allocations affect the department performance.<br />
they often become items of contention. Best practice is that a department's cost allocation should<br />
depend on that department's actions and should not be affected by another department's actions.<br />
Faircloth & Associates is a company with three divisions, A, B and C.; common cost is allocated on the<br />
basis of division sales. In the first year of operation sales, commission and net income<br />
were as follows:<br />
Total common cost, $70,000, is 35% of total sales, $200,000. To allocate the cost multiply each<br />
division's sales by 35%.<br />
Assume that in the second year of operation sales for Division C drop to $40,000 while the rest<br />
of the company stays the same as in the first year.<br />
The managers of Division A or B have reason for concern. Sales in Year 2 are identical to sales<br />
in Year l but division net income has decreased due to the increase in cost allocation caused by<br />
the decrease in Division C's sales. Division A and B managers are being held responsible for<br />
costs over which they have no control. What a disincentive! A dual rate allocation system based<br />
upon cost analysis would serve to ameliorate such a negative outcome.<br />
Under a dual rate system, fixed costs are allocated using a variety of allocation bases. Fixed costs<br />
14
are usually allocated at the beginning of the period and are not dependent on the actual activity<br />
of the period, whereas variable costs are allocated as the service is provided.<br />
Assume a computer center provides service to two departments, A and B. The fixed costs of<br />
operating the computer center are $45,000 per month and variable costs are $2 per hour used. 1n<br />
January, both depm1ments used l 0.000 hours of computer time; in February, A used l 0,000<br />
hours but B used only 5,000 hours.<br />
On the basis of estimated long term usage, the fixed costs are allocated 1/3 to A and 2/3 to B.<br />
Each hour of usage is charged $2 (the variable rate per hour). In January, because each<br />
department used l 0,000, each was charged with identical variable cost of $20,000 (I 0,000 hours<br />
x $2 per hour). In addition A would he charged one-third of the fixed costs and B would he<br />
charged two-thirds of the fixed costs. The total allocation for January follows:<br />
Note that total costs allocated ($85,000) equal total incurred: $45,000 of fixed costs and $40,000<br />
of variable costs.<br />
Note that allocation to Department A does not vary from month to month; performance is not<br />
affected by B's activity.<br />
Questions<br />
Mark each of the following questions as True (T) or False (F).<br />
1. In a decentralized firm, local managers have little decision making authority.<br />
2.Centralized organizations are smaller than decentralized organizations.<br />
3. In a decentralized firm, delegation of many decisions allows top managers to focus on<br />
strategic decisions.<br />
4. Cost centers are just as likely as investment centers to be found at all levels of an organization.<br />
5. Goal congruence occurs when workers work in their own best interests.<br />
6. A manager may be evaluated differently from that of the responsibility center.<br />
7. Fixed compensation is superior to contingent compensation for motivating employees.<br />
8. Corporate cost allocation systems may be a disincentive to the recipient divisions.<br />
9. Pressuring employees to perform well may lead them to make illegal or unethical<br />
decisions.<br />
I 0. The emphasis on short term results is a major contributing factor in the pressure to<br />
15
commit fraud.<br />
Answers to True/False Questions<br />
1. False. This is one of the advantages of decentralization: local managers, who are closer to the<br />
local scene, do have decision making authority.<br />
2. False. Not necessarily so; the U.S. armed forces are a centralized organization.<br />
3. True. This is a major advantage of decentralization.<br />
4. False. Cost centers are more likely to be found at lower levels of an organization, investment<br />
centers are more likely to be found at higher levels of an organization.<br />
5. False. Goal congruence occurs when the workers' interests are aligned with the firm's<br />
interests.<br />
6. True. A manager might be doing a good job and still not be able to make the responsibility<br />
center successful.<br />
7. False. Fixed compensation is determined independent of performance; therefore it has minimal<br />
motivating force.<br />
8. True. If the recipient has no control over allocation then the system may appear arbitrary. If<br />
this allocation, in large part, determines the sub-unit's reported performance the manager may<br />
assume personal efforts are unimportant.<br />
9. True. Too much pressure to meet goals may lead to poor decision making.<br />
10. True. Evaluation and bonuses are often tied to short term results, which may in fact be<br />
unrealistic. Manipulation may occur--to the detriment of the company.<br />
16
<strong>Chapter</strong> Thirteen - Planning and Budgeting<br />
Study Tips<br />
• A major advantage of budgeting is that it forces people to think ahead .<br />
• Budgeting should lead to coordination of goals across the organization .<br />
• Dysfunctional decision making may occur if managers work to meet their own particular<br />
budget without any regard for the goals of the company as a whole.<br />
Summary<br />
Most companies are involved in strategic planning, a long term vision of where the company<br />
wants to be in the future. The long-term vision is then implemented in shorter time periods. The<br />
master budget is a one year plan developed to assist the company in achieving its long term<br />
goals. The master budget is usually led by a sales forecast and then, based on that sales budget, a<br />
production budget and pro forma (estimated) financial statements follow.<br />
The sales forecast is extremely important because other budgets are linked to the expected<br />
product demand. Considerable resources- monetary, time and staff expertise- are devoted to<br />
developing the sales budget. Salespeople have a wealth of experience and can use that<br />
knowledge to estimate future sales. One caution when asking salespeople to set their own budget<br />
is to be aware that they know that they will be evaluated by comparing their actual performance<br />
to that stipulated in the budget.<br />
Often outside resources and techniques are used to improve the budget forecast. Market<br />
researcher firms can add a different perspective or the use of a Delphi model could encourage<br />
consensus. The Delphi technique has each group member submit a forecast anonymously. The<br />
group then discusses each forecast and attempts to narrow the differences. This discussion is<br />
followed by each member again submitting a new forecast; the process continues until consensus<br />
is reached.<br />
Another technique used for sales budgeting is to predict future performance based on past trends.<br />
Trend analysis can be as informal as using a graph of past sales or as formal as applying<br />
sophisticated statistical analysis to past sales data. It is crucial to recognize that the integrity of<br />
the data inputs is essential for valid results.<br />
Questions<br />
Mark each of the following questions as True (T) or False (F).<br />
1) Budgets are useful only to large companies.<br />
2) There are no negative aspects to using budgets.<br />
3) Critical success factors are the competition's strengths.<br />
4) The strategic plan is a short term plan to implement the master budget.<br />
5) Because they are quantitative, budgets are independent of human behavior.<br />
6) A claimed benefit for participative budgeting is that it enhances employee motivation.<br />
7) The first step in preparing the master budget is to prepare a sales forecast.<br />
8) Software packages produce results based on the quality of the input data.<br />
9) Manufacturing companies have more types of inventory than do retailers.<br />
17
1 0) Service organizations have no inventory; therefore they have no need to use budgets.<br />
Answers to True/False Questions<br />
1. False. Budgets can be useful to any organization, large or small.<br />
2. False. Budgets may encourage dysfunctional decision making.<br />
3. False. Critical success factors are a company's strengths.<br />
4. False. The master budget is a one year plan to help implement the (long term) plan.<br />
5. False. Budgets are quantitative plans for the future but human beings must implement them<br />
and human beings are complex individuals.<br />
6. True. Participation increases the likelihood that the budget will be accepted.<br />
7. True. The sales forecast is crucial for budgeting production, purchases, cash flow, etc.<br />
8. True. If the input data are not reliable then the results cannot be reliable, no matter how<br />
authoritatively they are pronounced.<br />
9. True. Retailers do not have work-in-process or raw materials inventories.<br />
10. False. Service organizations have no inventories, but they still need budgets to schedule<br />
volunteers, contain costs and meet objectives.<br />
18
<strong>Chapter</strong> Sixteen - Fundamentals of Variance Analysis<br />
Study Tips<br />
• Re-examine the benefits of budgeting and the consequences of not budgeting for every<br />
line item on the income statement and the balance sheet<br />
• The ability to re-budget at the point and time when expectations change is crucial; this is<br />
termed flexible budgeting.<br />
• Relationships between variances may be co-dependent or independent; it is important for<br />
management to understand these relationships.<br />
• A favorable variance does not necessarily indicate a favorable economic situation.<br />
Summary<br />
Budgets are crucial to planning. These tools assist management in coordinating sales, production,<br />
purchases and other divisional activities. Management uses budgets as control mechanisms to<br />
compare variances (differences) between actual performance and budgeted performance. When<br />
net income is greater than budgeted the difference is identified as a favorable variance. When<br />
expenses exceed the budget, an unfavorable variance is created. A favorable variance exists as<br />
the result of revenue exceeding budgeted revenue.<br />
Cost Variances<br />
Alpha and Omega Company is planning for the upcoming year. The expectation is that 30,000<br />
units will be produced each month at a cost of $3 per unit, a total of $90,000. During the month<br />
of January, actual production is 20,000 units and actual cost for the month was $80,000. This<br />
might seem to be a favorable variance but when production quantity is considered, it becomes<br />
obvious that the production cost is excessive.<br />
A closer look at the situation indicates the budgeted cost of $90,000 was for production of<br />
30,000 units, not 20,000 units. It is not logical to compare the actual performance to a budget for<br />
a different level of production. The January production cost is $4 per unit ($80,000/20,000),<br />
which is much more than the expected cost of $3 per unit. The information is more useful when the budget<br />
is adjusted to the actual level of production. This adjusted budget is termed a flexible<br />
budget because it "flexes" to different levels of production. The original budget is called a static<br />
budget in that it represents only one level of production. Static budget information is useful<br />
because it reflects the best understanding of the relationship between volume (levels of<br />
production) and cost. Once these relationships are known, the static budget can be modified to<br />
prepare budgets for several levels of activity.<br />
Questions<br />
Mark each of the following statements as True (T) or False (F).<br />
1. Budgets provide a benchmark against which to measure actual performance.<br />
2. An unfavorable variance increases operating profits, holding all other things constant.<br />
3. A favorable variance is not necessarily good.<br />
4. Static budgets are prepared before production; flexible budgets are used afterwards.<br />
5. Cost variances are important for measuring productivity and controlling costs.<br />
6. If the price variance is favorable then the efficiency variance must be unfavorable.<br />
19
7. The direct labor price variance is based on the time actually taken compared to the time<br />
that should have been taken.<br />
8. Computation of all variable cost variances uses the same calculus formula.<br />
9. The production volume variance is always zero.<br />
10. The fixed overhead efficiency variance is always zero.<br />
Answers to True/False Questions<br />
1. True. This is one of their most important functions. Budgets communicate goals and then act<br />
as benchmarks to measure progress towards those goals.<br />
2. False. An unfavorable variance decreases profits.<br />
3. True. Further investigation may uncover the cause of the variance, which may change the<br />
interpretation of the variance. Favorable versus unfavorable depends on whether expenses or<br />
revenues are being analyzed.<br />
4. True. If actual quantity is different; a new budget must be prepared.<br />
5. True. The comparison to the budget provides information needed for cost control.<br />
6. False. There is no necessary cause and effect relationship between the two variances.<br />
7. False. It is the labor efficiency variance that would reflect the difference in time.<br />
8. True. All variable costs behave in a similar fashion.<br />
9. False. The volume variance measures the difference between the budgeted fixed overhead and<br />
the fixed overhead applied. This may be zero, but usually isn't.<br />
10. True. Since fixed cost in any budget is always the same, the difference is always zero.<br />
20
Appendix: Capital Budgeting<br />
In determining which capital budgeting techniques are appropriate for a specific decision, it is<br />
helpful to review some basic characteristics of four often-used techniques. Three are cash basis<br />
techniques; one is an accrual basis technique.<br />
• Payback Period<br />
• Net Present Value<br />
• Accounting Rate of Return<br />
• Internal Rate of Return<br />
The payback period technique is probably the easier to use. It is simply a calculation in which<br />
cash used for the project is divided by future cash inflows. It is a faulty technique in that the time<br />
value of money is not considered.<br />
Net Present value is probably the most beneficial of the capital budgeting techniques. It involves<br />
using an imputed interest rate to discount future net cash inflow(s) to the present value. In order<br />
to use the technique, management must decide if the future cash flow(s) are a one-time only cash<br />
flow and/or if the cash flow is a series (annuity). Once the future cash flows have been<br />
discounted to the present value, they are compared to the initial cash outflow to determine if<br />
there is a positive net present value. If the net present value is negative, management should not<br />
automatically reject the project; rather, the imputed interest rate should be analyzed to determine<br />
if the rate used is realistic.<br />
The accounting rate of return is one with which most managers (and students) are most familiar.<br />
It involves the use of accrual basis net income as compared to the value of the asset investment.<br />
It normally does not consider the time value of money.<br />
The internal rate of return is used when future net cash flows are known, but the interest rate<br />
(cost of capital) has to be determined. A quick estimation of internal rate of return can be<br />
determined by use of present value tables provided in most accounting textbooks. Simply take a<br />
Southward direction down the relevant present value table to the time period appropriate to the<br />
decision. Follow the interest data columns in an Eastward direction. When the payback period<br />
(or close approximation) is located, follow that column in a Northward direction to the head of<br />
the column. The internal rate of return approximates the interest rate caption at the top of the<br />
column. If the payback period is located between two columns, use of algebraic interpolation can<br />
be used to determine a more exact value.<br />
Each of the four techniques provides value to any decision regarding long-term economic value.<br />
In an international environment, managers should use all assessment tools available.<br />
21


