Consolidated financial statements - Rolls-Royce
Consolidated financial statements - Rolls-Royce
Consolidated financial statements - Rolls-Royce

Create successful ePaper yourself
Turn your PDF publications into a flip-book with our unique Google optimized e-Paper software.
85<br />
Financial <strong>statements</strong><br />
Notes to the consolidated <strong>financial</strong> <strong>statements</strong><br />
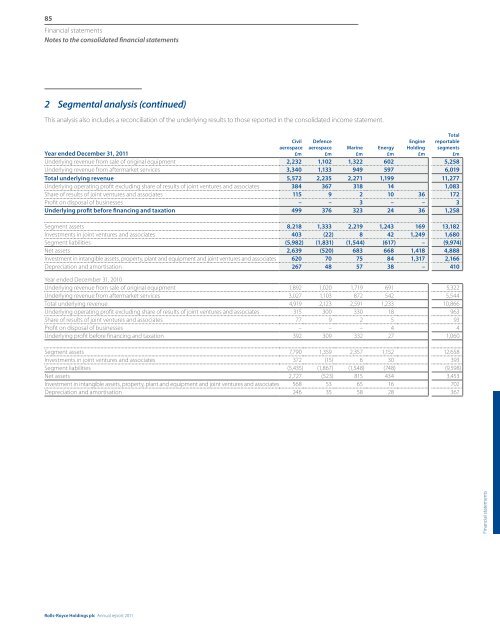
2 Segmental analysis (continued)<br />
This analysis also includes a reconciliation of the underlying results to those reported in the consolidated income statement.<br />
Civil<br />
aerospace<br />
£m<br />
Defence<br />
aerospace<br />
£m<br />
Marine<br />
£m<br />
Energy<br />
£m<br />
Engine<br />
Holding<br />
£m<br />
Total<br />
reportable<br />
segments<br />
£m<br />
Year ended December 31, 2011<br />
Underlying revenue from sale of original equipment 2,232 1,102 1,322 602 5,258<br />
Underlying revenue from aftermarket services 3,340 1,133 949 597 6,019<br />
Total underlying revenue 5,572 2,235 2,271 1,199 11,277<br />
Underlying operating profit excluding share of results of joint ventures and associates 384 367 318 14 1,083<br />
Share of results of joint ventures and associates 115 9 2 10 36 172<br />
Profit on disposal of businesses – – 3 – – 3<br />
Underlying profit before financing and taxation 499 376 323 24 36 1,258<br />
Segment assets 8,218 1,333 2,219 1,243 169 13,182<br />
Investments in joint ventures and associates 403 (22) 8 42 1,249 1,680<br />
Segment liabilities (5,982) (1,831) (1,544) (617) – (9,974)<br />
Net assets 2,639 (520) 683 668 1,418 4,888<br />
Investment in intangible assets, property, plant and equipment and joint ventures and associates 620 70 75 84 1,317 2,166<br />
Depreciation and amortisation 267 48 57 38 – 410<br />
Year ended December 31, 2010<br />
Underlying revenue from sale of original equipment 1,892 1,020 1,719 691 5,322<br />
Underlying revenue from aftermarket services 3,027 1,103 872 542 5,544<br />
Total underlying revenue 4,919 2,123 2,591 1,233 10,866<br />
Underlying operating profit excluding share of results of joint ventures and associates 315 300 330 18 963<br />
Share of results of joint ventures and associates 77 9 2 5 93<br />
Profit on disposal of businesses – – – 4 4<br />
Underlying profit before financing and taxation 392 309 332 27 1,060<br />
Segment assets 7,790 1,359 2,357 1,152 12,658<br />
Investments in joint ventures and associates 372 (15) 6 30 393<br />
Segment liabilities (5,435) (1,867) (1,548) (748) (9,598)<br />
Net assets 2,727 (523) 815 434 3,453<br />
Investment in intangible assets, property, plant and equipment and joint ventures and associates 568 53 65 16 702<br />
Depreciation and amortisation 246 35 58 28 367<br />
Financial <strong>statements</strong><br />
<strong>Rolls</strong>-<strong>Royce</strong> Holdings plc Annual report 2011