Innovation and Empowerment: SNU-Tulsa Research Journal
Innovation and Empowerment: SNU-Tulsa Research Journal
Innovation and Empowerment: SNU-Tulsa Research Journal

Create successful ePaper yourself
Turn your PDF publications into a flip-book with our unique Google optimized e-Paper software.
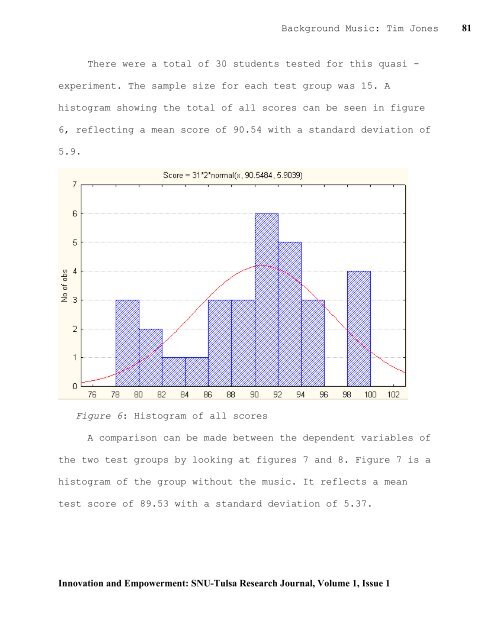
Background Music: Tim Jones 81<br />
There were a total of 30 students tested for this quasi -<br />
experiment. The sample size for each test group was 15. A<br />
histogram showing the total of all scores can be seen in figure<br />
6, reflecting a mean score of 90.54 with a st<strong>and</strong>ard deviation of<br />
5.9.<br />
Figure 6: Histogram of all scores<br />
A comparison can be made between the dependent variables of<br />
the two test groups by looking at figures 7 <strong>and</strong> 8. Figure 7 is a<br />
histogram of the group without the music. It reflects a mean<br />
test score of 89.53 with a st<strong>and</strong>ard deviation of 5.37.<br />
<strong>Innovation</strong> <strong>and</strong> <strong>Empowerment</strong>: <strong>SNU</strong>-<strong>Tulsa</strong> <strong>Research</strong> <strong>Journal</strong>, Volume 1, Issue 1