Image Steganography Scheme using Chaos and Fractals with ... - ijimt
Image Steganography Scheme using Chaos and Fractals with ... - ijimt
Image Steganography Scheme using Chaos and Fractals with ... - ijimt

Create successful ePaper yourself
Turn your PDF publications into a flip-book with our unique Google optimized e-Paper software.
International Journal of Innovation, Management <strong>and</strong> Technology, Vol. 3, No. 3, June 2012<br />
secret image; db # <strong>and</strong> db #<br />
C<br />
I<br />
refer the used Daubechies<br />
wavelets for the cover/stego image C/<br />
S <strong>and</strong> the secret<br />
image I respectively.<br />
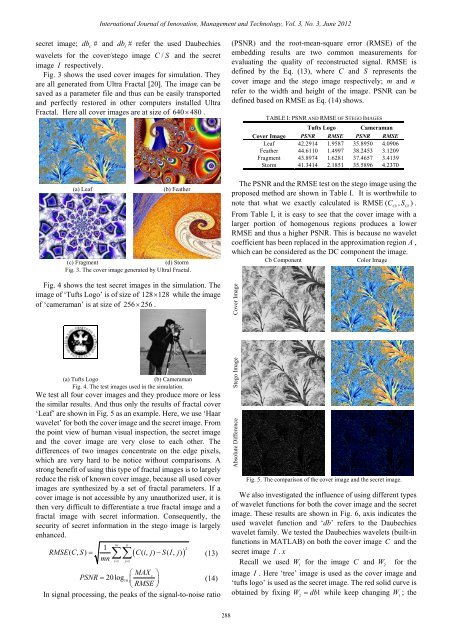
Fig. 3 shows the used cover images for simulation. They<br />
are all generated from Ultra Fractal [20]. The image can be<br />
saved as a parameter file <strong>and</strong> thus can be easily transported<br />
<strong>and</strong> perfectly restored in other computers installed Ultra<br />
Fractal. Here all cover images are at size of 640× 480 .<br />
(a) Leaf<br />
(b) Feather<br />
(c) Fragment<br />
(d) Storm<br />
Fig. 3. The cover image generated by Ultral Fractal.<br />
Fig. 4 shows the test secret images in the simulation. The<br />
image of ‘Tufts Logo’ is of size of 128× 128 while the image<br />
of ‘cameraman’ is at size of 256× 256 .<br />
(PSNR) <strong>and</strong> the root-mean-square error (RMSE) of the<br />
embedding results are two common measurements for<br />
evaluating the quality of reconstructed signal. RMSE is<br />
defined by the Eq. (13), where C <strong>and</strong> S represents the<br />
cover image <strong>and</strong> the stego image respectively; m <strong>and</strong> n<br />
refer to the width <strong>and</strong> height of the image. PSNR can be<br />
defined based on RMSE as Eq. (14) shows.<br />
TABLE I: PSNR AND RMSE OF STEGO IMAGES<br />
Tufts Logo Cameraman<br />
Cover <strong>Image</strong> PSNR RMSE PSNR RMSE<br />
Leaf 42.2914 1.9587 35.8950 4.0906<br />
Feather 44.6110 1.4997 38.2453 3.1209<br />
Fragment 43.8974 1.6281 37.4657 3.4139<br />
Storm 41.3414 2.1851 35.5896 4.2370<br />
The PSNR <strong>and</strong> the RMSE test on the stego image <strong>using</strong> the<br />
proposed method are shown in Table I. It is worthwhile to<br />
note that what we exactly calculated is RMSE ( C , S ).<br />
Cb Cb<br />
From Table I, it is easy to see that the cover image <strong>with</strong> a<br />
larger portion of homogenous regions produces a lower<br />
RMSE <strong>and</strong> thus a higher PSNR. This is because no wavelet<br />
coefficient has been replaced in the approximation region A ,<br />
which can be considered as the DC component the image.<br />
Cb Component<br />
Color <strong>Image</strong><br />
Cover <strong>Image</strong><br />
(a) Tufts Logo<br />
(b) Cameraman<br />
Fig. 4. The test images used in the simulation.<br />
We test all four cover images <strong>and</strong> they produce more or less<br />
the similar results. And thus only the results of fractal cover<br />
‘Leaf’ are shown in Fig. 5 as an example. Here, we use ‘Haar<br />
wavelet’ for both the cover image <strong>and</strong> the secret image. From<br />
the point view of human visual inspection, the secret image<br />
<strong>and</strong> the cover image are very close to each other. The<br />
differences of two images concentrate on the edge pixels,<br />
which are very hard to be notice <strong>with</strong>out comparisons. A<br />
strong benefit of <strong>using</strong> this type of fractal images is to largely<br />
reduce the risk of known cover image, because all used cover<br />
images are synthesized by a set of fractal parameters. If a<br />
cover image is not accessible by any unauthorized user, it is<br />
then very difficult to differentiate a true fractal image <strong>and</strong> a<br />
fractal image <strong>with</strong> secret information. Consequently, the<br />
security of secret information in the stego image is largely<br />
enhanced.<br />
m n<br />
1<br />
RMSE( C, S) = ∑∑ ( C( i, j) −S( I, j)<br />
) 2<br />
(13)<br />
mn<br />
i = 1 j = 1<br />
⎛ MAX<br />
PSNR 20log<br />
c ⎞<br />
= 10 ⎜<br />
RMSE<br />
⎟<br />
(14)<br />
⎝ ⎠<br />
In signal processing, the peaks of the signal-to-noise ratio<br />
Stego <strong>Image</strong><br />
Absolute Difference<br />
Fig. 5. The comparison of the cover image <strong>and</strong> the secret image.<br />
We also investigated the influence of <strong>using</strong> different types<br />
of wavelet functions for both the cover image <strong>and</strong> the secret<br />
image. These results are shown in Fig. 6, axis indicates the<br />
used wavelet function <strong>and</strong> ‘db’ refers to the Daubechies<br />
wavelet family. We tested the Daubechies wavelets (built-in<br />
functions in MATLAB) on both the cover image C <strong>and</strong> the<br />
secret image I . x<br />
Recall we used W 1<br />
for the image C <strong>and</strong> W for the<br />
2<br />
image I . Here ‘tree’ image is used as the cover image <strong>and</strong><br />
‘tufts logo’ is used as the secret image. The red solid curve is<br />
obtained by fixing W 2<br />
= db1<br />
while keep changing W 1<br />
; the<br />
288