NO BORDER
NO BORDER
NO BORDER

Create successful ePaper yourself
Turn your PDF publications into a flip-book with our unique Google optimized e-Paper software.
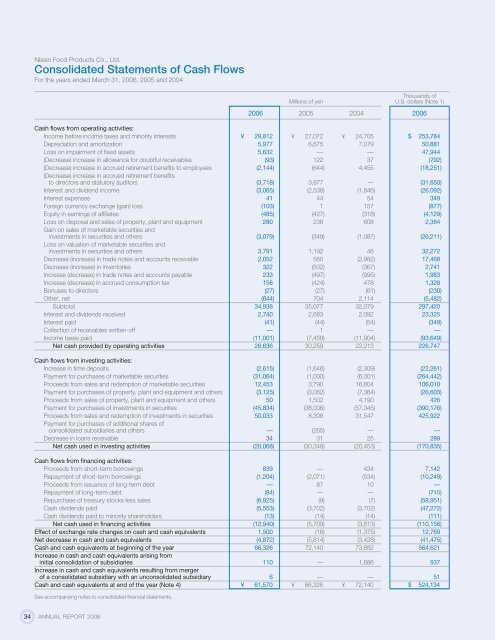
Nissin Food Products Co., Ltd.<br />
Consolidated Statements of Cash Flows<br />
For the years ended March 31, 2006, 2005 and 2004<br />
Thousands of<br />
Millions of yen U.S. dollars (Note 1)<br />
2006 2005 2004 2006<br />
Cash flows from operating activities:<br />
Income before income taxes and minority interests<br />
Depreciation and amortization<br />
Loss on impairment of fixed assets<br />
(Decrease) increase in allowance for doubtful receivables<br />
(Decrease) increase in accrued retirement benefits to employees<br />
(Decrease) increase in accrued retirement benefits<br />
to directors and statutory auditors<br />
Interest and dividend income<br />
Interest expenses<br />
Foreign currency exchange (gain) loss<br />
Equity in earnings of affiliates<br />
Loss on disposal and sales of property, plant and equipment<br />
Gain on sales of marketable securities and<br />
investments in securities and others<br />
Loss on valuation of marketable securities and<br />
investments in securities and others<br />
Decrease (increase) in trade notes and accounts receivable<br />
Decrease (increase) in inventories<br />
Increase (decrease) in trade notes and accounts payable<br />
Increase (decrease) in accrued consumption tax<br />
Bonuses to directors<br />
Other, net<br />
Subtotal<br />
Interest and dividends received<br />
Interest paid<br />
Collection of receivables written-off<br />
Income taxes paid<br />
Net cash provided by operating activities<br />
¥ 29,812<br />
5,977<br />
5,632<br />
(93)<br />
(2,144)<br />
(3,718)<br />
(3,065)<br />
41<br />
(103)<br />
(485)<br />
280<br />
(3,079)<br />
3,791<br />
2,052<br />
322<br />
233<br />
156<br />
(27)<br />
(644)<br />
34,938<br />
2,740<br />
(41)<br />
—<br />
(11,001)<br />
26,636<br />
¥ 27,072<br />
6,675<br />
—<br />
122<br />
(644)<br />
3,877<br />
(2,538)<br />
44<br />
1<br />
(427)<br />
238<br />
(349)<br />
1,192<br />
560<br />
(502)<br />
(497)<br />
(424)<br />
(27)<br />
704<br />
35,077<br />
2,683<br />
(44)<br />
1<br />
(7,458)<br />
30,259<br />
¥ 24,705<br />
7,079<br />
—<br />
37<br />
4,455<br />
—<br />
(1,846)<br />
54<br />
157<br />
(318)<br />
608<br />
(1,087)<br />
48<br />
(2,982)<br />
(367)<br />
(995)<br />
478<br />
(61)<br />
2,114<br />
32,079<br />
2,092<br />
(54)<br />
—<br />
(11,904)<br />
22,213<br />
$ 253,784<br />
50,881<br />
47,944<br />
(792)<br />
(18,251)<br />
(31,650)<br />
(26,092)<br />
349<br />
(877)<br />
(4,129)<br />
2,384<br />
(26,211)<br />
32,272<br />
17,468<br />
2,741<br />
1,983<br />
1,328<br />
(230)<br />
(5,482)<br />
297,420<br />
23,325<br />
(349)<br />
—<br />
(93,649)<br />
226,747<br />
Cash flows from investing activities:<br />
Increase in time deposits<br />
Payment for purchases of marketable securities<br />
Proceeds from sales and redemption of marketable securities<br />
Payment for purchases of property, plant and equipment and others<br />
Proceeds from sales of property, plant and equipment and others<br />
Payment for purchases of investments in securities<br />
Proceeds from sales and redemption of investments in securities<br />
Payment for purchases of additional shares of<br />
consolidated subsidiaries and others<br />
Decrease in loans receivable<br />
Net cash used in investing activities<br />
(2,615)<br />
(31,064)<br />
12,453<br />
(3,125)<br />
50<br />
(45,834)<br />
50,033<br />
—<br />
34<br />
(20,068)<br />
(1,646)<br />
(1,000)<br />
3,790<br />
(3,062)<br />
1,502<br />
(38,006)<br />
8,308<br />
(265)<br />
31<br />
(30,348)<br />
(2,309)<br />
(6,001)<br />
16,804<br />
(7,364)<br />
4,190<br />
(57,345)<br />
31,547<br />
—<br />
25<br />
(20,453)<br />
(22,261)<br />
(264,442)<br />
106,010<br />
(26,603)<br />
426<br />
(390,176)<br />
425,922<br />
—<br />
289<br />
(170,835)<br />
Cash flows from financing activities:<br />
Proceeds from short-term borrowings<br />
Repayment of short-term borrowings<br />
Proceeds from issuance of long-term debt<br />
Repayment of long-term debt<br />
Repurchase of treasury stocks less sales<br />
Cash dividends paid<br />
Cash dividends paid to minority shareholders<br />
Net cash used in financing activities<br />
Effect of exchange rate changes on cash and cash equivalents<br />
Net decrease in cash and cash equivalents<br />
Cash and cash equivalents at beginning of the year<br />
Increase in cash and cash equivalents arising from<br />
initial consolidation of subsidiaries<br />
Increase in cash and cash equivalents resulting from merger<br />
of a consolidated subsidiary with an unconsolidated subsidiary<br />
Cash and cash equivalents at end of the year (Note 4)<br />
839<br />
(1,204)<br />
—<br />
(84)<br />
(6,925)<br />
(5,553)<br />
(13)<br />
(12,940)<br />
1,500<br />
(4,872)<br />
66,326<br />
110<br />
6<br />
¥ 61,570<br />
—<br />
(2,071)<br />
87<br />
—<br />
(9)<br />
(3,702)<br />
(14)<br />
(5,709)<br />
(16)<br />
(5,814)<br />
72,140<br />
—<br />
—<br />
¥ 66,326<br />
434<br />
(534)<br />
10<br />
—<br />
(7)<br />
(3,702)<br />
(14)<br />
(3,813)<br />
(1,375)<br />
(3,428)<br />
73,882<br />
1,686<br />
—<br />
¥ 72,140<br />
7,142<br />
(10,249)<br />
—<br />
(715)<br />
(58,951)<br />
(47,272)<br />
(111)<br />
(110,156)<br />
12,769<br />
(41,475)<br />
564,621<br />
937<br />
51<br />
$ 524,134<br />
See accompanying notes to consolidated financial statements.<br />
34 ANNUAL REPORT 2006