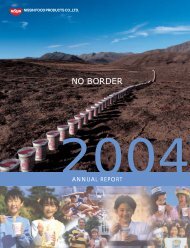
NO BORDER
NO BORDER
NO BORDER

You also want an ePaper? Increase the reach of your titles
YUMPU automatically turns print PDFs into web optimized ePapers that Google loves.
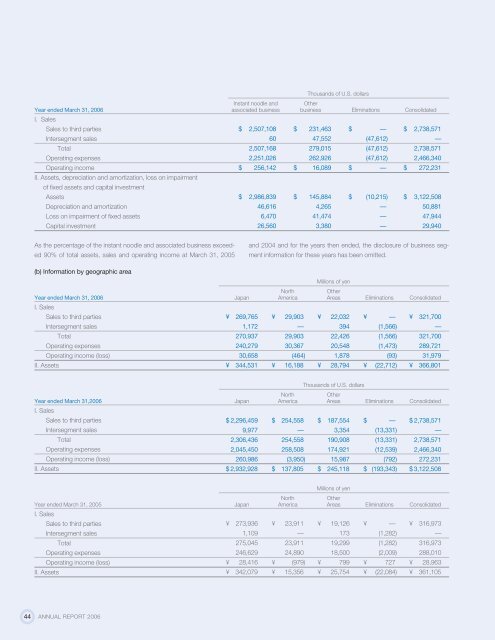
Thousands of U.S. dollars<br />
Instant noodle and Other<br />
Year ended March 31, 2006 associated business business Eliminations Consolidated<br />
I. Sales<br />
Sales to third parties<br />
Intersegment sales<br />
Total<br />
Operating expenses<br />
Operating income<br />
II. Assets, depreciation and amortization, loss on impairment<br />
of fixed assets and capital investment<br />
Assets<br />
Depreciation and amortization<br />
Loss on impairment of fixed assets<br />
Capital investment<br />
$<br />
$<br />
$<br />
2,507,108<br />
60<br />
2,507,168<br />
2,251,026<br />
256,142<br />
2,986,839<br />
46,616<br />
6,470<br />
26,560<br />
$<br />
$<br />
$<br />
231,463<br />
47,552<br />
279,015<br />
262,926<br />
16,089<br />
145,884<br />
4,265<br />
41,474<br />
3,380<br />
$<br />
$<br />
$<br />
—<br />
(47,612)<br />
(47,612)<br />
(47,612)<br />
—<br />
(10,215)<br />
—<br />
—<br />
—<br />
$<br />
$<br />
$<br />
2,738,571<br />
—<br />
2,738,571<br />
2,466,340<br />
272,231<br />
3,122,508<br />
50,881<br />
47,944<br />
29,940<br />
As the percentage of the instant noodle and associated business exceeded<br />
90% of total assets, sales and operating income at March 31, 2005<br />
and 2004 and for the years then ended, the disclosure of business segment<br />
information for these years has been omitted.<br />
(b) Information by geographic area<br />
Millions of yen<br />
North<br />
Other<br />
Year ended March 31, 2006 Japan America Areas Eliminations Consolidated<br />
I. Sales<br />
Sales to third parties<br />
Intersegment sales<br />
Total<br />
Operating expenses<br />
Operating income (loss)<br />
II. Assets<br />
¥<br />
¥<br />
269,765<br />
1,172<br />
270,937<br />
240,279<br />
30,658<br />
344,531<br />
¥<br />
¥<br />
29,903<br />
—<br />
29,903<br />
30,367<br />
(464)<br />
16,188<br />
¥<br />
¥<br />
22,032<br />
394<br />
22,426<br />
20,548<br />
1,878<br />
28,794<br />
¥<br />
¥<br />
—<br />
(1,566)<br />
(1,566)<br />
(1,473)<br />
(93)<br />
(22,712)<br />
¥<br />
¥<br />
321,700<br />
—<br />
321,700<br />
289,721<br />
31,979<br />
366,801<br />
Thousands of U.S. dollars<br />
North<br />
Other<br />
Year ended March 31,2006 Japan America Areas Eliminations Consolidated<br />
I. Sales<br />
Sales to third parties<br />
Intersegment sales<br />
Total<br />
Operating expenses<br />
Operating income (loss)<br />
$ 2,296,459<br />
9,977<br />
2,306,436<br />
2,045,450<br />
260,986<br />
$ 254,558<br />
—<br />
254,558<br />
258,508<br />
(3,950)<br />
$ 187,554<br />
3,354<br />
190,908<br />
174,921<br />
15,987<br />
$ —<br />
(13,331)<br />
(13,331)<br />
(12,539)<br />
(792)<br />
$ 2,738,571<br />
—<br />
2,738,571<br />
2,466,340<br />
272,231<br />
II. Assets<br />
$ 2,932,928 $ 137,805 $ 245,118 $ (193,343) $ 3,122,508<br />
Millions of yen<br />
North<br />
Other<br />
Year ended March 31, 2005 Japan America Areas Eliminations Consolidated<br />
I. Sales<br />
Sales to third parties<br />
Intersegment sales<br />
Total<br />
Operating expenses<br />
Operating income (loss)<br />
II. Assets<br />
¥<br />
¥<br />
¥<br />
273,936<br />
1,109<br />
275,045<br />
246,629<br />
28,416<br />
342,079<br />
¥<br />
¥<br />
¥<br />
23,911<br />
—<br />
23,911<br />
24,890<br />
(979)<br />
15,356<br />
¥<br />
¥<br />
¥<br />
19,126<br />
173<br />
19,299<br />
18,500<br />
799<br />
25,754<br />
¥<br />
¥<br />
¥<br />
—<br />
(1,282)<br />
(1,282)<br />
(2,009)<br />
727<br />
(22,084)<br />
¥<br />
¥<br />
¥<br />
316,973<br />
—<br />
316,973<br />
288,010<br />
28,963<br />
361,105<br />
44 ANNUAL REPORT 2006