NO BORDER
NO BORDER
NO BORDER

Create successful ePaper yourself
Turn your PDF publications into a flip-book with our unique Google optimized e-Paper software.
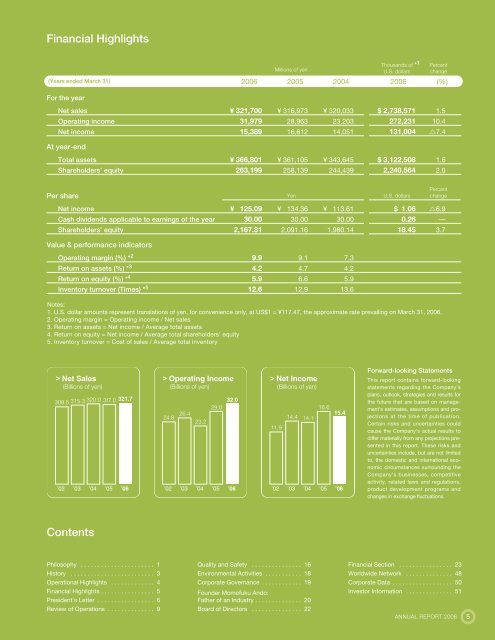
Financial Highlights<br />
(Years ended March 31) 2006 2005 2004 2006 (%)<br />
For the year<br />
Net sales ¥ 321,700 ¥ 316,973 ¥ 320,033 $ 2,738,571 1.5<br />
Operating income 31,979 28,963 23,203 272,231 10.4<br />
Net income 15,389 16,612 14,051 131,004 7.4<br />
At year-end<br />
Millions of yen<br />
Thousands of<br />
U.S. dollars<br />
Total assets ¥ 366,801 ¥ 361,105 ¥ 343,645 $ 3,122,508 1.6<br />
Shareholders’ equity 263,199 258,139 244,439 2,240,564 2.0<br />
* 1<br />
Percent<br />
change<br />
Per share<br />
Yen<br />
U.S. dollars<br />
Percent<br />
change<br />
Net income ¥ 125.09 ¥ 134.36 ¥ 113.61 $ 1.06 6.9<br />
Cash dividends applicable to earnings of the year 30.00 30.00 30.00 0.26 —<br />
Shareholders’ equity 2,167.81 2,091.16 1,980.14 18.45 3.7<br />
Value & performance indicators<br />
Operating margin (%) * 2 9.9 9.1 7.3<br />
Return on assets (%) * 3 4.2 4.7 4.2<br />
Return on equity (%) * 4 5.9 6.6 5.9<br />
Inventory turnover (Times) * 5 12.6 12.9 13.6<br />
Notes:<br />
1. U.S. dollar amounts represent translations of yen, for convenience only, at US$1 = ¥117.47, the approximate rate prevailing on March 31, 2006.<br />
2. Operating margin = Operating income / Net sales<br />
3. Return on assets = Net income / Average total assets<br />
4. Return on equity = Net income / Average total shareholders’ equity<br />
5. Inventory turnover = Cost of sales / Average total inventory<br />
> Net Sales<br />
(Billions of yen)<br />
Operating Income<br />
(Billions of yen)<br />
308.5 315.3 320.0 317.0 321.7 32.0<br />
29.0<br />
24.8 26.4 23.2<br />
’02 ’03 ’04 ’05 ’06<br />
’02 ’03 ’04 ’05 ’06<br />
><br />
><br />
Net Income<br />
(Billions of yen)<br />
11.9<br />
14.4 14.1<br />
16.6<br />
15.4<br />
’02 ’03 ’04 ’05 ’06<br />
Forward-looking Statements<br />
This report contains forward-looking<br />
statements regarding the Company’s<br />
plans, outlook, strategies and results for<br />
the future that are based on management's<br />
estimates, assumptions and projections<br />
at the time of publication.<br />
Certain risks and uncertainties could<br />
cause the Company’s actual results to<br />
differ materially from any projections presented<br />
in this report. These risks and<br />
uncertainties include, but are not limited<br />
to, the domestic and international economic<br />
circumstances surrounding the<br />
Company’s businesses, competitive<br />
activity, related laws and regulations,<br />
product development programs and<br />
changes in exchange fluctuations.<br />
Contents<br />
Philosophy . . . . . . . . . . . . . . . . . . . . . . 1<br />
History . . . . . . . . . . . . . . . . . . . . . . . . . 3<br />
Operational Highlights . . . . . . . . . . . . . 4<br />
Financial Highlights . . . . . . . . . . . . . . . . 5<br />
President’s Letter . . . . . . . . . . . . . . . . . 6<br />
Review of Operations . . . . . . . . . . . . . . 9<br />
Quality and Safety . . . . . . . . . . . . . . . 16<br />
Environmental Activities . . . . . . . . . . . 18<br />
Corporate Governance . . . . . . . . . . . . 19<br />
Founder Momofuku Ando:<br />
Father of an Industry . . . . . . . . . . . . . . 20<br />
Board of Directors . . . . . . . . . . . . . . . 22<br />
Financial Section . . . . . . . . . . . . . . . . 23<br />
Worldwide Network . . . . . . . . . . . . . . 48<br />
Corporate Data . . . . . . . . . . . . . . . . . . 50<br />
Investor Information . . . . . . . . . . . . . . 51<br />
ANNUAL REPORT 2006<br />
5