"Operation and performance of the NESTOR test detector" Nucl.Instr ...
"Operation and performance of the NESTOR test detector" Nucl.Instr ...
"Operation and performance of the NESTOR test detector" Nucl.Instr ...

Create successful ePaper yourself
Turn your PDF publications into a flip-book with our unique Google optimized e-Paper software.
ARTICLE IN PRESS<br />
G. Aggouras et al. / <strong>Nucl</strong>ear <strong>Instr</strong>uments <strong>and</strong> Methods in Physics Research A 552 (2005) 420–439 425<br />
taking to check <strong>the</strong> integrity <strong>of</strong> <strong>the</strong> data <strong>and</strong><br />
ensure that <strong>the</strong> selection trigger is unbiased. It<br />
complements <strong>the</strong> Fast Monitor by performing<br />
detailed signal processing (as described in<br />
Section 4) <strong>and</strong> provides additional information<br />
on <strong>the</strong> <strong>performance</strong> <strong>of</strong> <strong>the</strong> pmts, <strong>the</strong><br />
triggering, digitization <strong>and</strong> readout electronics.<br />
This includes <strong>the</strong> stability 3 <strong>of</strong>, <strong>the</strong> pmt<br />
pulse height distributions, <strong>the</strong> ATWD gain<br />
<strong>and</strong> sampling interval, <strong>the</strong> majority coincidence<br />
rate <strong>and</strong> <strong>the</strong> distribution <strong>of</strong> <strong>the</strong> total<br />
number <strong>of</strong> photoelectrons inside <strong>the</strong> trigger<br />
window. Fur<strong>the</strong>rmore, it checks <strong>the</strong> trigger<br />
formation <strong>and</strong> timing with respect to <strong>the</strong><br />
digitized pmt pulses <strong>and</strong> <strong>the</strong> dependence <strong>of</strong> <strong>the</strong><br />
total number <strong>of</strong> accumulated photoelectrons<br />
inside <strong>the</strong> coincidence window 4 to <strong>the</strong> coincidence<br />
level. The subsystem provides a fast<br />
track, ‘on-line’ reconstruction on <strong>the</strong> hypo<strong>the</strong>sis<br />
that <strong>the</strong> data corresponds to muons<br />
passing through <strong>the</strong> fiducial volume <strong>of</strong> <strong>the</strong><br />
detector.<br />
4. Detector calibration <strong>and</strong> signal processing<br />
t d ¼ 250 ns, Z ¼ 75 O, rise time r t ¼ 12 ns). In<br />
order to reconstruct <strong>the</strong> original pmt pulse properties,<br />
<strong>the</strong> digitized waveforms must be corrected.<br />
This correction has an important effect on <strong>the</strong><br />
estimation <strong>of</strong> arrival time <strong>of</strong> <strong>the</strong> pmt pulse <strong>and</strong><br />
consequently on <strong>the</strong> tracking accuracy (e.g. muon<br />
direction resolution) <strong>of</strong> <strong>the</strong> detector.<br />
Each individual pmt transmission line, including<br />
<strong>the</strong> cable from <strong>the</strong> pmt to <strong>the</strong> Floor Board <strong>and</strong> all<br />
corresponding passive <strong>and</strong> active electronic elements<br />
upto <strong>the</strong> ATWD, has been calibrated <strong>and</strong><br />
<strong>the</strong> signal attenuation measured in <strong>the</strong> laboratory<br />
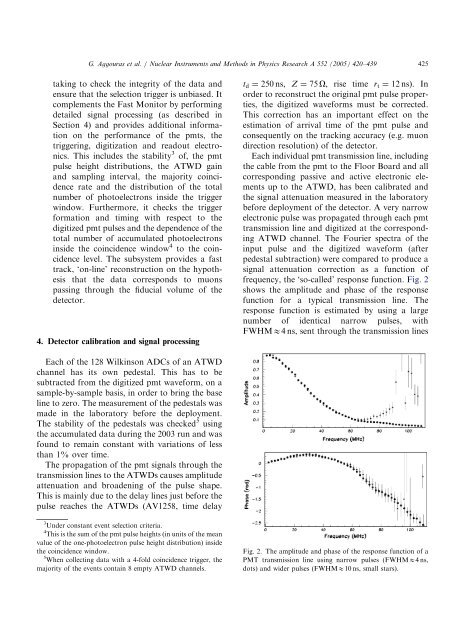
before deployment <strong>of</strong> <strong>the</strong> detector. A very narrow<br />
electronic pulse was propagated through each pmt<br />
transmission line <strong>and</strong> digitized at <strong>the</strong> corresponding<br />
ATWD channel. The Fourier spectra <strong>of</strong> <strong>the</strong><br />
input pulse <strong>and</strong> <strong>the</strong> digitized waveform (after<br />
pedestal subtraction) were compared to produce a<br />
signal attenuation correction as a function <strong>of</strong><br />
frequency, <strong>the</strong> ‘so-called’ response function. Fig. 2<br />
shows <strong>the</strong> amplitude <strong>and</strong> phase <strong>of</strong> <strong>the</strong> response<br />
function for a typical transmission line. The<br />
response function is estimated by using a large<br />
number <strong>of</strong> identical narrow pulses, with<br />
FWHME4 ns, sent through <strong>the</strong> transmission lines<br />
Each <strong>of</strong> <strong>the</strong> 128 Wilkinson ADCs <strong>of</strong> an ATWD<br />
channel has its own pedestal. This has to be<br />
subtracted from <strong>the</strong> digitized pmt waveform, on a<br />
sample-by-sample basis, in order to bring <strong>the</strong> base<br />
line to zero. The measurement <strong>of</strong> <strong>the</strong> pedestals was<br />
made in <strong>the</strong> laboratory before <strong>the</strong> deployment.<br />
The stability <strong>of</strong> <strong>the</strong> pedestals was checked 5 using<br />
<strong>the</strong> accumulated data during <strong>the</strong> 2003 run <strong>and</strong> was<br />
found to remain constant with variations <strong>of</strong> less<br />
than 1% over time.<br />
The propagation <strong>of</strong> <strong>the</strong> pmt signals through <strong>the</strong><br />
transmission lines to <strong>the</strong> ATWDs causes amplitude<br />
attenuation <strong>and</strong> broadening <strong>of</strong> <strong>the</strong> pulse shape.<br />
This is mainly due to <strong>the</strong> delay lines just before <strong>the</strong><br />
pulse reaches <strong>the</strong> ATWDs (AV1258, time delay<br />
3 Under constant event selection criteria.<br />
4 This is <strong>the</strong> sum <strong>of</strong> <strong>the</strong> pmt pulse heights (in units <strong>of</strong> <strong>the</strong> mean<br />
value <strong>of</strong> <strong>the</strong> one-photoelectron pulse height distribution) inside<br />
<strong>the</strong> coincidence window.<br />
5 When collecting data with a 4-fold coincidence trigger, <strong>the</strong><br />
majority <strong>of</strong> <strong>the</strong> events contain 8 empty ATWD channels.<br />
Fig. 2. The amplitude <strong>and</strong> phase <strong>of</strong> <strong>the</strong> response function <strong>of</strong> a<br />
PMT transmission line using narrow pulses (FWHME4 ns,<br />
dots) <strong>and</strong> wider pulses (FWHME10 ns, small stars).