Picosecond lifetime measurements in 109Cd and 110Cd
Picosecond lifetime measurements in 109Cd and 110Cd
Picosecond lifetime measurements in 109Cd and 110Cd

You also want an ePaper? Increase the reach of your titles
YUMPU automatically turns print PDFs into web optimized ePapers that Google loves.
Nuclear Physics A 683 (2001) 157–181<br />
www.elsevier.nl/locate/npe<br />
<strong>Picosecond</strong> <strong>lifetime</strong> <strong>measurements</strong> <strong>in</strong> 109 Cd<br />
<strong>and</strong> 110 Cd<br />
S. Harissopulos a,∗ , A.Dewald b ,A.Gelberg b ,K.O.Zell b ,<br />
P. von Brentano b ,J.Kern c<br />
a Institute of Nuclear Physics, N.C.S.R. “Demokritos”, POB 60228, GR-15310 Aghia Paraskevi, Athens, Greece<br />
b Institut für Kernphysik, Universität zu Köln, D-50937 Cologne, Germany<br />
c Physics Department, University, CH-1700 Fribourg, Switzerl<strong>and</strong><br />
Received 30 May 2000; revised 13 September 2000; accepted 26 September 2000<br />
Abstract<br />
Mean <strong>lifetime</strong>s of the lowest 6 yrast b<strong>and</strong> members <strong>in</strong> 110 Cd <strong>and</strong> of 9 excited states <strong>in</strong> 109 Cd,<br />
populated via the 100 Mo( 13 C, 3n/4n) reactions, have been measured us<strong>in</strong>g the Recoil Distance<br />
Doppler Shift technique (RDDS). The data have been analyzed us<strong>in</strong>g the Differential Decay Curve<br />
Method (DDCM). The E2 transition probabilities deduced from the data for the ground b<strong>and</strong> of<br />
110 Cd are <strong>in</strong> rather good agreement with the predictions of the U(5)-limit of the Interact<strong>in</strong>g Boson<br />
Model-1 (IBM-1). © 2001 Elsevier Science B.V. All rights reserved.<br />
PACS: 27.60.+j; 21.10.Tg; 21.60.Ev<br />
Keywords: NUCLEAR REACTIONS 100 Mo( 13 C, 3n/4n), E( 13 C) = 50 MeV, measured I γ , 109,110 Cd levels<br />
deduced mean <strong>lifetime</strong>s τ <strong>and</strong> B(E2) values; Enriched target, Ge detectors, differential decay-curve analysis,<br />
recoil distance Doppler-shift method; Comparison to theoretical predictions of <strong>in</strong>trab<strong>and</strong> E2 transition strengths<br />
1. Introduction<br />
Gamma-ray spectroscopic studies have established for many cadmium nuclei spectra of<br />
excited levels with very <strong>in</strong>terest<strong>in</strong>g features. These features can be summarized ma<strong>in</strong>ly <strong>in</strong><br />
two po<strong>in</strong>ts.<br />
Firstly, <strong>in</strong> almost every even even cadmium nucleus, a two-phonon triplet of states<br />
with sp<strong>in</strong> J = 0, 2, 4 has been found <strong>in</strong> the lowest part of their level scheme. These<br />
f<strong>in</strong>d<strong>in</strong>gs have been the ma<strong>in</strong> argument for assign<strong>in</strong>g a vibrational character to these<br />
nuclei. Among them the nucleus 110 Cd has been characterized by Arima <strong>and</strong> Iachello [1],<br />
as one of the best examples of nuclei resembl<strong>in</strong>g the U(5) symmetry of IBA-1. This<br />
∗ Correspond<strong>in</strong>g author. Tel.: +3016503493, Fax: +3016511215.<br />
E-mail address: sharisop@mail.demokritos.gr (S. Harissopulos).<br />
0375-9474/01/$ – see front matter © 2001 Elsevier Science B.V. All rights reserved.<br />
PII: S0375-9474(00)00473-5
158 S. Harissopulos et al. / Nuclear Physics A 683 (2001) 157–181<br />
assignment was based ma<strong>in</strong>ly on the excitation energies <strong>and</strong> branch<strong>in</strong>g ratios of the lowly<strong>in</strong>g<br />
collective states of 110 Cd. The U(5) properties of 110 Cd have been further discussed<br />
by Kern et al. [2]. The “good” vibrational character of the even even cadmium nuclei has<br />
been additionally supported by previous Coulomb excitation <strong>measurements</strong> [3–5]. Recent<br />
studies <strong>in</strong> 108,110,112 Cd nuclei [6–9], <strong>in</strong> which the respective level schemes have been<br />
extended to higher energies, have shown that their level spectra exhibit properties not only<br />
of a quadrupole vibrator but also of a rotat<strong>in</strong>g deformed nucleus s<strong>in</strong>ce sharp backbend<strong>in</strong>g<br />
patterns have been observed to occur <strong>in</strong> some of their excited b<strong>and</strong>s. These backbend<strong>in</strong>gs<br />
<strong>in</strong>dicate drastic structural changes along the yrast l<strong>in</strong>e of these nuclei, which could be<br />
elucidated via <strong>lifetime</strong> <strong>measurements</strong>.<br />
Secondly, <strong>in</strong> the odd-neutron 105,107,109 Cd isotopes Stromswold et al. [10] have observed<br />
a strongly populated b<strong>and</strong> consist<strong>in</strong>g of I = 2 transitions built upon a 11/2 − state. Such<br />
a b<strong>and</strong> has been identified also <strong>in</strong> 111 Cd by Juut<strong>in</strong>en et al. [11]. Via the latter work the<br />
level scheme of 109 Cd has been considerably improved. By extend<strong>in</strong>g the b<strong>and</strong> built upon<br />
the considered 11/2 − state to higher energies a sharp backbend has been revealed. The<br />
members of the considered b<strong>and</strong>s <strong>in</strong> 105,107,109 Cd have been <strong>in</strong>terpreted <strong>in</strong> [10] to arise<br />
from rotation–alignment coupl<strong>in</strong>g (RAC) [12] of one-quasiparticle to the even rotat<strong>in</strong>g<br />
core states. However, Häusser et al. [13] have measured the mean <strong>lifetime</strong> of the respective<br />
15/2 − state <strong>in</strong> 107 Cd <strong>and</strong> the result<strong>in</strong>g reduced transition probability B(E2; 15/2 − →<br />
11/2 − ) has been found to deviate from the correspond<strong>in</strong>g RAC value, be<strong>in</strong>g further<br />
<strong>in</strong> very good agreement with the predictions of the so-called PVC model [14], i.e. the<br />
model describ<strong>in</strong>g the coupl<strong>in</strong>g of quas<strong>in</strong>eutron states to an anharmonically vibrat<strong>in</strong>g core.<br />
Hereby, it has to be po<strong>in</strong>ted out that the latter predictions-check is based on a s<strong>in</strong>gle<br />
experimental value. Hence, it would be very useful to measure the B(E2) values of the<br />
rest of the I = 2 γ -transitions of the b<strong>and</strong> <strong>in</strong> consideration <strong>and</strong> further derive systematic<br />
<strong>in</strong>formation concern<strong>in</strong>g the mean <strong>lifetime</strong>s of the similar excited states identified <strong>in</strong> other<br />
odd-neutron isotopes such as 109 Cd.<br />
The above mentioned features of the cadmium nuclei have motivated us to carry out<br />
the present <strong>lifetime</strong> <strong>measurements</strong> <strong>in</strong> 109 Cd <strong>and</strong> 110 Cd nuclei, us<strong>in</strong>g the Recoil Distance<br />
Doppler-shift method (RDDS) [15]. In 109 Cd the ma<strong>in</strong> goal was to measure mean <strong>lifetime</strong>s<br />
<strong>in</strong> the b<strong>and</strong> built upon the first 11/2 − state, whereas our aim <strong>in</strong> choos<strong>in</strong>g 110 Cd is to follow<br />
the evolution of the B(E2) values along its yrast l<strong>in</strong>e <strong>in</strong> order to test further the predictions<br />
of the U(5) limit of IBA-1 <strong>in</strong> terms of transition probabilities.<br />
2. Experiments<br />
In the present work two <strong>in</strong>dependent experiments, namely a <strong>lifetime</strong> measurement<br />
(RDDS) <strong>and</strong> an “<strong>in</strong>tensity measurement”, have been carried out at the FN Van de Graaff<br />
T<strong>and</strong>em accelerator at the University of Cologne. In both <strong>measurements</strong> the respective<br />
targets have been bombarded by a 13 C beam hav<strong>in</strong>g an <strong>in</strong>cident energy of 50 MeV. At<br />
this energy, excited states <strong>in</strong> 110 Cd as well as <strong>in</strong> 109 Cd nucleus have been populated via<br />
the 100 Mo( 13 C, 3n) <strong>and</strong> 100 Mo( 13 C, 4n) reactions, respectively. The <strong>in</strong>tensity ratio of the
S. Harissopulos et al. / Nuclear Physics A 683 (2001) 157–181 159<br />
204 keV γ -ray (5/2 + → 3/2 + )of 109 Cd to the 658 keV γ -transition (2 + 1 → 0+ 1 )of110 Cd<br />
was found equal to 4.2(2), i.e. the 4n-channel was the dom<strong>in</strong>at<strong>in</strong>g reaction channel.<br />
In the RDDS experiment, γ -s<strong>in</strong>gles spectra have been measured at different target-tostopper<br />
distances by means of three Ge detectors, each hav<strong>in</strong>g a relative efficiency of<br />
about 18%. The detectors were positioned at angles of 0 ◦ ,55 ◦ <strong>and</strong> 160 ◦ with respect<br />
to the beam axis. The distance between target <strong>and</strong> each detector was about 15 cm. The<br />
energy resolution of the detectors was about 2 keV for the 1408 keV γ -rays of an<br />
152 Eu-source. The count<strong>in</strong>g rate was about 5, 7 <strong>and</strong> 8 kHz for the detector at 160 ◦ ,0 ◦<br />
<strong>and</strong> 55 ◦ , respectively. The plunger apparatus used <strong>in</strong> the RDDS <strong>measurements</strong> is described<br />
<strong>in</strong> [16]. In order to determ<strong>in</strong>e the absolute values of the target-to-stopper distances, <strong>and</strong><br />
further monitor their stability, the capacitance method [17] was used dur<strong>in</strong>g the experiment.<br />
Gamma-ray s<strong>in</strong>gles spectra were taken at 24 target-to-stopper distances d <strong>in</strong> the range<br />
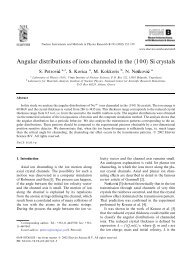
2.9 µm-8 mm. Fig. 1 shows three different γ -s<strong>in</strong>gles spectra taken with the detector<br />
positioned at 0 ◦ at distances of (a) d = 6.1 µm, (b) d = 73.9 µm<strong>and</strong>(c)d = 8 mm. Hereby,<br />
the Doppler-shifted <strong>and</strong> unshifted components of γ -transitions <strong>in</strong> the yrast l<strong>in</strong>e of 110 Cd<br />
are labeled with the letters s <strong>and</strong> u, respectively. Numbers <strong>in</strong> parenthesis <strong>in</strong>dicate the energy<br />
<strong>in</strong> keV of the Doppler unshifted components of some γ -rays depopulat<strong>in</strong>g excited states<br />
<strong>in</strong> 109 Cd nucleus, whereas the numbers 633 <strong>and</strong> 876 are the energies <strong>in</strong> keV of the 2 + 1 →<br />
0 + 1 <strong>and</strong> 4+ 1 → 2+ 1 γ -transitions of 108 Cd nucleus which is also produced due to a small<br />
admixture of 98 Mo <strong>in</strong> the target. Peaks <strong>in</strong>dicated as [x] are ma<strong>in</strong>ly γ -rays due to activation.<br />
Fig. 1. Gamma-s<strong>in</strong>gles spectra measured at different plunger distances d with the Ge detector placed<br />
at 0 ◦ with respect to the beam axis (see text).
160 S. Harissopulos et al. / Nuclear Physics A 683 (2001) 157–181<br />
Table 1<br />
Experimental details of the present RDDS <strong>and</strong> <strong>in</strong>tensity <strong>measurements</strong><br />
Experiments Target Back<strong>in</strong>g Stopper Beam stopper<br />
RDDS 0.6 mg/cm 2 thick 2 mg/cm 2 thick 40 mg/cm 2 thick<br />
self support<strong>in</strong>g Ta foil Ta foil<br />
100 Mo foil<br />
Enrichment: 98%<br />
Intensity 0.6 mg/cm 2 thick 4.3 mg/cm 2 thick 93 mg/cm 2 thick<br />
measurement 100 Mo foil rolled on Au foil Bi foil<br />
Au back<strong>in</strong>g<br />
Enrichment: 98%<br />
In the “<strong>in</strong>tensity measurement”, γ -s<strong>in</strong>gles spectra were taken by means of one Ge<br />
detector placed at 55 ◦ with respect to the beam axis, <strong>in</strong> order to determ<strong>in</strong>e the relative<br />
<strong>in</strong>tensities of the γ -rays deexcit<strong>in</strong>g the levels of <strong>in</strong>terest. Details on the targets, stoppers<br />
<strong>and</strong> beam stoppers used <strong>in</strong> both experiments are given <strong>in</strong> Table 1.<br />
3. Data analysis<br />
The data have been analysed accord<strong>in</strong>g to the so-called Differential Decay-Curve<br />
Method (DDCM), which has been proposed [18] for determ<strong>in</strong><strong>in</strong>g mean <strong>lifetime</strong>s from<br />
plunger data. DDCM has been further extended <strong>in</strong> [19] so as to be applicable also<br />
to Doppler-Shift Attenuation Method (DSAM) [15] <strong>measurements</strong>. Hence, DDCM has<br />
been proved to be a general <strong>and</strong> a reliable method of analysis of Doppler-shift tim<strong>in</strong>g<br />
experiments. As DDCM is discussed <strong>in</strong> details elsewhere [18,19], <strong>in</strong> the present paper<br />
only the last step of this method is outl<strong>in</strong>ed.<br />
Accord<strong>in</strong>g to DDCM, one can determ<strong>in</strong>e at every target-to-stopper distance x a mean<br />
<strong>lifetime</strong> τ for the excited state of <strong>in</strong>terest, by us<strong>in</strong>g the follow<strong>in</strong>g equation:<br />
[<br />
( ∑<br />
τ(x)=− Q ij (x) − b ij<br />
h<br />
(<br />
Ihi<br />
I ij<br />
)<br />
Q hi (x)<br />
)]/[<br />
v · dQ ij (x)<br />
dx<br />
]<br />
. (1)<br />
In order to underst<strong>and</strong> the quantities used <strong>in</strong> Eq. (1), the schematic decay pattern shown<br />
<strong>in</strong> Fig. 2 is necessary. Hereby, a level L i is fed from levels L h by γ -transitions noted here<br />
as (L h → L i ). Level L i is further deexcited to levels L j via the γ -transitions (L i → L j ).<br />
Hence, Q ij (x) <strong>and</strong> Q hi (x) are the experimental decay curves of the depopulat<strong>in</strong>g<br />
transitions (L i → L j ) <strong>and</strong> the populat<strong>in</strong>g transitions (L h → L i ), respectively. The quantity<br />
b ij is the branch<strong>in</strong>g ratio of the transition (L i → L j ) <strong>in</strong> consideration <strong>and</strong> v is the mean<br />
velocity of the recoil<strong>in</strong>g nuclei. Furthermore, I hi <strong>and</strong> I ij are the <strong>in</strong>tensities measured at 55 ◦ ,<br />
i.e. <strong>in</strong> an <strong>in</strong>tensity measurement, for the respective γ -rays (L h → L i )<strong>and</strong>(L i → L j ). The<br />
quantity dQ ij (x)/dx is the first derivative of the experimental decay curve Q ij (x).Eq.(1)<br />
holds only when the decay curve Q ij (x) is def<strong>in</strong>ed as:
S. Harissopulos et al. / Nuclear Physics A 683 (2001) 157–181 161<br />
Q ij (x) =<br />
Fig. 2. Schematic decay pattern of an excited nucleus.<br />
U ij (x)<br />
U ij (x) + S ij (x) , (2)<br />
where U ij (x) <strong>and</strong> S ij (x) are the <strong>in</strong>tensities of the Doppler-unshifted <strong>and</strong> Doppler-shifted<br />
components of the γ -transition (L i → L j ), respectively. These components are often<br />
called “stop” <strong>and</strong> “flight” peak, respectively.<br />
The <strong>in</strong>tensities I hi <strong>and</strong> I ij as well as the branch<strong>in</strong>g ratios b ij <strong>in</strong>volved <strong>in</strong> the analysis<br />
(see Eq. (1)) have been determ<strong>in</strong>ed <strong>in</strong> the <strong>in</strong>tensity measurement mentioned above. The<br />
RDDS γ -s<strong>in</strong>gles spectra accumulated here were normalized to the <strong>in</strong>tensity of the 260 keV<br />
γ -ray of 109 Cd nucleus. The latter transition depopulates a very long lived 11 − /2isomeric<br />
state with T 1/2 = 8 µs [20]. The <strong>in</strong>tensities U ij (x) <strong>and</strong> S ij (x) used <strong>in</strong> Eq. (2) have<br />
been determ<strong>in</strong>ed from “difference spectra” accord<strong>in</strong>g to the procedure described <strong>in</strong> [21].<br />
“Difference spectra” have been obta<strong>in</strong>ed by subtract<strong>in</strong>g each normalized spectrum i taken<br />
at a distance d i from the properly normalized spectrum measured at the maximum targetto-stopper<br />
distance d max . This subtraction leads to a smooth background over a wide energy<br />
range <strong>in</strong> the result<strong>in</strong>g spectrum. The <strong>in</strong>tensity of the rema<strong>in</strong><strong>in</strong>g Doppler-shifted S ij (x) <strong>and</strong><br />
unshifted U ij (x) γ -rays have been simultaneously analysed <strong>in</strong> the difference spectra by<br />
us<strong>in</strong>g the code LEONE [16,22]. The method of “difference spectra” simplifies considerably<br />
the data analysis not only due to the result<strong>in</strong>g flat background but also because it enables to<br />
detect contam<strong>in</strong>at<strong>in</strong>g l<strong>in</strong>es by means of careful <strong>in</strong>vestigation of the (negative) stop peak <strong>and</strong><br />
the correspond<strong>in</strong>g (positive) flight peak. Furthermore, the use of “difference spectra” has<br />
the advantage of elim<strong>in</strong>at<strong>in</strong>g possible contributions <strong>in</strong> the stop peak <strong>in</strong>tensities aris<strong>in</strong>g from<br />
the fraction of the excited nuclei that decay already <strong>in</strong> the target. The determ<strong>in</strong>ation of this<br />
fraction is not a straightforward task. However, this effect can be checked by look<strong>in</strong>g at the<br />
spectra taken <strong>in</strong> large plunger distances for nonvanish<strong>in</strong>g stop peaks of fast γ -transitions. In<br />
case the fraction of the excited nuclei that decay already <strong>in</strong> the target is negligible, the stop<br />
peaks of the γ -transition deexcit<strong>in</strong>g very short lived levels (τ
162 S. Harissopulos et al. / Nuclear Physics A 683 (2001) 157–181<br />
a v/c = 0.70(5)% was found. In addition, at large plunger distances no stop peaks have<br />
been systematically observed for γ -transitions depopulat<strong>in</strong>g highly excited states ma<strong>in</strong>ly<br />
of the 109 Cd nucleus.<br />
As reported <strong>in</strong> [18] the first derivative dQ ij (x)/dx of an experimental decay curve<br />
Q ij (x) can be either determ<strong>in</strong>ed experimentally or it can be derived from the decay<br />
curve Q ij (x) by calculat<strong>in</strong>g the first derivative dG ij (x)/dx of a cont<strong>in</strong>uously differentiable<br />
function G ij (x),i.e.<br />
dQ ij (x)<br />
dx<br />
:= dG ij (x)<br />
. (3)<br />
dx<br />
The function G ij (x) is obta<strong>in</strong>ed by fitt<strong>in</strong>g several second order polynomials over<br />
separate <strong>in</strong>tervals to the measured Q ij (x) data po<strong>in</strong>ts. In the present work, the quantities<br />
dQ ij (x)/dx have been obta<strong>in</strong>ed via the latter (fitt<strong>in</strong>g) procedure. The experimental decay<br />
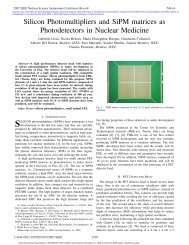
curves Q ij (x) determ<strong>in</strong>ed <strong>in</strong> the present work for the yrast b<strong>and</strong> members up to 12 + 1 state<br />
are shown <strong>in</strong> Fig. 3. The solid curves also shown <strong>in</strong> this figure represent the respective<br />
fitted functions G ij (x) from which the derivatives dG ij (x)/dx, i.e. quantities dQ ij (x)/dx,<br />
have been derived by us<strong>in</strong>g the code APATHIE [23].<br />
From Eq. (1), it can be clearly seen that when analyz<strong>in</strong>g plunger data accord<strong>in</strong>g to<br />
DDCM, one actually obta<strong>in</strong>s a value for the mean <strong>lifetime</strong> τ of a given excited state at<br />
each target-to-stopper distance x, i.e.asetofτ(x) data po<strong>in</strong>ts, <strong>in</strong> the follow<strong>in</strong>g called<br />
“τ -curve”, is f<strong>in</strong>ally derived. This is actually the ma<strong>in</strong> advantage <strong>in</strong> apply<strong>in</strong>g DDCM<br />
<strong>in</strong>stead of carry<strong>in</strong>g out a “conventional” data analysis, which is based on solv<strong>in</strong>g a set<br />
of coupled differential equations (Bateman’s equations) for each excited level of <strong>in</strong>terest.<br />
When us<strong>in</strong>g DDCM the τ(x) data po<strong>in</strong>ts obta<strong>in</strong>ed have to lie, with<strong>in</strong> statistical errors,<br />
on a straight l<strong>in</strong>e. Hence, when this is not the case, then either the decay curves have<br />
not been corrected for various effects aris<strong>in</strong>g usually <strong>in</strong> plunger <strong>measurements</strong> (see, e.g.,<br />
Ref. [24]), or other systematic errors are present <strong>in</strong> the data analysis. Decay curves have<br />
to be usually corrected for relativistic aberration, solid angle <strong>and</strong> nuclear deorientation<br />
effects. Furthermore, as shown <strong>in</strong> [25], systematic errors may arise <strong>in</strong> the analysis when<br />
the contribution of the so-called side feed<strong>in</strong>g, i.e. the feed<strong>in</strong>g from cont<strong>in</strong>uum <strong>and</strong>/or by<br />
unobserved weak discrete transitions, to the decay curves has not been assessed correctly.<br />
In the present work, corrections due to relativistic aberration were negligible s<strong>in</strong>ce the<br />
recoil velocity v was small enough. In addition, the areas U ij (x) of the Doppler-unshifted<br />
peaks were not affected by solid angle effects, s<strong>in</strong>ce the stopper <strong>in</strong> the plunger device<br />
was kept fixed dur<strong>in</strong>g the experiment. As <strong>in</strong> the case of [26], the <strong>in</strong>tensities S ij (x) of<br />
the flight peaks have been affected by solid angle effects at target-to-stopper distances<br />
x 1 mm. A reliable estimation of the <strong>in</strong>fluence of these effects on S ij (x) can be obta<strong>in</strong>ed<br />
by compar<strong>in</strong>g these <strong>in</strong>tensities with the correspond<strong>in</strong>g unshifted <strong>in</strong>tensities U ij (x) <strong>in</strong> the<br />
difference spectra: accord<strong>in</strong>g to [21], <strong>in</strong> a difference spectrum the areas of U ij (x) <strong>and</strong><br />
S ij (x) are statistically equal, provided that stop <strong>and</strong>/or flight peak are not contam<strong>in</strong>ated by<br />
other γ -l<strong>in</strong>es. This procedure has been followed <strong>in</strong> our case to correct, when necessary,<br />
areas S ij (x). It has however to be po<strong>in</strong>ted out that the values Q ij (x) measured for<br />
x 1 mm were not significant <strong>in</strong> apply<strong>in</strong>g DDCM analysis.
Fig. 3. Experimental decay curves Q(x) (circles) measured <strong>in</strong> 110 Cd. The solid curves are the respective cont<strong>in</strong>uously differentiable function G(x)<br />
obta<strong>in</strong>ed by fitt<strong>in</strong>g several second order polynomials over separate distance <strong>in</strong>tervals. From the fitted G(x) functions the respective first derivatives<br />
dQ(x)/dx := dG(x)/dx have been calculated <strong>and</strong> used to obta<strong>in</strong> the mean <strong>lifetime</strong>s by apply<strong>in</strong>g Eq. (1) <strong>and</strong>/or Eq. (6) (see text).<br />
S. Harissopulos et al. / Nuclear Physics A 683 (2001) 157–181 163
164 S. Harissopulos et al. / Nuclear Physics A 683 (2001) 157–181<br />
As po<strong>in</strong>ted out <strong>in</strong> [27], nuclear deorientation is expected to have a significant <strong>in</strong>fluence<br />
to the <strong>in</strong>tensities of γ -transitions deexcit<strong>in</strong>g states with sp<strong>in</strong> J 4. In addition, <strong>in</strong> the<br />
case of E2 γ -transitions (J = 2) this <strong>in</strong>fluence is rather strong at 0 ◦ <strong>and</strong> rather weak<br />
at 55 ◦ . Hence, the ratio of the decay curve of a given excited state derived at a certa<strong>in</strong><br />
angle θ to this determ<strong>in</strong>ed at 55 ◦ , provides a reliable check for possible <strong>in</strong>fluence of the<br />
nuclear deorientation effect. In case this “anisotropy ratio” is constant, the decay curve<br />
derived at the certa<strong>in</strong> angle θ needs no corrections. In the present work, this check has<br />
been partially h<strong>in</strong>dered by the fact that dur<strong>in</strong>g the experiment the detector placed at 55 ◦ has<br />
provided spectra with long left tails <strong>in</strong> the γ -peaks, probably due to neutron damage, <strong>and</strong><br />
also irregular ga<strong>in</strong> shifts, which <strong>in</strong> many cases occurred <strong>in</strong> the same s<strong>in</strong>gle spectrum. Due<br />
to these problems anisotropy ratios have been derived via follow<strong>in</strong>g procedure: the “less<br />
damaged” 55 ◦ -spectra, i.e. the γ -s<strong>in</strong>gles spectra <strong>in</strong>clud<strong>in</strong>g relatively short left tails <strong>and</strong> no<br />
ga<strong>in</strong> shifts, have been normalized to the 260 keV γ -transition of 109 Cd. From the latter<br />
(normalized) spectra, the <strong>in</strong>tensities of the unshifted peak of the 2 + 1 → 0+ 1<br />
γ -transition<br />
of the 110 Cd nucleus have been derived via a very careful <strong>in</strong>tegration procedure. This<br />
procedure has also been carried out for the γ -s<strong>in</strong>gles spectra taken at 160 ◦ . Unfortunately,<br />
the quality of the 55 ◦ spectra did not allow to obta<strong>in</strong> anisotropy ratios for the 4 + 1 → 2+ 1<br />
γ -transition as well. In the follow<strong>in</strong>g, the <strong>in</strong>tensities of the unshifted peak of a γ -transition<br />
i → j obta<strong>in</strong>ed from spectra normalized to the 260 keV γ -transition of 109 Cd, which have<br />
beentakenatanangleθ, will be declared as R ij (x, θ). Hereby, it has to be po<strong>in</strong>ted out that<br />
R ij (x, θ) have not been determ<strong>in</strong>ed from difference spectra like quantities U ij (x).<br />
The <strong>in</strong>tensities R ij (x, θ = 55 ◦ ) of the 2 + 1 → 0+ 1<br />
γ -transition of 110 Cd have been<br />
compared with the respective R ij (x, 0 ◦ ) <strong>and</strong> R ij (x, 160 ◦ ). The correspond<strong>in</strong>g anisotropy<br />
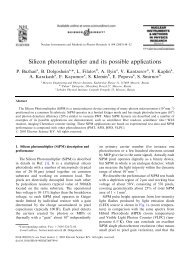
ratios are shown <strong>in</strong> Fig. 4. Accord<strong>in</strong>g to this figure, the decay curves determ<strong>in</strong>ed at 0 ◦<br />
<strong>and</strong> 160 ◦ are <strong>in</strong>fluenced from the nuclear deorientation effect at distances x 100 µm<br />
<strong>and</strong> x 1000 µm, respectively. In addition, by fitt<strong>in</strong>g a s<strong>in</strong>gle exponential function of the<br />
form f(x)= a · exp(−x/τ R ) + c to the 0 ◦ /55 ◦ anisotropy ratio we obta<strong>in</strong>ed a relaxation<br />
time-constant τ R = 410(120) ps. It has to be emphasized that the fit function used serves<br />
only to correct the data measured at 0 ◦ , i.e. the data po<strong>in</strong>ts of the decay curve determ<strong>in</strong>ed<br />
Fig. 4. Anisotropy ratios measured <strong>in</strong> the present work for the 2 + 1 → 0+ 1 γ -transition of the 110 Cd.<br />
The solid curve shown <strong>in</strong> (a) has been obta<strong>in</strong>ed by the fitt<strong>in</strong>g of the s<strong>in</strong>gle exponential function<br />
f(x)= a · exp(−x/τ R ) + c to the data, which yielded a relaxation time-constant τ R = 410(120) ps.
S. Harissopulos et al. / Nuclear Physics A 683 (2001) 157–181 165<br />
at 0 ◦ have to be divided by the respective values f(x) yielded by the fitt<strong>in</strong>g procedure.<br />
The fit function used does not necessarily describe <strong>in</strong> details the effect <strong>in</strong>volved: the timeconstant<br />
τ R could however serve for a comparison to other RDDS <strong>measurements</strong> <strong>in</strong> which<br />
the nuclear deorientation effect has been taken <strong>in</strong>to account <strong>in</strong> the analysis. Based on the<br />
anisotropy ratios determ<strong>in</strong>ed here, the data measured at 0 ◦ have been corrected as described<br />
above. The result<strong>in</strong>g mean <strong>lifetime</strong>s were found to deviate less than 12% from the results<br />
derived when no deorientation effect was taken <strong>in</strong>to account. As the statistical errors of<br />
most mean <strong>lifetime</strong>s obta<strong>in</strong>ed from our data analysis are much larger than 12%, it is rather<br />
realistic to assume that, any uncerta<strong>in</strong>ties due to deorientation effects are not significant for<br />
our f<strong>in</strong>al results.<br />
In our analysis special care was focussed on side feed<strong>in</strong>g: Its contribution to the decay<br />
curves is accord<strong>in</strong>g to [25] not à priori negligible, especially when the side-feed<strong>in</strong>g<br />
<strong>in</strong>tensity Ii<br />
sf of the level <strong>in</strong> consideration is not small enough, i.e. when Ii sf / ∑ j I ij 5%.<br />
Quantity Ii<br />
sf is calculated from the <strong>in</strong>tensities I ij <strong>and</strong> I hi that have already been def<strong>in</strong>ed<br />
above, accord<strong>in</strong>g to the follow<strong>in</strong>g equation:<br />
I sf<br />
i<br />
= ∑ j<br />
I ij − ∑ h<br />
I hi . (4)<br />
As shown <strong>in</strong> [25] the time distribution of side feed<strong>in</strong>g of a given discrete level L i<br />
is approximately the same as the average time distribution of the discrete γ -transitions<br />
(L h → L i ) feed<strong>in</strong>g this level. Accord<strong>in</strong>g to the f<strong>in</strong>d<strong>in</strong>gs of [25], the side feed<strong>in</strong>g of level<br />
L i can be simulated by an “effective” side feed<strong>in</strong>g decay curve, noted here as Q sf<br />
i (x),<br />
which is to be obta<strong>in</strong>ed as the weighted average of the decay curves Q hi (x) of the discrete<br />
transitions (L h → L i ) feed<strong>in</strong>g the level L i . Hence, Q sf<br />
i<br />
(x) is to be calculated accord<strong>in</strong>g to<br />
the follow<strong>in</strong>g equation:<br />
∑<br />
Q sf<br />
i (x) = h I hi · Q hi<br />
∑<br />
h I . (5)<br />
hi<br />
The “effective” side feed<strong>in</strong>g decay curve Q sf has to be taken <strong>in</strong>to account when apply<strong>in</strong>g<br />
Eq. (1). In this case <strong>and</strong> by tak<strong>in</strong>g <strong>in</strong>to account Eq. (4), one obta<strong>in</strong>s follow<strong>in</strong>g equation:<br />
[<br />
( ∑<br />
( ) (<br />
Ihi<br />
I<br />
sf ) )]/[<br />
i<br />
τ(x)=− Q ij (x) − b ij Q hi (x) + Q sf<br />
i<br />
I<br />
h ij I (x) v · dQ ]<br />
ij (x)<br />
ij dx<br />
[ ∑ ]/[ ]<br />
=− Q ij (x) −<br />
. (6)<br />
h I hi · Q hi<br />
∑<br />
h I hi<br />
i<br />
v · dQ ij (x)<br />
dx<br />
The relative side feed<strong>in</strong>g <strong>in</strong>tensities, i.e. the ratio I sf<br />
i<br />
/ ∑ j I ij , of all levels <strong>in</strong> 110 Cd <strong>and</strong><br />
109 Cd studied <strong>in</strong> the present work are given <strong>in</strong> Tables 2 <strong>and</strong> 3 respectively. As it can be<br />
seen there, the side-feed<strong>in</strong>g <strong>in</strong>tensities of the ground b<strong>and</strong> members of 110 Cd up to 8 +<br />
state were small enough, so that the contribution of side feed<strong>in</strong>g to the decay curves of<br />
these states could be neglected. This, however, was not the case for the 10 + 1 <strong>and</strong> 12+ 1 states<br />
of 110 Cd <strong>and</strong> for almost all levels of 109 Cd. For these cases an effective side-feed<strong>in</strong>g decay<br />
curve was calculated accord<strong>in</strong>g to Eq. (5), <strong>and</strong> Eq. (6) has been further applied <strong>in</strong> order to<br />
determ<strong>in</strong>e the respective mean <strong>lifetime</strong>.
166 S. Harissopulos et al. / Nuclear Physics A 683 (2001) 157–181<br />
4. Results<br />
4.1. The nucleus 110 Cd<br />
For the data analysis <strong>in</strong> 110 Cd, the level scheme reported <strong>in</strong> [8,28] has been adopted. Part<br />
of this level scheme, <strong>in</strong> which all the γ -transitions <strong>in</strong>volved <strong>in</strong> our analysis are <strong>in</strong>cluded,<br />
isshown<strong>in</strong>Fig.5.Theτ -curves obta<strong>in</strong>ed for the yrast b<strong>and</strong> members <strong>in</strong> 110 Cd are shown<br />
<strong>in</strong> Figs. 6 <strong>and</strong> 7. As shown <strong>in</strong> these Figs. the τ(x)-values of all levels <strong>in</strong>vestigated, do not<br />
<strong>in</strong>dicate any systematic errors: the data po<strong>in</strong>ts τ(x) lie <strong>in</strong>deed, with<strong>in</strong> statistical errors, on<br />
a straight l<strong>in</strong>e. Due to statistics, these errors are, especially <strong>in</strong> the case of 4 + 1 <strong>and</strong> 6+ 1 states,<br />
relatively large. The mean <strong>lifetime</strong>s τ displayed <strong>in</strong> parts (c) of these figures have been<br />
deduced as the weighted average <strong>in</strong>dicated by a straight l<strong>in</strong>e of the respective τ(x) values.<br />
The results are summarized <strong>in</strong> Table 2.<br />
The mean <strong>lifetime</strong> of the 2 + 1<br />
state (τ = 8.7(12) ps) determ<strong>in</strong>ed here, is statistically <strong>in</strong><br />
agreement with that reported by Piipar<strong>in</strong>en et al. (τ = 9.2(6) ps) <strong>in</strong> [28] as well as that<br />
adopted <strong>in</strong> the most recent data compilation of A = 110 nuclei (τ = 7.78(10) ps) [29].<br />
For the 4 + 1<br />
state, the DDCM analysis of our data yielded a mean <strong>lifetime</strong> τ = 1.0(5) ps.<br />
The correspond<strong>in</strong>g value <strong>in</strong> [29] is τ = 1.05(13) ps. It has to be noticed that the mean<br />
<strong>lifetime</strong>s adopted <strong>in</strong> [29] for the 2 + 1 <strong>and</strong> 4+ 1<br />
levels have been derived <strong>in</strong> Coulomb excitation<br />
<strong>measurements</strong>. Our result for the 4 + 1<br />
state is further <strong>in</strong> agreement with that obta<strong>in</strong>ed<br />
recently by Lobach et al. (τ = 1.18 +0.32<br />
−0.18 ) [30]. This applies also for the 6+ 1<br />
level for which<br />
Fig. 5. Partial level scheme of 110 Cd (from Refs. [8,28]). The width of the arrows represents the<br />
relative <strong>in</strong>tensity measured <strong>in</strong> the present work for the correspond<strong>in</strong>g transition (see also text). The<br />
excitation energy of each of the three different 8 + states is given <strong>in</strong> parenthesis. The mean <strong>lifetime</strong>s<br />
or mean <strong>lifetime</strong> limits determ<strong>in</strong>ed <strong>in</strong> the present work are also displayed.
Table 2<br />
Mean <strong>lifetime</strong>s τ <strong>and</strong> B(E2) values determ<strong>in</strong>ed <strong>in</strong> the present work for 110 Cd <strong>in</strong> comparison to other <strong>measurements</strong>. The excitation energy of the levels<br />
is given by E x . The relative side-feed<strong>in</strong>g <strong>in</strong>tensity adopted <strong>in</strong> the DDCM analysis for the correspond<strong>in</strong>g excited state is given by I SF . The energy of the<br />
γ -transitions deexcit<strong>in</strong>g the levels is given by E γ . The sp<strong>in</strong> <strong>and</strong> parities of the respective <strong>in</strong>itial <strong>and</strong> f<strong>in</strong>al states are given by Ji π <strong>and</strong> Jf π respectively. I i→f<br />
<strong>and</strong> b i→f are the relative <strong>in</strong>tensities <strong>and</strong> γ -branch<strong>in</strong>gs, respectively, measured <strong>in</strong> the present work for the correspond<strong>in</strong>g γ -transitions<br />
Level I SF τ (ps) J π<br />
i → J π f E γ I i→f b i→f B(E2) [W u]<br />
E x (keV) (%) this work others a (keV) (arb. units) (%) this work others a<br />
658 0.5(24) 8.7(12) 7.78(10) b 2 + 1 → 0+ 1 658 100 100 24(3) 27(1) b<br />
9.2(6) c 23(2) c<br />
1542 3.5(21) 1.0(5) 1.05(13) b 4 + 1 → 2+ 1 885 99.5(2) 100 48(24) 46(6) b<br />
1.18 +0.32<br />
−0.18 d 40(8) d<br />
2480 2.4(22) 0.9(5) 0.58 +0.22<br />
−0.13 d 6 + 1 → 4+ 1 938 82.1(1) 100 40(22) 62.3(175) d<br />
3275 0.1(25) 1.5(5) 0.90(30) b 8 + 2 → 6+ 1 795 50.5(8) 100 55(18) 91(30) h<br />
1.2 < ···< 4 d 44.0(238) d<br />
3440 1.6 < ···< 4 d 8 + 3 → 6+ 1 960 7.4(10) 9.8(42) d<br />
3611 20.2(36) 670(25) 670(35) e 10 + 1 → 8+ 2 335 40.5(9) 72(3) 6.6(4) 6.0(3) e<br />
650(144) f 7.7(18) f<br />
→ 8 + 3 171 11.5(13) 20(3) 45(5) 26(2) e<br />
33.5(85) f<br />
→ 8 + 1 424 0.9(3) 2(1) 0.05(2) 0.04(1) e<br />
→ 9 − 265 3.4(5) 6.0(5)<br />
0.054(18) f<br />
S. Harissopulos et al. / Nuclear Physics A 683 (2001) 157–181 167
Table 2 —cont<strong>in</strong>ued<br />
Level I SF τ (ps) J π<br />
i → J π f E γ I i→f b i→f B(E2) [W u]<br />
E x (keV) (%) this work others a (keV) (arb. units) (%) this work others a<br />
4172 23.1(38) 11.4(6) 12.0(6) c 12 + 1 → 10+ 1 561 44.9(11) 100 41(2) 39(2) c<br />
5026 < 4 2.0(2) c 14 + 1 → 12+ 1 854 34.5(12) 100 > 14 29(3) c<br />
4078 < 5 1.0(3) c 10 + 2 → 8+ 2 802 10.0(5) 100 > 16 74(24) c<br />
1.2 +0.5<br />
−0.3 d 60.4(186) d<br />
4889 2.0(2) c 12 + 2 → 10+ 2 811 10(3) 37(2) c<br />
2540 0.90 +0.40<br />
−0.25 d 5 − → 4 + 998 13.9(6)<br />
2879 < 1250 750(40) e 7 − → 6 + 399 22.1(5)<br />
866(144) f → 5 − 339 11(1) g > 1.2 2.3(3) e<br />
1.6(3) f<br />
3346 71(4) c 9 − → 7 − 467 14.3(10) g 15.1(9) c<br />
a A recent data compilation can be found <strong>in</strong> Ref. [29].<br />
b From Ref. [29].<br />
c From Ref. [28].<br />
d From Ref. [30].<br />
e Accord<strong>in</strong>g to [30], after a reanalysis of the data of Ref. [28].<br />
f From Ref. [32].<br />
g Estimated value s<strong>in</strong>ce doublet γ -l<strong>in</strong>e.<br />
h B(E2) value calculated us<strong>in</strong>g the mean <strong>lifetime</strong> given <strong>in</strong> [29].<br />
168 S. Harissopulos et al. / Nuclear Physics A 683 (2001) 157–181
S. Harissopulos et al. / Nuclear Physics A 683 (2001) 157–181 169<br />
Fig. 6. DDCM analysis of the three lowest yrast states of 110 Cd. For a given level, the respective data<br />
<strong>in</strong> (a) correspond to the numerator of Eq. (6), i.e. the time distribution of the “difference” between<br />
the depopulation <strong>and</strong> the population of the level <strong>in</strong> consideration. Data <strong>in</strong> (b) correspond to the<br />
denom<strong>in</strong>ator of Eq. (6) multiplied by −1, i.e. the opposite values of the first time derivative of the<br />
respective decay curve. By divid<strong>in</strong>g data po<strong>in</strong>ts shown <strong>in</strong> a) by the correspond<strong>in</strong>g data po<strong>in</strong>ts shown<br />
<strong>in</strong> (b) one obta<strong>in</strong>s the τ(x) values shown <strong>in</strong> (c). The solid straight l<strong>in</strong>es shown <strong>in</strong> parts (c) correspond<br />
to the displayed mean <strong>lifetime</strong>s τ . These have been obta<strong>in</strong>ed by averag<strong>in</strong>g the respective τ(x) values.<br />
our analysis yielded a mean <strong>lifetime</strong>s of 0.9(5) ps, whereas Lobach et al. have derived<br />
τ = 0.58 +0.22<br />
−0.13 [30]. For the 8+ 2<br />
state a mean <strong>lifetime</strong> of 1.5(5) ps has been here determ<strong>in</strong>ed.<br />
For this level, a τ = 0.9(3) ps has been adopted <strong>in</strong> the compilation of De Frenne <strong>and</strong><br />
Jacobs [29].<br />
At this po<strong>in</strong>t it has to be mentioned that the presence of the 164 keV γ -ray, which<br />
accord<strong>in</strong>g to [28] depopulates the 8 + level at E x = 3440 keV excitation energy <strong>and</strong> feeds<br />
the 8 + 2<br />
state at E x = 3275 keV, was not present <strong>in</strong> our γ -s<strong>in</strong>gles spectra. Hence, no such<br />
feeder was taken <strong>in</strong>to account <strong>in</strong> the analysis of the latter state. Furthermore, <strong>in</strong> accordance<br />
to [28], a 707 keV γ -ray depopulates an 8 + state at E x = 3187 keV <strong>and</strong> feeds the 6 + 1<br />
level. In the γ -s<strong>in</strong>gles spectra taken here, this γ -transition is a member of a multiplet of<br />
γ -l<strong>in</strong>es, so that no decay curve could be obta<strong>in</strong>ed. Hence, it was not possible to consider<br />
the 707 keV γ -transition <strong>in</strong> the analysis of the 6 + 1<br />
level. From the <strong>in</strong>tensity balance of this<br />
state however (see Table 2), it can be seen that the <strong>in</strong>tensity of the 707 keV γ -ray relative<br />
to this of the 938 keV γ -transition (6 + 1 → 4+ 1<br />
) is less than 2.2%. Hence, the mean <strong>lifetime</strong><br />
determ<strong>in</strong>ed for the 6 + 1 state is rather weakly dependent on the decay time of the 8+ 1 level
170 S. Harissopulos et al. / Nuclear Physics A 683 (2001) 157–181<br />
Fig. 7. Same as Fig. 6 for the 8 + 2 ,10+ 1 <strong>and</strong> 12+ 1 states of 110 Cd.<br />
at E x = 3187 keV, which is deexcited by the 707 keV γ -l<strong>in</strong>e: <strong>in</strong> case the latter feeder had<br />
been taken <strong>in</strong>to account <strong>in</strong> the analysis, one would have obta<strong>in</strong>ed a slightly shorter mean<br />
<strong>lifetime</strong> τ for the 6 + 1<br />
state. Such a decrease <strong>in</strong> τ of this state however would not have<br />
changed the f<strong>in</strong>al conclusions concern<strong>in</strong>g this level.<br />
The mean <strong>lifetime</strong> determ<strong>in</strong>ed <strong>in</strong> the present work for the 10 + 1<br />
state (τ = 670(25) ps) do<br />
not justify the f<strong>in</strong>d<strong>in</strong>gs of the measurement reported <strong>in</strong> [28], where a longer mean <strong>lifetime</strong><br />
(τ = 800(40) ps) was reported. However, a reanalysis of the data of the latter measurement<br />
yielded accord<strong>in</strong>g to [31] a mean <strong>lifetime</strong> τ = 670(35) ps, which is <strong>in</strong> excellent agreement<br />
with our result, with which the f<strong>in</strong>d<strong>in</strong>gs of [32] (τ = 650(144) ps) also agree. The mean<br />
<strong>lifetime</strong> of the 12 + 1<br />
state measured <strong>in</strong> our work (τ = 11.4(6) ps) is statistically <strong>in</strong> agreement<br />
with the respective mean <strong>lifetime</strong> reported <strong>in</strong> [28] (τ = 12.0(6) ps). For the 14 + 1<br />
<strong>and</strong> the<br />
10 + 2<br />
levels only upper limits of τ 4ps<strong>and</strong>τ 5 ps, respectively, could be determ<strong>in</strong>ed <strong>in</strong><br />
the present work, s<strong>in</strong>ce the decay curves of their precursor states could not be measured.<br />
These upper limits have been determ<strong>in</strong>ed by fitt<strong>in</strong>g a s<strong>in</strong>gle exponential function to the<br />
decay curves of the 854 keV <strong>and</strong> 802 keV γ -transitions, respectively. Here, it has to be<br />
po<strong>in</strong>ted out that the 637 keV γ -ray, which accord<strong>in</strong>g to [28], deexcites the 10 + 2<br />
level <strong>and</strong><br />
feeds the 8 + 3 level at E x = 3440 keV (see Fig. 5) was not present <strong>in</strong> our γ -spectra.<br />
No DDCM analysis could be performed for the 7 − state s<strong>in</strong>ce the 467 keV γ -ray feeder<br />
from the 9 − level is a doublet <strong>and</strong> therefore no decay curve could be derived for the<br />
precursor 9 − state. The fitt<strong>in</strong>g of a s<strong>in</strong>gle exponential function to the decay curve of the 7 −
S. Harissopulos et al. / Nuclear Physics A 683 (2001) 157–181 171<br />
state yielded τ = 1050(100) ps. This, delayed feed<strong>in</strong>g from the 7 − level has “obscured”<br />
the decay curve of the 998 keV γ -transition deexcit<strong>in</strong>g the 5 − state. Hence, it was not<br />
possible to extract a mean <strong>lifetime</strong> for the 5 − level.<br />
4.2. The nucleus 109 Cd<br />
In order to analyze the data concern<strong>in</strong>g excited states <strong>in</strong> 109 Cd, the level scheme<br />
reported by Juut<strong>in</strong>en et al. [11] has been adopted. Part of this level scheme is shown <strong>in</strong><br />
Fig. 8. Hereby, only the excited states <strong>and</strong> γ -transitions, which are relevant for our data<br />
analysis, are <strong>in</strong>cluded. The relative <strong>in</strong>tensities of the transitions shown <strong>in</strong> Fig. 8 have been<br />
determ<strong>in</strong>ed from the γ -s<strong>in</strong>gles spectra taken <strong>in</strong> the present <strong>in</strong>tensity measurement. In order<br />
to facilitate the discussion, the level scheme shown <strong>in</strong> Fig. 8 has been arbitrarily divided <strong>in</strong><br />
level sequences labeled with numbers rang<strong>in</strong>g from 1 to 7. The results of the present work<br />
concern<strong>in</strong>g the nucleus 109 Cd are summarized <strong>in</strong> Table 3. The correspond<strong>in</strong>g τ -curves of<br />
the DDCM analysis are shown Figs. 9–11.<br />
Fig. 8. Partial level scheme of 109 Cd adopted from [11]. Only the excited states <strong>and</strong> γ -transitions,<br />
taken <strong>in</strong>to account <strong>in</strong> the data analysis, are shown. The widths of the arrows are proportional to the<br />
relative <strong>in</strong>tensities measured <strong>in</strong> the present work for the respective γ -transitions. The level scheme<br />
has been arbitrarily divided <strong>in</strong> level sequences labeled with numbers rang<strong>in</strong>g from 1 to 7. The mean<br />
<strong>lifetime</strong>s or mean <strong>lifetime</strong> limits determ<strong>in</strong>ed <strong>in</strong> the present work are also displayed.
172 S. Harissopulos et al. / Nuclear Physics A 683 (2001) 157–181<br />
Table 3<br />
Mean <strong>lifetime</strong>s τ <strong>and</strong> B(E2) values determ<strong>in</strong>ed <strong>in</strong> the present work for 109 Cd. The numbers <strong>in</strong> the<br />
first column <strong>in</strong>dicate the level sequences (see Fig. 9) <strong>in</strong> which the correspond<strong>in</strong>g states are placed.<br />
The rest notation is the same as <strong>in</strong> Table 2<br />
Placed Level I SF τ J π<br />
i → J π f E γ I i→f b i→f B(E2)<br />
<strong>in</strong> E x (keV) (%) (ps) (keV) (arb. units) (%) [W u]<br />
1 3911 < 19 25/2 + → 23/2 + 527 1.6(2) 28.9(44) a<br />
→ 21/2 + 851 1.8(2) 32.5(37) >1<br />
→ 23/2 − 1048 1.5(5) b 28.3(66) a<br />
2 4725 < 4.5 31/2 + → 29/2 + 478 0.9(1) 13.0(11)<br />
→ 27/2 + 785 6.0(2) 87.0(34) >16<br />
2 3940 54.5(47) 5.5(5) 27/2 + → 25/2 + 415 4.8(1) 36.4(17)<br />
→ 23/2 + 557 8.4(5) 63.6(46) 57(8)<br />
2 3383 11.5(67) 17.5(13) 23/2 + → 21/2 + 324 4.2(2) 37.2(22)<br />
→ 21/2 − 340 0.8(2) 7.0(14)<br />
→ 19/2 + 441 6.3(5) 55.8(48) 51(7)<br />
2 2942 19.2(20) d < 5 19/2 + → 17/2 − 776 1.2(2) 17.9(21)<br />
→ 15/2 + 801 0.9(2) 13.4(31) >2<br />
→ 19/2 − 1121 4.6(2) 68.7(37)<br />
3 4247 < 5.5 29/2 + → 25/2 + 722 10.1(2) 100 > 25<br />
3 3525 23.8(27) 17.5(17) 25/2 + → 21/2 + 466 13.5(4) 69.5(27) 48(6)<br />
→ 23/2 − 663 5.9(1) 30.5(10)<br />
3 3060 1.4(35) 1.2(7) 21/2 + → 17/2 + 372 0.4(1) 2.0(2) 62(37)<br />
→ 19/2 − 1238 19.7(8) 98.0(34)<br />
4 2862 30.1(23) < 1.7 23/2 − → 19/2 − 1041 28.4(5) 100 > 13<br />
4 1821 20.6(27) 0.85(20) 19/2 − → 15/2 − 836 83.3(13) 100 76(19)<br />
4 986 8.6(26) 14.4(6)) 15/2 − → 11/2 − 522 100 100 47(3)<br />
5 5280 46(16) < 11 29/2 − → 27/2 − 649 2.2(1) 63.4(97) a<br />
→ 25/2 − 1249 0.4(1) 11.0(29) a<br />
5 4631 62(18) < 6 27/2 − → 25/2 − 600 5.7(4) 66.2(96) a<br />
5 4031 27.3(74) < 4 25/2 − → 23/2 − 482 3.5(2) 61.8(26)<br />
→ 23/2 − 1169 2.2(2) 38.2(20)<br />
5 3549 17.8(48) < 3 23/2 − → 21/2 − 195 1.3(3) 29.5(42)<br />
→ 23/2 − 687 3.1(3) 70.5(47)<br />
6 3043 84.6(80) < 5 21/2 − → 17/2 − 877 2.9(2) 55.8(43) >5<br />
→ 19/2 − 1221 2.3(1) 44.2(35)<br />
6 2974 < 11 21/2 − → 17/2 − 808 0.8(3) 29.6(66) >2<br />
→ 19/2 − 1152 1.9(1) 70.3(55)<br />
6 2166 39(5) 0.7(4) 17/2 − → 13/2 − 741 1.1(1) 19.0(15) 32(19)<br />
→ 15/2 − 1181 4.8(1) 81.0(33)<br />
7 3371 < 5 23/2 − → 19/2 − 780 2.1(3) 44.5(71) >7<br />
→ 19/2 − 1549 2.6(3) 55.5(82) >0.2<br />
7 2591 37(15) 1.2(5) 19/2 − → 15/2 − 1605 3.3(4) 100 2.1(9)<br />
7 2867 1820(280) 21/2 (+) → 19/2 − 1045 6.7(8) 100<br />
a Branch<strong>in</strong>g calculated <strong>in</strong>clud<strong>in</strong>g also γ -transitions either not displayed <strong>in</strong> Fig. 8 or not given <strong>in</strong><br />
Table 3.<br />
b Estimated value s<strong>in</strong>ce doublet γ -l<strong>in</strong>e.
S. Harissopulos et al. / Nuclear Physics A 683 (2001) 157–181 173<br />
Fig. 9. Same as Fig. 6 for some excited states of level sequences “2” <strong>and</strong> “3” of 109 Cd.<br />
4.2.1. The level sequences “1”, “2” <strong>and</strong> “3”<br />
In the level sequence “1” only the “effective” <strong>lifetime</strong> (<strong>in</strong> the follow<strong>in</strong>g noted as τ e ), of<br />
the excited state hav<strong>in</strong>g sp<strong>in</strong> J π = 25/2 + could be obta<strong>in</strong>ed: Due to statistics the decay<br />
curves of the γ -transitions feed<strong>in</strong>g <strong>in</strong>to this state could not be derived from the spectra<br />
measured. Hence, by fitt<strong>in</strong>g a s<strong>in</strong>gle exponential function to the decay curve determ<strong>in</strong>ed<br />
for the 527 keV γ -transition, a τ25/2 e + = 13(3) ps was derived. Accord<strong>in</strong>g to this value, <strong>and</strong><br />
us<strong>in</strong>g the conventional 2σ -limits, the mean <strong>lifetime</strong> of this state has to be shorter than 19 ps.<br />
The 851 keV <strong>and</strong> 1048 keV γ -rays deexcit<strong>in</strong>g the J π = 25/2 + level were not sufficiently<br />
resolved <strong>in</strong> the γ -spectra. This was also the case for the 562 keV, 679 keV <strong>and</strong> 759 keV γ -<br />
transitions, which depopulate the J π = 23/2 + state of sequence “1”. Consequently, the<br />
<strong>in</strong>tensities deduced via a gaussian fitt<strong>in</strong>g procedure for these γ -transitions were rather<br />
uncerta<strong>in</strong>. Due to these uncerta<strong>in</strong>ties, the DDCM analysis of the J π = 19/2 + state of<br />
sequence “2” yielded only an upper limit for its mean <strong>lifetime</strong>: s<strong>in</strong>ce the feed<strong>in</strong>g from the<br />
levels of sequence “1” <strong>in</strong>to this state was rather uncerta<strong>in</strong>, only the 441 keV discrete feed<strong>in</strong>g<br />
γ -transition hav<strong>in</strong>g a relative <strong>in</strong>tensity of 80.8(20)% has been considered <strong>in</strong> the analysis.<br />
The feed<strong>in</strong>g <strong>in</strong>to the J π = 21/2 + state of sequence “3” arises ma<strong>in</strong>ly from the<br />
deexcitation of the J π = 23/2 + <strong>and</strong> J π = 25/2 + states of sequence “2” <strong>and</strong> “3”<br />
respectively: the relative total <strong>in</strong>tensity of the 324 keV <strong>and</strong> 466 keV γ -transitions is<br />
98.6(35)%, whereas the rest arises from the γ -rays depopulat<strong>in</strong>g the levels of sequence “1”.<br />
Consequently, corrections due to the latter rather weak feed<strong>in</strong>g from sequence “1” were<br />
negligible. The DDCM analysis of the J π = 21/2 + state of sequence “3” yielded a mean<br />
<strong>lifetime</strong> τ = 1.2(7) ps.
174 S. Harissopulos et al. / Nuclear Physics A 683 (2001) 157–181<br />
Fig. 10. Same as Fig. 6 for some excited states of level sequence “4” of 109 Cd. In the case of the<br />
23/2 − state one can clearly see that not all τ(x)-values lie statistically on a straight l<strong>in</strong>e. This is due<br />
to the fact that the strongest γ -transition feed<strong>in</strong>g <strong>in</strong>to this level could not be taken <strong>in</strong>to account <strong>in</strong> the<br />
analysis (see also text).<br />
For the 23/2 + <strong>and</strong> 27/2 + states of sequence “2” the DDCM analysis yielded mean<br />
<strong>lifetime</strong>s of 17.5(13) ps <strong>and</strong> 5.5(5) ps respectively, whereas for the 25/2 + level of sequence<br />
“3” a mean <strong>lifetime</strong> of 17.5(17) ps has been derived. For the 31/2 + <strong>and</strong> 29/2 + states only<br />
effective <strong>lifetime</strong>s have been obta<strong>in</strong>ed: due to statistics, the decay curves of their discrete<br />
feed<strong>in</strong>g transitions could not be extracted from the spectra measured. Hence, by fitt<strong>in</strong>g a<br />
s<strong>in</strong>gle exponential function to the decay curves of the 785 keV <strong>and</strong> 722 keV γ -transitions<br />
we obta<strong>in</strong>ed τ e 31/2 + = 3.5(5) ps <strong>and</strong> τ e 29/2 + = 4.5(5) ps, respectively.<br />
4.2.2. The level sequence “4”<br />
In the DDCM analysis of the J π = 15/2 − state three discrete γ -feed<strong>in</strong>g transitions,<br />
namely the 836 keV, 1181 keV <strong>and</strong> 1605 keV γ -transitions, have been taken <strong>in</strong>to account.<br />
Accord<strong>in</strong>g to our <strong>in</strong>tensity measurement these γ -transitions feed <strong>in</strong>to the level considered<br />
with a relative total <strong>in</strong>tensity of 91.4(25)%. Here, it has to be mentioned that Juut<strong>in</strong>en et<br />
al. have reported <strong>in</strong> [11] a 1701.8 keV γ -transition deexcit<strong>in</strong>g the 17/2 + state of sequence<br />
“3”, which feeds <strong>in</strong>to the 15/2 − level. In our work the latter γ -feeder was found to have<br />
negligible relative <strong>in</strong>tensity of less than 1%. Hence, a relative side feed<strong>in</strong>g <strong>in</strong>tensity of<br />
8.6(26)% has been adopted. The DDCM analysis yielded a mean <strong>lifetime</strong> τ = 14.4(6) ps<br />
for the 15/2 − level.<br />
Accord<strong>in</strong>g to [11], the 19/2 − state of level sequence “4” is populated via several discrete<br />
γ -transitions. Here, seven discrete feeders with a total relative <strong>in</strong>tensity of 79.4(19)%have
S. Harissopulos et al. / Nuclear Physics A 683 (2001) 157–181 175<br />
Fig. 11. Same as Fig. 6 for some excited states of level sequences “6” <strong>and</strong> “7” of 109 Cd.<br />
been considered <strong>in</strong> the analysis of this state. These feed<strong>in</strong>g transitions are all shown <strong>in</strong><br />
Fig. 8. The rema<strong>in</strong><strong>in</strong>g discrete feed<strong>in</strong>g transitions reported <strong>in</strong> [11] were <strong>in</strong> our work rather<br />
weak: their decay curves could not be obta<strong>in</strong>ed <strong>in</strong> the present work. Hence, they have been<br />
treated as side feed<strong>in</strong>g with a relative <strong>in</strong>tensity of 20.6(27)%. The DDCM analysis of the<br />
19/2 − state yielded a mean <strong>lifetime</strong> τ = 0.85(20) ps.<br />
For the 23/2 − state of level sequence “4” only an upper mean <strong>lifetime</strong> limit was derived:<br />
the strongest discrete feeder (1160 keV γ -ray from the 27/2 − state) was obscured by other<br />
transitions <strong>in</strong> the γ -s<strong>in</strong>gles spectra. Hence, the decay curve of the latter feed<strong>in</strong>g transition<br />
could not be determ<strong>in</strong>ed <strong>and</strong> its <strong>in</strong>fluence to the decay of the 23/2 − could not be assessed.<br />
In such a case, as already shown <strong>in</strong> details <strong>in</strong> [18], the τ(x)values are expected to decrease<br />
asymptotically down to a constant value, with <strong>in</strong>creas<strong>in</strong>g distance x. This was <strong>in</strong>deed<br />
observed <strong>in</strong> the τ -curve of the level <strong>in</strong> consideration (see Fig. 10), which decreases down<br />
to τ = 1.3(2) ps. This value yields an upper limit of 1.7 ps for the mean <strong>lifetime</strong> of the<br />
23/2 − level.<br />
4.2.3. The level sequences “5”, “6”, <strong>and</strong> “7”<br />
Most of the γ -transitions shown <strong>in</strong> Fig. 8 for the level sequence “5” were not sufficiently<br />
resolved <strong>in</strong> the γ -s<strong>in</strong>gles spectra. Consequently, the gaussian fitt<strong>in</strong>g procedure carried<br />
out to determ<strong>in</strong>e their <strong>in</strong>tensities <strong>and</strong>/or their decay curves yielded rather large statistical<br />
errors. Due to these uncerta<strong>in</strong>ties several feed<strong>in</strong>g assumptions have been tested <strong>in</strong> the<br />
DDCM analysis of these states. S<strong>in</strong>ce the results were strongly <strong>in</strong>fluenced from the feed<strong>in</strong>g<br />
assumption used, only upper mean <strong>lifetime</strong> limits can be reported (see Table 3). A strik<strong>in</strong>g
176 S. Harissopulos et al. / Nuclear Physics A 683 (2001) 157–181<br />
Fig. 12. Experimental decay curve of the 21/2 (+) excited state of level sequence “7” <strong>in</strong> 109 Cd. The<br />
data po<strong>in</strong>ts are the <strong>in</strong>tensity of the Doppler unshifted component of the 1045 keV γ -transition which<br />
deexcites the level considered. The solid curve is obta<strong>in</strong>ed by fitt<strong>in</strong>g a s<strong>in</strong>gle exponential function to<br />
the data po<strong>in</strong>ts which yields a mean <strong>lifetime</strong> of 1.82(28) ns.<br />
feature of the decay curves measured for the members of this level sequence is that they all<br />
have the same effective <strong>lifetime</strong>, i.e. τ e ≈ 9(1) ps. This may suggest that the mean <strong>lifetime</strong>s<br />
of the levels considered are rather short, i.e. τ
S. Harissopulos et al. / Nuclear Physics A 683 (2001) 157–181 177<br />
5. Discussion<br />
The B(E2) values determ<strong>in</strong>ed <strong>in</strong> the present work for the lowest E2 yrast b<strong>and</strong><br />
γ -transitions of 110 Cd are given <strong>in</strong> Table 2. The B(E2) values determ<strong>in</strong>ed <strong>in</strong> the present<br />
work for the 2 + 1 → 0+ 1 <strong>and</strong> 4+ 1 → 2+ 1<br />
γ -transitions are <strong>in</strong> rather good agreement with<br />
those reported <strong>in</strong> Ref. [29]. The latter B(E2) values have been determ<strong>in</strong>ed <strong>in</strong> previous<br />
Coulomb excitation <strong>measurements</strong>. In addition, the B(E2) values derived <strong>in</strong> our work for<br />
the 2 + 1 → 0+ 1 <strong>and</strong> 4+ 1 → 2+ 1<br />
γ -transitions are <strong>in</strong> rather good agreement with those reported<br />
<strong>in</strong> Refs. [28] <strong>and</strong> [30], respectively.<br />
Accord<strong>in</strong>g to the transition probabilities obta<strong>in</strong>ed <strong>in</strong> 110 Cd, an <strong>in</strong>crease of the B(E2)<br />
values occurs up to the 8 + 2<br />
state at E x = 3275 keV. Above this level one dist<strong>in</strong>guishes<br />
between a “fast” <strong>and</strong> a “slow” pathway (see Fig. 5). The former proceeds via the<br />
802 keV γ -transition, through which the 10 + 2<br />
level is deexcited. For this γ -transition<br />
Piipar<strong>in</strong>en et al. [28] as well as Lobach et al. [30] have reported high B(E2) values of<br />
74(24) W.u. <strong>and</strong> 60.4(186) W.u., respectively. In the present work only a lower limit of<br />
B(E2; 802 keV)>16 W.u could be determ<strong>in</strong>ed. The “slow” pathway proceeds via the<br />
335 keV γ -ray deexcit<strong>in</strong>g the 10 + 1<br />
state. For the 335 keV γ -ray a B(E2; 335 keV) =<br />
6.6(4) W.u. has been obta<strong>in</strong>ed <strong>in</strong> the present work. Above the 10 + 1<br />
state the collectivity<br />
“recovers”: a high transition probability of B(E2) = 41(2) W.u has been here determ<strong>in</strong>ed<br />
for the 12 + 1 → 10+ 1 γ -transition (E γ = 561 keV).<br />
An <strong>in</strong>terest<strong>in</strong>g feature <strong>in</strong> the level scheme of 110 Cd, is the existence of three closely<strong>in</strong>g<br />
8 + states. These states are shown <strong>in</strong> Fig. 5, <strong>in</strong> which the respective excitation<br />
level energies are given <strong>in</strong> parenthesis. Accord<strong>in</strong>g to [7,8,28] the lowest ly<strong>in</strong>g 8 + state<br />
at E x = 3187 keV is fed by the 10 + stateviaa424keVγ -ray <strong>and</strong> is further deexcited to<br />
6 + 1<br />
state through a 707 keV γ -transition. The B(E2) value obta<strong>in</strong>ed here for the 424 keV<br />
populat<strong>in</strong>g γ -transition is rather low: B(E2; 424 keV) = 0.05(2) W.u. This value clearly<br />
<strong>in</strong>dicates a significant difference between the configurations of the 8 + 1 at 10+ 1<br />
states. On the<br />
other h<strong>and</strong> the high transition rate (B(E2; 171 keV) = 45(5) W.u) determ<strong>in</strong>ed here for the<br />
171 keV γ -ray deexcit<strong>in</strong>g the 10 + 1 state <strong>and</strong> feed<strong>in</strong>g <strong>in</strong>to the 8+ 3 level at E x = 3440 keV<br />
is a strong argument for assign<strong>in</strong>g the same character <strong>in</strong> both states. Unfortunately, due to<br />
statistics <strong>and</strong> the fact that the decay curve measured <strong>in</strong> the present work for the 960 keV<br />
γ -ray (8 + 3 → 6+ 1 ) is “obscured” by the strong slow feed<strong>in</strong>g from the 10+ 1<br />
state, it was not<br />
possible to extract a mean <strong>lifetime</strong> for the 8 + 3<br />
level <strong>and</strong> further obta<strong>in</strong> the B(E2) value of the<br />
8 + 3 → 6+ 1<br />
γ -transition. However, Lobach et al. [30] have reported for this γ -ray a B(E2)<br />
value of 9.8(42) W.u. which suggests different configurations for the 8 + 3 <strong>and</strong> 6+ 1 states.<br />
In Fig. 13(i) the relative B(E2) values measured here for 110 Cd are compared with the<br />
respective ratios predicted by the U(5)-limit of IBM-1. Hence, <strong>in</strong> Fig. 13(i), the ratios<br />
[ B(E2; I → I − 2)<br />
R = R exp. B(E2; 2 + 1<br />
=<br />
→ 0+ 1<br />
]exp.<br />
[ ) R U(5) B(E2; I → I − 2)<br />
(7)<br />
B(E2; 2 + 1 → 0+ 1 ) ]U(5)
178 S. Harissopulos et al. / Nuclear Physics A 683 (2001) 157–181<br />
Fig. 13. (i): Plot of the ratio R = R exp /R U(5) of the experimental relative B(E2) values <strong>in</strong> 110 Cd<br />
to the respective relative B(E2) values predicted by the U(5) limit of IBM-1 vs. sp<strong>in</strong> I (see text for<br />
explanations). (ii): Same as part (i) for the even–even Cd nuclei with mass number A rang<strong>in</strong>g from<br />
106 to 116 (see also text).
S. Harissopulos et al. / Nuclear Physics A 683 (2001) 157–181 179<br />
are plotted vs. (<strong>in</strong>itial) sp<strong>in</strong> I . Hereby, the data po<strong>in</strong>ts shown are the weighted average values<br />
of the respective B(E2) values given <strong>in</strong> Table 2, except that of the B(E2; 14 + 2 → 12+ 2 )<br />
which has been deduced from the Q 2 t values, i.e. the square of the transition quadrupole<br />
moments, given <strong>in</strong> Ref. [33]. It has to be noticed that the 14 + 2 → 12+ 2<br />
γ -transition is not<br />
shown<strong>in</strong>Fig.5.ForI 8, the <strong>in</strong>volved γ -transitions are given <strong>in</strong> parenthesis. Accord<strong>in</strong>g<br />
to Eq. (7), if the measured relative B(E2) values were equal to the respective ones predicted<br />
by the vibrational limit (U(5)-limit) of IBM-1, then the respective data po<strong>in</strong>ts had to lie on<br />
the straight l<strong>in</strong>e labeled <strong>in</strong> Fig. 13(i) with letter “a”. This l<strong>in</strong>e correspond to R = 1. Curve<br />
labeled “b” represents the ratio of the relative B(E2) values predicted by the SU(3) limit<br />
of IBM-1 (rotational limit) to those predicted by the U(5) limit. As it can be seen <strong>in</strong> Fig.<br />
13(i) the data po<strong>in</strong>ts for I = 2, 4, 6 ¯h lie statistically on the straight l<strong>in</strong>e “a”. For I = 8 ¯h<br />
one has to dist<strong>in</strong>guish between both weak 8 + 1 → 6+ 1 <strong>and</strong> 8+ 3 → 6+ 1<br />
γ -transitions from the<br />
strong 8 + 2 → 6+ 1 γ -ray (E γ = 795 keV). The data po<strong>in</strong>t of the latter transition lies <strong>in</strong>deed<br />
on l<strong>in</strong>e “a”, whereas the data po<strong>in</strong>ts of the former γ -rays deviate strongly from R = 1.<br />
For I = 10 ¯h only the relative B(E2) value of the 10 + 2 → 8+ 2<br />
γ -transition is close to the<br />
respective U(5) predictions. For I = 12 ¯h the relative B(E2) value of both the 12 + 1 → 10+ 1<br />
<strong>and</strong> 12 + 2 → 10+ 2<br />
γ -transitions lie close to the straight l<strong>in</strong>e “a”. This also applies for the<br />
both the 14 + 1 → 12+ 1 <strong>and</strong> 14+ 2 → 12+ 2 γ -rays.<br />
Based on Fig. 13(i), <strong>and</strong> provided that the 8 + 2 → 6+ 1<br />
(E γ = 795 keV) γ -l<strong>in</strong>e, together<br />
with the “unfavoured” pathway consisted of the 10 + 2 → 8+ 2 ,12+ 2 → 10+ 2 , <strong>and</strong> 14+ 2 →<br />
12 + 2<br />
γ -transitions are the cont<strong>in</strong>uation of the ground b<strong>and</strong>, one clearly sees that the level<br />
sequence<br />
2 + 1 , 4+ 1 , 6+ 1 , 8+ 2 , 10+ 2 , 12+ 2 , 14+ 2<br />
forms a nice vibrational b<strong>and</strong> with <strong>in</strong>trab<strong>and</strong> B(E2) values be<strong>in</strong>g <strong>in</strong> agreement with the<br />
predictions of the U(5) limit of IBM-1.<br />
Recently, Regan et al. [34] have carried out a g-factor measurement of the 10 + 1<br />
state that<br />
yielded g 10<br />
+ =−0.09(3). This result clearly elucidate the neutron nature of the 10+ 1 1 state.<br />
Hence, as claimed <strong>in</strong> [7] the level sequence 10 + 1 ,12+ 1 ,14+ 1<br />
can be attributed to excitations<br />
due to the alignment of an h 11/2 neutron pair. In such a case the 8 + 3<br />
state, which is fed by the<br />
10 + 1<br />
level via the 171 keV γ -ray, must also have neutron character due to the high transition<br />
rate of the 10 + 1 → 8+ 3<br />
γ -transition (B(E2; 171 keV) = 45(5) W.u). Such an assignment is<br />
not <strong>in</strong> agreement with the proton character proposed for the 8 + 3<br />
state <strong>in</strong> [7].<br />
By consider<strong>in</strong>g all the B(E2) values reported so far [4,5,28–30,33] for the yrast b<strong>and</strong>s<br />
of the even even Cd nuclei with A = 106–116 <strong>and</strong> then calculat<strong>in</strong>g the ratio R def<strong>in</strong>ed<br />
<strong>in</strong> Eq. (7) one obta<strong>in</strong>s Fig. 13(ii), <strong>in</strong> which R is plotted vs. <strong>in</strong>itial sp<strong>in</strong> I for all the above<br />
mentioned Cd isotopes. Hereby, it has to be noticed that all the ratios R shown <strong>in</strong> Fig. 13(ii)<br />
have been deduced from Coulomb excitation <strong>measurements</strong> except those of 110 Cd. The<br />
latter ratios have been taken from the present RDDS work, from the RDDS <strong>measurements</strong><br />
of Piipar<strong>in</strong>en et al. [28] as well as from the DSAM <strong>measurements</strong> of Lobach et al. [30].<br />
From Fig. 13(ii), it can be clearly seen that the measured transition probabilities <strong>in</strong> the even<br />
even Cd nuclei, are <strong>in</strong> a remarkably good agreement with the respective predictions of the<br />
U(5) limit of IBM-1.
180 S. Harissopulos et al. / Nuclear Physics A 683 (2001) 157–181<br />
The reduced transition probabilities determ<strong>in</strong>ed <strong>in</strong> 109 Cd are rather large. Especially<br />
<strong>in</strong> level sequence “4” it was found that B(E2; 15/2 − → 11/2 − ) = 47(3) W.u. In<br />
107 Cd, Häusser et al. [13] have obta<strong>in</strong>ed B(E2; 15/2 − → 11/2 − ) = 32(2) W.u. This is<br />
<strong>in</strong>deed a drastic change when consider<strong>in</strong>g that the respective γ -transitions differ only by<br />
7 keV. In the weak coupl<strong>in</strong>g scheme, it is expected that B(E2; 15/2 − → 11/2 − )109 Cd ≈<br />
B(E2; 2 + → 0 + )110 Cd , whereas <strong>in</strong> the rotational aligned coupl<strong>in</strong>g the B(E2; 15/2− →<br />
11/2 − )109 Cd value is slightly larger. In our case B(E2; 15/2− → 11/2 − )109 Cd ≈ 2 ·<br />
B(E2; 2 + → 0 + )110 Cd . Hence, our result deviates significantly from the values expected.<br />
An <strong>in</strong>terest<strong>in</strong>g feature of level sequences “2” <strong>and</strong> “3” <strong>in</strong> 109 Cd, is that the B(E2) values<br />
deduced from the mean <strong>lifetime</strong>s of the respective depopulat<strong>in</strong>g E2 γ -transitions do not<br />
change significantly with <strong>in</strong>creas<strong>in</strong>g sp<strong>in</strong>. Accord<strong>in</strong>g to the B(E2) values obta<strong>in</strong>ed for the<br />
21/2 + → 17/2 + ,23/2 + → 19/2 + ,25/2 + → 21/2 + , <strong>and</strong> 27/2 + → 23/2 + γ -transitions<br />
the collectivity <strong>in</strong> these level sequences is almost constant (≈ 50 W.u).<br />
6. Conclusions<br />
In the present work the mean <strong>lifetime</strong>s of 9 excited states <strong>in</strong> 109 Cd have been determ<strong>in</strong>ed<br />
for the first time. The correspond<strong>in</strong>g B(E2) values are rather large.<br />
In 110 Cd, the mean <strong>lifetime</strong>s of the lowest 6 yrast b<strong>and</strong> members have been measured.<br />
Hence, it was possible to follow the evolution of the B(E2) values along the yrast l<strong>in</strong>e of<br />
110 Cd. Based on the relative B(E2) values determ<strong>in</strong>ed here <strong>and</strong> <strong>in</strong> [28] one could claim that<br />
the 110 Cd is one of the best examples of nuclei resembl<strong>in</strong>g the U(5) symmetry of IBM-1.<br />
This has been also shown by Kern et al. [2] <strong>in</strong> terms of the energies of the excited states <strong>in</strong><br />
110 Cd.<br />
The comparison of all experimental B(E2) values reported so far for the E2 γ -transitions<br />
deexcit<strong>in</strong>g the lowest ly<strong>in</strong>g collective states <strong>in</strong> the even even Cd nuclei, are <strong>in</strong> a remarkably<br />
good agreement with the respective predictions of the U(5) limit of IBM-1. Certa<strong>in</strong>ly, it<br />
would be very <strong>in</strong>terest<strong>in</strong>g to determ<strong>in</strong>e more B(E2) values along the yrast l<strong>in</strong>es of these<br />
nuclei <strong>in</strong> order to check further the U(5) character of these isotopes.<br />
References<br />
[1] A. Arima, F. Iachello, Ann. Phys. 99 (1976) 253.<br />
[2] J. Kern, D.E. Garrett, J. Jolie, H. Lehmann, Nucl. Phys. A 593 (1995) 21.<br />
[3] F.K. McGowan, R.L. Rob<strong>in</strong>son, P.H. Stelson, J.L.C. Ford Jr., Nucl. Phys. 66 (1965) 97.<br />
[4] W.T. Milner, F.K. McGowan, P.H. Stelson, R.L. Rob<strong>in</strong>son, R.O. Sayer, Nucl. Phys. A 129<br />
(1969) 687.<br />
[5] C. Fahl<strong>and</strong>er, A. Bäckl<strong>in</strong>, L. Hasselgren, A. Kavka, V. MIttal, L.E. Svensson, B. Varnestig,<br />
D. Cl<strong>in</strong>e, B. Kotliski, H. Gre<strong>in</strong>, E. Grosse, R. Kulessa, C. Michel, W. Spreng, H.J. Wollersheim,<br />
J. Stachel, Nucl. Phys. A 485 (1988) 327.<br />
[6] I. Thorslund, C. Fahl<strong>and</strong>er, J. Nyberg, S. Juut<strong>in</strong>en, R. Jul<strong>in</strong>, M. Piipar<strong>in</strong>en, R. Wyss,<br />
A. Lamp<strong>in</strong>en, T. Lönnroth, D. Müller, S. Törmänen, A. Virtanen, Nucl. Phys. A 564 (1993)<br />
285.<br />
[7] J. Kern, A. Bruder, S. Drissi, V.A. Ionescu, D. Kusnezov, Nucl. Phys. A 512 (1990) 1.
S. Harissopulos et al. / Nuclear Physics A 683 (2001) 157–181 181<br />
[8] S. Juut<strong>in</strong>en, R. Jul<strong>in</strong>, M. Piipar<strong>in</strong>en, P. Ahonen, B. Cederwall, C. Fahl<strong>and</strong>er, A. Lamp<strong>in</strong>en,<br />
T. Lönnroth, A. Maj, S. Mitarai, D. Müller, J. Nyberg, P. Simecek, M. Sugawara, I. Thorslund,<br />
S. Törmänen, A. Virtanen, R. Wyss, Nucl. Phys. A 573 (1994) 306.<br />
[9] M. Deleze, S. Drissi, J. Jolie, J. Kern, J.P. Vorlet, Nucl. Phys. A 554 (1993) 1.<br />
[10] D.C. Stromswold, D.O. Elliott, Y.K. Lee, L.E. Samuelson, J.A. Grau, F.A. Rickey, P.C. Simms,<br />
Phys. Rev. C 17 (1978) 143.<br />
[11] S. Juut<strong>in</strong>en, P. Simecek, C. Fahl<strong>and</strong>er, R. Jul<strong>in</strong>, J. Kumpula<strong>in</strong>en, A. Lamp<strong>in</strong>en, T. Lönnroth,<br />
A. Maj, S. Mitarai, D. Müller, J. Nyberg, M. Piipar<strong>in</strong>en, M. Sugawara, I. Thorslund,<br />
S. Törmänen, A. Virtanen, Nucl. Phys. A 577 (1994) 727.<br />
[12] F.S. Stephens, R.M. Diamond, S.G. Nilsson, Phys. Lett. B 44 (1973) 429.<br />
[13] O. Häusser, D.J. Donahue, R.L. Hershberger, R. Lutter, F. Riess, H. Bohn, T. Faestermann,<br />
F. v. Feilitzsch, K.E.G. Löbner, Phys. Lett. B 52 (1974) 329.<br />
[14] G. Alaga, V. Paar, V. Lopac, Phys. Lett. B 43 (1973) 459.<br />
[15] T.K. Alex<strong>and</strong>er, J.S. Foster, Adv. Nucl. Phys. 10 (1978) 197.<br />
[16] H. Hanew<strong>in</strong>kel, Diplomarbeit, Institut für Kernphysik, Universität zu Köln, Köln, 1981,<br />
unpublished.<br />
[17] T.K. Alex<strong>and</strong>er, A. Bell, Nucl. Instrum. Methods 81 (1970) 22.<br />
[18] A. Dewald, S. Harissopulos, P. von Brentano, Z. Phys. A 334 (1989) 163.<br />
[19] G. Böhm, A. Dewald, P. Petkov, P. von Brentano, Nucl. Instrum. Methods A 329 (1993) 248.<br />
[20] C.M. Lederer, V.S. Shirley (Eds.), Table of Isotopes, Wiley, New York, 1978.<br />
[21] A. Dewald, U. Kaup, W. Gast, A. Gelberg, H.W. Schuh, K.O. Zell, P. von Brentano, Phys. Rev.<br />
C 25 (1982) 226.<br />
[22] S. Albers, A. Clauberg, A. Dewald, C. Wesselborg, A. Zilges, Verh<strong>and</strong>l. DPG(VI) 23 (1988)<br />
227.<br />
[23] F. Seiffert, Program APATHIE, Institut für Kernphysik, Universität zu Köln, Köln, 1989,<br />
unpublished.<br />
[24] K.W. Jones, A. Schwarzschild, E.K. Warburton, D.B. Fossan, Phys. Rev. 178 (1969) 1773.<br />
[25] S. Harissopulos, A. Dewald, A. Gelberg, P. von Brentano, K. Loewenich, K. Schiffer, K.O. Zell,<br />
Nucl. Phys. A 467 (1987) 528.<br />
[26] P. Petkov, S. Harissopulos, A. Dewald, M. Stolzenwald, G. Böhm, P. Sala, K. Schiffer,<br />
A. Gelberg, K.O. Zell, P. von Brentano, W. Andrejtscheff, Nucl. Phys. A 543 (1992) 589.<br />
[27] P. Petkov, R. Krücken, A. Dewald, P. Sala, G. Böhm, J. Altmann, A. Gelberg, P. von Brentano,<br />
R.V. Jolos, W. Andrejtscheff, Nucl. Phys. A 568 (1994) 572.<br />
[28] M. Piipar<strong>in</strong>en, R. Jul<strong>in</strong>, S. Juut<strong>in</strong>en, A. Virtanen, P. Ahonen, C. Fahl<strong>and</strong>er, J. Hattula,<br />
A. Lamp<strong>in</strong>en, T. Lönnroth, A. Maj, S. Mitarai, D. Müller, J. Nyberg, A. Pakkanen, M. Sugawara,<br />
I. Thorslund, S. Törmänen, Nucl. Phys. A 565 (1993) 671.<br />
[29] D. De Frenne, E. Jacobs, Nucl. Data Sheets 89 (2000) 481.<br />
[30] Yu.N. Lobach, A.D. Efimov, A.A. Pasternak, Eur. Phys. J. A 6 (1999) 131.<br />
[31] M. Piipar<strong>in</strong>en, private communication.<br />
[32] L.K. Kostov, W. Andrejtscheff, L.G. Kostova, L. Käubler, H. Prade, R. Schwenger, Eur. Phys.<br />
J. A 2 (1998) 269.<br />
[33] R. Jul<strong>in</strong>, Phys. Scr. T 56 (1995) 151.<br />
[34] P.H. Regan, A.E. Stuchbery, S.S. Andersen, Nucl. Phys. A 591 (1995) 533.