Picosecond lifetime measurements in 109Cd and 110Cd
Picosecond lifetime measurements in 109Cd and 110Cd
Picosecond lifetime measurements in 109Cd and 110Cd

Create successful ePaper yourself
Turn your PDF publications into a flip-book with our unique Google optimized e-Paper software.
176 S. Harissopulos et al. / Nuclear Physics A 683 (2001) 157–181<br />
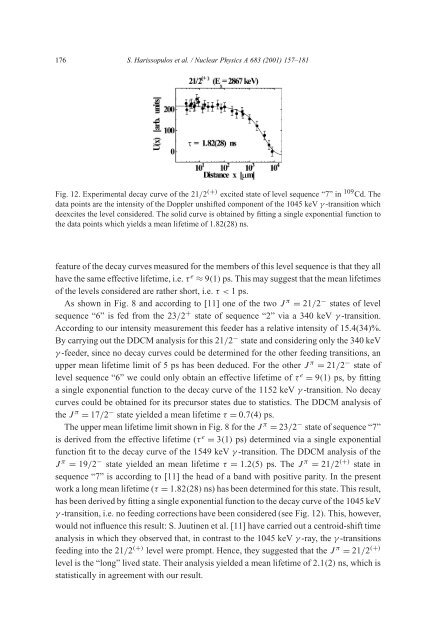
Fig. 12. Experimental decay curve of the 21/2 (+) excited state of level sequence “7” <strong>in</strong> 109 Cd. The<br />
data po<strong>in</strong>ts are the <strong>in</strong>tensity of the Doppler unshifted component of the 1045 keV γ -transition which<br />
deexcites the level considered. The solid curve is obta<strong>in</strong>ed by fitt<strong>in</strong>g a s<strong>in</strong>gle exponential function to<br />
the data po<strong>in</strong>ts which yields a mean <strong>lifetime</strong> of 1.82(28) ns.<br />
feature of the decay curves measured for the members of this level sequence is that they all<br />
have the same effective <strong>lifetime</strong>, i.e. τ e ≈ 9(1) ps. This may suggest that the mean <strong>lifetime</strong>s<br />
of the levels considered are rather short, i.e. τ