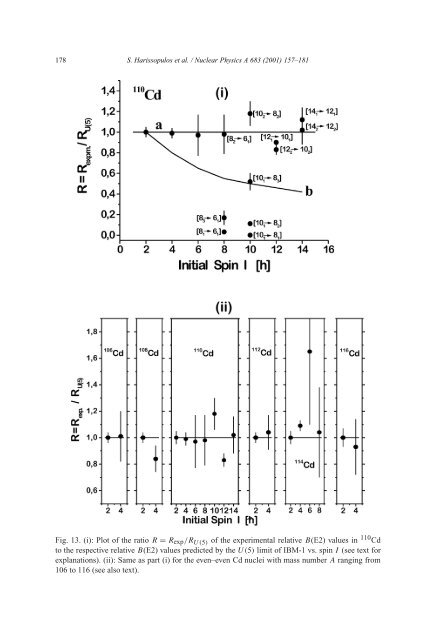
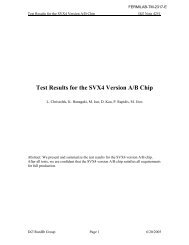
178 S. Harissopulos et al. / Nuclear Physics A 683 (2001) 157–181 Fig. 13. (i): Plot of the ratio R = R exp /R U(5) of the experimental relative B(E2) values <strong>in</strong> 110 Cd to the respective relative B(E2) values predicted by the U(5) limit of IBM-1 vs. sp<strong>in</strong> I (see text for explanations). (ii): Same as part (i) for the even–even Cd nuclei with mass number A rang<strong>in</strong>g from 106 to 116 (see also text).
S. Harissopulos et al. / Nuclear Physics A 683 (2001) 157–181 179 are plotted vs. (<strong>in</strong>itial) sp<strong>in</strong> I . Hereby, the data po<strong>in</strong>ts shown are the weighted average values of the respective B(E2) values given <strong>in</strong> Table 2, except that of the B(E2; 14 + 2 → 12+ 2 ) which has been deduced from the Q 2 t values, i.e. the square of the transition quadrupole moments, given <strong>in</strong> Ref. [33]. It has to be noticed that the 14 + 2 → 12+ 2 γ -transition is not shown<strong>in</strong>Fig.5.ForI 8, the <strong>in</strong>volved γ -transitions are given <strong>in</strong> parenthesis. Accord<strong>in</strong>g to Eq. (7), if the measured relative B(E2) values were equal to the respective ones predicted by the vibrational limit (U(5)-limit) of IBM-1, then the respective data po<strong>in</strong>ts had to lie on the straight l<strong>in</strong>e labeled <strong>in</strong> Fig. 13(i) with letter “a”. This l<strong>in</strong>e correspond to R = 1. Curve labeled “b” represents the ratio of the relative B(E2) values predicted by the SU(3) limit of IBM-1 (rotational limit) to those predicted by the U(5) limit. As it can be seen <strong>in</strong> Fig. 13(i) the data po<strong>in</strong>ts for I = 2, 4, 6 ¯h lie statistically on the straight l<strong>in</strong>e “a”. For I = 8 ¯h one has to dist<strong>in</strong>guish between both weak 8 + 1 → 6+ 1 <strong>and</strong> 8+ 3 → 6+ 1 γ -transitions from the strong 8 + 2 → 6+ 1 γ -ray (E γ = 795 keV). The data po<strong>in</strong>t of the latter transition lies <strong>in</strong>deed on l<strong>in</strong>e “a”, whereas the data po<strong>in</strong>ts of the former γ -rays deviate strongly from R = 1. For I = 10 ¯h only the relative B(E2) value of the 10 + 2 → 8+ 2 γ -transition is close to the respective U(5) predictions. For I = 12 ¯h the relative B(E2) value of both the 12 + 1 → 10+ 1 <strong>and</strong> 12 + 2 → 10+ 2 γ -transitions lie close to the straight l<strong>in</strong>e “a”. This also applies for the both the 14 + 1 → 12+ 1 <strong>and</strong> 14+ 2 → 12+ 2 γ -rays. Based on Fig. 13(i), <strong>and</strong> provided that the 8 + 2 → 6+ 1 (E γ = 795 keV) γ -l<strong>in</strong>e, together with the “unfavoured” pathway consisted of the 10 + 2 → 8+ 2 ,12+ 2 → 10+ 2 , <strong>and</strong> 14+ 2 → 12 + 2 γ -transitions are the cont<strong>in</strong>uation of the ground b<strong>and</strong>, one clearly sees that the level sequence 2 + 1 , 4+ 1 , 6+ 1 , 8+ 2 , 10+ 2 , 12+ 2 , 14+ 2 forms a nice vibrational b<strong>and</strong> with <strong>in</strong>trab<strong>and</strong> B(E2) values be<strong>in</strong>g <strong>in</strong> agreement with the predictions of the U(5) limit of IBM-1. Recently, Regan et al. [34] have carried out a g-factor measurement of the 10 + 1 state that yielded g 10 + =−0.09(3). This result clearly elucidate the neutron nature of the 10+ 1 1 state. Hence, as claimed <strong>in</strong> [7] the level sequence 10 + 1 ,12+ 1 ,14+ 1 can be attributed to excitations due to the alignment of an h 11/2 neutron pair. In such a case the 8 + 3 state, which is fed by the 10 + 1 level via the 171 keV γ -ray, must also have neutron character due to the high transition rate of the 10 + 1 → 8+ 3 γ -transition (B(E2; 171 keV) = 45(5) W.u). Such an assignment is not <strong>in</strong> agreement with the proton character proposed for the 8 + 3 state <strong>in</strong> [7]. By consider<strong>in</strong>g all the B(E2) values reported so far [4,5,28–30,33] for the yrast b<strong>and</strong>s of the even even Cd nuclei with A = 106–116 <strong>and</strong> then calculat<strong>in</strong>g the ratio R def<strong>in</strong>ed <strong>in</strong> Eq. (7) one obta<strong>in</strong>s Fig. 13(ii), <strong>in</strong> which R is plotted vs. <strong>in</strong>itial sp<strong>in</strong> I for all the above mentioned Cd isotopes. Hereby, it has to be noticed that all the ratios R shown <strong>in</strong> Fig. 13(ii) have been deduced from Coulomb excitation <strong>measurements</strong> except those of 110 Cd. The latter ratios have been taken from the present RDDS work, from the RDDS <strong>measurements</strong> of Piipar<strong>in</strong>en et al. [28] as well as from the DSAM <strong>measurements</strong> of Lobach et al. [30]. From Fig. 13(ii), it can be clearly seen that the measured transition probabilities <strong>in</strong> the even even Cd nuclei, are <strong>in</strong> a remarkably good agreement with the respective predictions of the U(5) limit of IBM-1.