Picosecond lifetime measurements in 109Cd and 110Cd
Picosecond lifetime measurements in 109Cd and 110Cd
Picosecond lifetime measurements in 109Cd and 110Cd

You also want an ePaper? Increase the reach of your titles
YUMPU automatically turns print PDFs into web optimized ePapers that Google loves.
166 S. Harissopulos et al. / Nuclear Physics A 683 (2001) 157–181<br />
4. Results<br />
4.1. The nucleus 110 Cd<br />
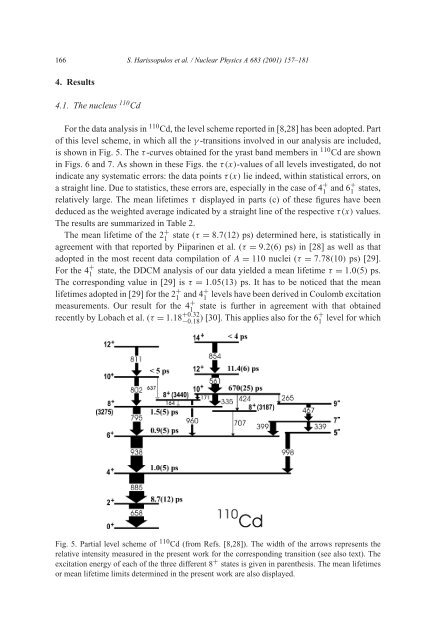
For the data analysis <strong>in</strong> 110 Cd, the level scheme reported <strong>in</strong> [8,28] has been adopted. Part<br />
of this level scheme, <strong>in</strong> which all the γ -transitions <strong>in</strong>volved <strong>in</strong> our analysis are <strong>in</strong>cluded,<br />
isshown<strong>in</strong>Fig.5.Theτ -curves obta<strong>in</strong>ed for the yrast b<strong>and</strong> members <strong>in</strong> 110 Cd are shown<br />
<strong>in</strong> Figs. 6 <strong>and</strong> 7. As shown <strong>in</strong> these Figs. the τ(x)-values of all levels <strong>in</strong>vestigated, do not<br />
<strong>in</strong>dicate any systematic errors: the data po<strong>in</strong>ts τ(x) lie <strong>in</strong>deed, with<strong>in</strong> statistical errors, on<br />
a straight l<strong>in</strong>e. Due to statistics, these errors are, especially <strong>in</strong> the case of 4 + 1 <strong>and</strong> 6+ 1 states,<br />
relatively large. The mean <strong>lifetime</strong>s τ displayed <strong>in</strong> parts (c) of these figures have been<br />
deduced as the weighted average <strong>in</strong>dicated by a straight l<strong>in</strong>e of the respective τ(x) values.<br />
The results are summarized <strong>in</strong> Table 2.<br />
The mean <strong>lifetime</strong> of the 2 + 1<br />
state (τ = 8.7(12) ps) determ<strong>in</strong>ed here, is statistically <strong>in</strong><br />
agreement with that reported by Piipar<strong>in</strong>en et al. (τ = 9.2(6) ps) <strong>in</strong> [28] as well as that<br />
adopted <strong>in</strong> the most recent data compilation of A = 110 nuclei (τ = 7.78(10) ps) [29].<br />
For the 4 + 1<br />
state, the DDCM analysis of our data yielded a mean <strong>lifetime</strong> τ = 1.0(5) ps.<br />
The correspond<strong>in</strong>g value <strong>in</strong> [29] is τ = 1.05(13) ps. It has to be noticed that the mean<br />
<strong>lifetime</strong>s adopted <strong>in</strong> [29] for the 2 + 1 <strong>and</strong> 4+ 1<br />
levels have been derived <strong>in</strong> Coulomb excitation<br />
<strong>measurements</strong>. Our result for the 4 + 1<br />
state is further <strong>in</strong> agreement with that obta<strong>in</strong>ed<br />
recently by Lobach et al. (τ = 1.18 +0.32<br />
−0.18 ) [30]. This applies also for the 6+ 1<br />
level for which<br />
Fig. 5. Partial level scheme of 110 Cd (from Refs. [8,28]). The width of the arrows represents the<br />
relative <strong>in</strong>tensity measured <strong>in</strong> the present work for the correspond<strong>in</strong>g transition (see also text). The<br />
excitation energy of each of the three different 8 + states is given <strong>in</strong> parenthesis. The mean <strong>lifetime</strong>s<br />
or mean <strong>lifetime</strong> limits determ<strong>in</strong>ed <strong>in</strong> the present work are also displayed.