Picosecond lifetime measurements in 109Cd and 110Cd
Picosecond lifetime measurements in 109Cd and 110Cd
Picosecond lifetime measurements in 109Cd and 110Cd

You also want an ePaper? Increase the reach of your titles
YUMPU automatically turns print PDFs into web optimized ePapers that Google loves.
164 S. Harissopulos et al. / Nuclear Physics A 683 (2001) 157–181<br />
As po<strong>in</strong>ted out <strong>in</strong> [27], nuclear deorientation is expected to have a significant <strong>in</strong>fluence<br />
to the <strong>in</strong>tensities of γ -transitions deexcit<strong>in</strong>g states with sp<strong>in</strong> J 4. In addition, <strong>in</strong> the<br />
case of E2 γ -transitions (J = 2) this <strong>in</strong>fluence is rather strong at 0 ◦ <strong>and</strong> rather weak<br />
at 55 ◦ . Hence, the ratio of the decay curve of a given excited state derived at a certa<strong>in</strong><br />
angle θ to this determ<strong>in</strong>ed at 55 ◦ , provides a reliable check for possible <strong>in</strong>fluence of the<br />
nuclear deorientation effect. In case this “anisotropy ratio” is constant, the decay curve<br />
derived at the certa<strong>in</strong> angle θ needs no corrections. In the present work, this check has<br />
been partially h<strong>in</strong>dered by the fact that dur<strong>in</strong>g the experiment the detector placed at 55 ◦ has<br />
provided spectra with long left tails <strong>in</strong> the γ -peaks, probably due to neutron damage, <strong>and</strong><br />
also irregular ga<strong>in</strong> shifts, which <strong>in</strong> many cases occurred <strong>in</strong> the same s<strong>in</strong>gle spectrum. Due<br />
to these problems anisotropy ratios have been derived via follow<strong>in</strong>g procedure: the “less<br />
damaged” 55 ◦ -spectra, i.e. the γ -s<strong>in</strong>gles spectra <strong>in</strong>clud<strong>in</strong>g relatively short left tails <strong>and</strong> no<br />
ga<strong>in</strong> shifts, have been normalized to the 260 keV γ -transition of 109 Cd. From the latter<br />
(normalized) spectra, the <strong>in</strong>tensities of the unshifted peak of the 2 + 1 → 0+ 1<br />
γ -transition<br />
of the 110 Cd nucleus have been derived via a very careful <strong>in</strong>tegration procedure. This<br />
procedure has also been carried out for the γ -s<strong>in</strong>gles spectra taken at 160 ◦ . Unfortunately,<br />
the quality of the 55 ◦ spectra did not allow to obta<strong>in</strong> anisotropy ratios for the 4 + 1 → 2+ 1<br />
γ -transition as well. In the follow<strong>in</strong>g, the <strong>in</strong>tensities of the unshifted peak of a γ -transition<br />
i → j obta<strong>in</strong>ed from spectra normalized to the 260 keV γ -transition of 109 Cd, which have<br />
beentakenatanangleθ, will be declared as R ij (x, θ). Hereby, it has to be po<strong>in</strong>ted out that<br />
R ij (x, θ) have not been determ<strong>in</strong>ed from difference spectra like quantities U ij (x).<br />
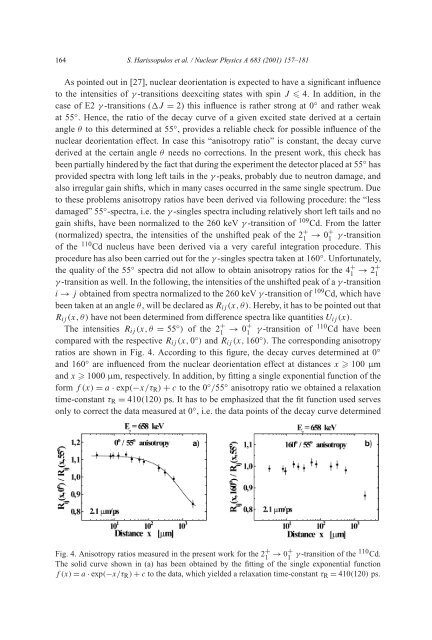
The <strong>in</strong>tensities R ij (x, θ = 55 ◦ ) of the 2 + 1 → 0+ 1<br />
γ -transition of 110 Cd have been<br />
compared with the respective R ij (x, 0 ◦ ) <strong>and</strong> R ij (x, 160 ◦ ). The correspond<strong>in</strong>g anisotropy<br />
ratios are shown <strong>in</strong> Fig. 4. Accord<strong>in</strong>g to this figure, the decay curves determ<strong>in</strong>ed at 0 ◦<br />
<strong>and</strong> 160 ◦ are <strong>in</strong>fluenced from the nuclear deorientation effect at distances x 100 µm<br />
<strong>and</strong> x 1000 µm, respectively. In addition, by fitt<strong>in</strong>g a s<strong>in</strong>gle exponential function of the<br />
form f(x)= a · exp(−x/τ R ) + c to the 0 ◦ /55 ◦ anisotropy ratio we obta<strong>in</strong>ed a relaxation<br />
time-constant τ R = 410(120) ps. It has to be emphasized that the fit function used serves<br />
only to correct the data measured at 0 ◦ , i.e. the data po<strong>in</strong>ts of the decay curve determ<strong>in</strong>ed<br />
Fig. 4. Anisotropy ratios measured <strong>in</strong> the present work for the 2 + 1 → 0+ 1 γ -transition of the 110 Cd.<br />
The solid curve shown <strong>in</strong> (a) has been obta<strong>in</strong>ed by the fitt<strong>in</strong>g of the s<strong>in</strong>gle exponential function<br />
f(x)= a · exp(−x/τ R ) + c to the data, which yielded a relaxation time-constant τ R = 410(120) ps.