"Operation and performance of the NESTOR test detector" Nucl.Instr ...
"Operation and performance of the NESTOR test detector" Nucl.Instr ...
"Operation and performance of the NESTOR test detector" Nucl.Instr ...

You also want an ePaper? Increase the reach of your titles
YUMPU automatically turns print PDFs into web optimized ePapers that Google loves.
ARTICLE IN PRESS<br />
<strong>Nucl</strong>ear <strong>Instr</strong>uments <strong>and</strong> Methods in Physics Research A 552 (2005) 420–439<br />
www.elsevier.com/locate/nima<br />
<strong>Operation</strong> <strong>and</strong> <strong>performance</strong> <strong>of</strong> <strong>the</strong> <strong>NESTOR</strong> <strong>test</strong> detector<br />
G. Aggouras a , E.G. Anassontzis b, , A.E. Ball c , G. Bourlis d , W. Chinowsky e ,<br />
E. Fahrun f , G. Grammatikakis g , C. Green f , P. Grieder h , P. Katrivanos i , P. Koske f ,<br />
A. Leisos a,d , J. Ludvig e , E. Markopoulos a , P. Minkowsky j , D. Nygren e ,<br />
K. Papageorgiou a , G. Przybylski e , L.K. Resvanis a,b , I. Siotis i , J. Sopher e ,<br />
T. Staveris a , V. Tsagli a , A. Tsirigotis a,d , V.A. Zhukov k ,<br />
The <strong>NESTOR</strong> Collaboration<br />
a <strong>NESTOR</strong> Institute for Deep Sea Research, Technology <strong>and</strong> Neutrino Astroparticle Physics, Pylos, Greece<br />
b University <strong>of</strong> A<strong>the</strong>ns, Faculty <strong>of</strong> Physics, <strong>Nucl</strong>ear <strong>and</strong> Particle Physics Department, Panepistimioupolis, 15771 Ilisia, A<strong>the</strong>ns, Greece<br />
c CERN (European Organization for <strong>Nucl</strong>ear Research), Geneva, Switzerl<strong>and</strong><br />
d Hellenic Open University, School <strong>of</strong> Science <strong>and</strong> Technology, Patra, Greece<br />
e Lawrence Berkeley National Laboratory, Berkeley, CA, USA<br />
f University <strong>of</strong> Kiel, Institute <strong>of</strong> Experimental <strong>and</strong> Applied Physics, Germany<br />
g University <strong>of</strong> Crete, Physics Department, Greece<br />
h University <strong>of</strong> Bern, Physikalisches Institut, Switzerl<strong>and</strong><br />
i NCSR ‘‘Demokritos’’, A<strong>the</strong>ns, Greece<br />
j University <strong>of</strong> Bern, Institute for Theoretical Physics, Switzerl<strong>and</strong><br />
k Institute For <strong>Nucl</strong>ear Research, Russian Academy <strong>of</strong> Sciences, Moscow, Russia<br />
Received 2 December 2004; received in revised form 24 June 2005; accepted 30 June 2005<br />
Available online 27 July 2005<br />
Abstract<br />
<strong>NESTOR</strong> is a deep-sea neutrino telescope that is under construction in <strong>the</strong> Ionian Sea <strong>of</strong>f <strong>the</strong> coast <strong>of</strong> Greece at a<br />
depth <strong>of</strong> about 4000 m. This paper briefly reviews <strong>the</strong> detector structure <strong>and</strong> deployment techniques before describing in<br />
detail <strong>the</strong> calibration <strong>and</strong> engineering run <strong>of</strong> a <strong>test</strong> detector carried out in 2003. The detector was operated for more<br />
than 1 month <strong>and</strong> data was continuously transmitted to shore via an electro-optical cable laid on <strong>the</strong> sea floor. The<br />
<strong>performance</strong> <strong>of</strong> <strong>the</strong> detector is discussed <strong>and</strong> analysis <strong>of</strong> <strong>the</strong> data obtained shows that <strong>the</strong> measured cosmic ray muon<br />
flux is in good agreement with previous measurements <strong>and</strong> with phenomenological cosmic ray models.<br />
r 2005 Published by Elsevier B.V.<br />
PACS: 95.55.Vj; 29.40.Ka; 13.15.+g<br />
Keywords: Neutrino; <strong>NESTOR</strong>; Deep-sea; Telescope; <strong>Operation</strong>; Performance<br />
Corresponding author. Tel./fax: +30 210 7276948.<br />
E-mail address: eanason@phys.uoa.gr (E.G. Anassontzis).<br />
0168-9002/$ - see front matter r 2005 Published by Elsevier B.V.<br />
doi:10.1016/j.nima.2005.06.083
ARTICLE IN PRESS<br />
G. Aggouras et al. / <strong>Nucl</strong>ear <strong>Instr</strong>uments <strong>and</strong> Methods in Physics Research A 552 (2005) 420–439 421<br />
1. Introduction<br />
When high-energy neutrinos interact with matter,<br />
some <strong>of</strong> <strong>the</strong> time <strong>the</strong>y produce relativistic<br />
muons that follow closely <strong>the</strong> direction <strong>of</strong> <strong>the</strong><br />
incident neutrinos. When such interactions occur<br />
in <strong>the</strong> sea water or bedrock close to <strong>the</strong> detector,<br />
<strong>the</strong>se muons can be observed by <strong>the</strong> Cherenkov<br />
light that <strong>the</strong>y emit using arrays <strong>of</strong> sensitive optical<br />
detectors: from <strong>the</strong> arrival time <strong>and</strong> intensity <strong>of</strong> <strong>the</strong><br />
light pulses detected, <strong>the</strong> direction <strong>of</strong> <strong>the</strong> muons,<br />
<strong>and</strong> hence those <strong>of</strong> <strong>the</strong> incident neutrinos, can be<br />
reconstructed.<br />
The potential <strong>of</strong> such detectors for astronomy<br />
<strong>and</strong> cosmology has long been recognised. After <strong>the</strong><br />
pioneering work by DUMAND [1] near Hawaii,<br />
detectors are currently operating at Lake Baikal<br />
(Siberia) [2] <strong>and</strong> in ice at <strong>the</strong> South Pole<br />
(AMANDA) [3]. Construction <strong>of</strong> a large array<br />
(ICECUBE [4]) is starting at <strong>the</strong> South Pole <strong>and</strong><br />
<strong>the</strong> need for a complementary detector (1km 3 )in<br />
<strong>the</strong> nor<strong>the</strong>rn hemisphere has led to a number <strong>of</strong><br />
projects in <strong>the</strong> Mediterranean [5–8].<br />
2. Main features <strong>of</strong> <strong>the</strong> <strong>NESTOR</strong> detector, its site<br />
<strong>and</strong> infrastructure<br />
A number <strong>of</strong> reports <strong>and</strong> papers have described<br />
in detail <strong>the</strong> elements <strong>of</strong> <strong>the</strong> <strong>NESTOR</strong> detector<br />
<strong>and</strong> <strong>the</strong> techniques used for its deployment <strong>and</strong><br />
recovery [9–14]. The main features are only briefly<br />
reviewed in this section.<br />
The prerequisites for <strong>the</strong> site are deep (several<br />
km), clear water, low underwater currents, very<br />
low bioluminescent activity, minimal sedimentation<br />
<strong>and</strong> bi<strong>of</strong>ouling rates as well as close proximity<br />
to support infrastructure on shore. The <strong>NESTOR</strong><br />
site in <strong>the</strong> Ionian Sea <strong>of</strong>f <strong>the</strong> southwestern tip<strong>of</strong><br />
<strong>the</strong> Peloponesse fulfils all <strong>the</strong>se requirements.<br />
Extensive surveys in 1989, 1991 <strong>and</strong> 1992 [5,15]<br />
located a large flat plateau <strong>of</strong> 8 9km 2 in area at a<br />
mean depth <strong>of</strong> 4000 m. Situated on <strong>the</strong> side <strong>of</strong> <strong>the</strong><br />
Hellenic Trench that lies between <strong>the</strong> west coast <strong>of</strong><br />
<strong>the</strong> Peloponnese <strong>and</strong> <strong>the</strong> submarine mountain<br />
chain <strong>of</strong> <strong>the</strong> East Mediterranean Ridge, <strong>the</strong> site<br />
is well protected from major deep-water perturbations.<br />
The deepest water in <strong>the</strong> Mediterranean at<br />
5200 m is a few miles away from <strong>the</strong> <strong>NESTOR</strong> site.<br />
Very deepwater is essential in reducing <strong>the</strong><br />
principal background from muons produced by<br />
cosmic rays interacting in <strong>the</strong> Earth’s atmosphere.<br />
Also biological activity diminishes with depth.<br />
The location 1 is 7.5 nautical miles from <strong>the</strong><br />
isl<strong>and</strong> <strong>of</strong> Sapienza, where <strong>the</strong>re are two small<br />
harbours, <strong>and</strong> 11 miles from <strong>the</strong> port <strong>of</strong> Methoni,<br />
while substantial port facilities are available 15<br />
miles away in <strong>the</strong> town <strong>of</strong> Pylos on <strong>the</strong> bay <strong>of</strong><br />
Navarino.<br />
Regular measurements [16,17] <strong>of</strong> water quality<br />
show transmission lengths <strong>of</strong> 55710 m at a<br />
wavelength <strong>of</strong> 460 nm, stable temperatures <strong>of</strong><br />
14.2 1C <strong>and</strong> water current velocities well below<br />
10 cm/s [18], light bursts <strong>of</strong> 1–10 s duration,<br />
consistent with bioluminescent activity, represent<br />
around 1% <strong>of</strong> <strong>the</strong> active time <strong>and</strong> <strong>the</strong>re is little/no<br />
evidence <strong>of</strong> problems due to sedimentation or<br />
bi<strong>of</strong>ouling [19]. The sea bottom over <strong>the</strong> site has a<br />
clay deposit accumulated over some tens <strong>of</strong><br />
thous<strong>and</strong>s <strong>of</strong> years which provides for good<br />
anchoring [20].<br />
A shore station has been established in Methoni<br />
where <strong>the</strong> l<strong>and</strong> end <strong>of</strong> <strong>the</strong> 30 km long electrooptical<br />
cable is terminated. The main DC power<br />
converter for <strong>the</strong> electrical supply, <strong>the</strong> monitoring<br />
<strong>and</strong> control systems <strong>and</strong> <strong>the</strong> l<strong>and</strong> end <strong>of</strong> <strong>the</strong> data<br />
acquisition system are located in <strong>the</strong> Methoni<br />
building.<br />
The basic element <strong>of</strong> <strong>the</strong> <strong>NESTOR</strong> detector is a<br />
hexagonal floor or star. Six arms, built from<br />
titanium tubes to form a lightweight lattice girder,<br />
are attached to a central casing. Two optical<br />
modules are attached at <strong>the</strong> end <strong>of</strong> each <strong>of</strong> <strong>the</strong><br />
arms, one facing upwards <strong>and</strong> <strong>the</strong> o<strong>the</strong>r downwards.<br />
The electronics for <strong>the</strong> floor is housed in a<br />
1 m diameter titanium sphere within <strong>the</strong> central<br />
casing. The nominal floor diameter at <strong>the</strong> optical<br />
modules is 32 m.<br />
A full <strong>NESTOR</strong> tower would consist <strong>of</strong> 12 such<br />
floors stacked vertically with a spacing <strong>of</strong> 30 m<br />
between floors. This is te<strong>the</strong>red to a sea bottom<br />
unit (pyramid) [14] that contains <strong>the</strong> anchor, <strong>the</strong><br />
junction box, several environmental sensors <strong>and</strong><br />
<strong>the</strong> sea electrode that provides <strong>the</strong> electrical power<br />
1 Site coordinates: 361 37.5 0 N, 21134.6 0 E.
ARTICLE IN PRESS<br />
422<br />
G. Aggouras et al. / <strong>Nucl</strong>ear <strong>Instr</strong>uments <strong>and</strong> Methods in Physics Research A 552 (2005) 420–439<br />
return path to shore. The junction box houses <strong>the</strong><br />
termination <strong>of</strong> <strong>the</strong> sea-end <strong>of</strong> <strong>the</strong> electro-optical<br />
cable, <strong>the</strong> fan-outs for optical fibres <strong>and</strong> power to<br />
<strong>the</strong> floors, etc. as well as monitoring <strong>and</strong> protection<br />
<strong>of</strong> <strong>the</strong> electrical system.<br />
The optical module [21] consists <strong>of</strong> a 15 00<br />
diameter photomultiplier tube (pmt) enclosed in<br />
a spherical glass housing which can withst<strong>and</strong> <strong>the</strong><br />
hydrostatic pressure up to 630 atm. To reduce <strong>the</strong><br />
effect <strong>of</strong> <strong>the</strong> terrestrial magnetic field, <strong>the</strong> pmt is<br />
surrounded by a high magnetic permeability cage<br />
[1]. Optical coupling <strong>of</strong> <strong>the</strong> pmt to <strong>the</strong> glass sphere<br />
is made with glycerine, sealed by a transparent<br />
silicon gel gasket. The high voltage for each pmt is<br />
generated by a DC–DC converter within <strong>the</strong> glass<br />
sphere. The pmt signal, 24 V power, control <strong>and</strong><br />
monitoring signals are connected through a single<br />
7-pin connector <strong>and</strong> hybrid cable to <strong>the</strong> central<br />
titanium sphere with <strong>the</strong> floor electronics.<br />
O<strong>the</strong>r modules, above <strong>and</strong> below each floor,<br />
house LED flasher units that are used for<br />
calibration <strong>of</strong> <strong>the</strong> detector <strong>and</strong> <strong>the</strong>y are controlled<br />
<strong>and</strong> triggered from <strong>the</strong> floor electronics.<br />
Deployed [14] equipment is brought to <strong>the</strong><br />
surface, toge<strong>the</strong>r with <strong>the</strong> sea end <strong>of</strong> <strong>the</strong> electrooptical<br />
cable, by means <strong>of</strong> a recovery rope,<br />
released from <strong>the</strong> sea bottom by coded acoustic<br />
signal. Modifications or additions to <strong>the</strong> experimental<br />
package are made at <strong>the</strong> surface <strong>and</strong> all<br />
connections are made in <strong>the</strong> air with dry-mating<br />
connectors. The cable <strong>and</strong> experiment systems are<br />
<strong>the</strong>n re-deployed <strong>and</strong> <strong>the</strong> recovery rope, with its<br />
acoustic release laid on <strong>the</strong> seabed.<br />
The <strong>NESTOR</strong> deployment ‘philosophy’ has<br />
always been to avoid <strong>the</strong> need for specialised<br />
manned or unmanned underwater vehicles for<br />
deployment <strong>and</strong> recovery operations that require<br />
<strong>the</strong> use <strong>of</strong> manipulators, wet-mating connecters<br />
<strong>and</strong> consequent high costs. All electrical <strong>and</strong><br />
optical fibre connections are dry mated in <strong>the</strong> air.<br />
The objectives for <strong>the</strong> deployment reported in<br />
this paper were to <strong>test</strong> fully <strong>the</strong> electrical supply<br />
<strong>and</strong> distribution systems, <strong>the</strong> monitoring <strong>and</strong><br />
control systems <strong>and</strong> <strong>the</strong> full data acquisition <strong>and</strong><br />
transmission chain from <strong>the</strong> sea to <strong>the</strong> shore<br />
station (each <strong>NESTOR</strong> floor is independent from<br />
<strong>the</strong> o<strong>the</strong>rs with respect to electrical power supply<br />
<strong>and</strong> data acquisition <strong>and</strong> transmission).<br />
The electro-optical cable <strong>and</strong> <strong>the</strong> sea bottom<br />
pyramid, which had been deployed in previous<br />
operations, were brought to <strong>the</strong> surface. A<br />
detector star with 12 optical modules was<br />
attached, cabled to <strong>the</strong> junction box <strong>and</strong> redeployed<br />
to 3800 m.<br />
The titanium girder arms <strong>of</strong> <strong>the</strong> stars are made<br />
in st<strong>and</strong>ard modules <strong>of</strong> 5-m length; for logistical<br />
reasons on <strong>the</strong> deployment vessel, <strong>the</strong> star used for<br />
this experiment has an overall diameter <strong>of</strong> 12 m. In<br />
all o<strong>the</strong>r respects st<strong>and</strong>ard equipment was used.<br />
The detector star is located 80 m above <strong>the</strong> sea<br />
bottom pyramid. The system was powered <strong>and</strong><br />
monitored during deployment while <strong>the</strong> pmts were<br />
switched on a few hours later when <strong>the</strong>y had<br />
reached a quiescent state after brief exposure to<br />
daylight.<br />
The system was operated continuously for more<br />
than a month <strong>and</strong> several million triggers recorded.<br />
This has not only provided invaluable<br />
experience on <strong>the</strong> operation <strong>of</strong> <strong>the</strong> detector but has<br />
initiated <strong>the</strong> development <strong>and</strong> <strong>test</strong>ing <strong>of</strong> powerful<br />
tools for reconstruction <strong>and</strong> analysis.<br />
3. Readout, control <strong>and</strong> data acquisition systems<br />
In <strong>the</strong> Ti-sphere, <strong>the</strong> electronics [24] is divided<br />
into two main units, <strong>the</strong> Housekeeping Board that<br />
h<strong>and</strong>les <strong>the</strong> system monitoring <strong>and</strong> control functions,<br />
<strong>and</strong> <strong>the</strong> Floor Board [23] that h<strong>and</strong>les signal<br />
treatment <strong>and</strong> communications. The two boards,<br />
connected by flat cable, are mounted on an<br />
aluminum sub-frame that also carries <strong>the</strong> local<br />
sensors <strong>and</strong> DC–DC converters. All connections<br />
from outside <strong>of</strong> <strong>the</strong> sphere are routed via patch<br />
panels on <strong>the</strong> sub-frame so that <strong>the</strong> complete unit<br />
can be removed <strong>and</strong> fully <strong>test</strong>ed in <strong>the</strong> laboratory<br />
or connected through <strong>the</strong> ‘sea’ connectors in <strong>the</strong><br />
Ti-sphere. The sub-frame is electrically isolated<br />
from <strong>the</strong> sphere.<br />
In <strong>the</strong> Shore Station counting room, all communication<br />
with <strong>the</strong> deployed detector floor are<br />
h<strong>and</strong>led by a single electronics board, <strong>the</strong> Shore<br />
Board [22,23] that sits on <strong>the</strong> EISA bus <strong>of</strong> <strong>the</strong> main<br />
server in <strong>the</strong> Data Acquisition (DAQ) computer<br />
cluster. Connection between <strong>the</strong> Shore <strong>and</strong> Floor
ARTICLE IN PRESS<br />
G. Aggouras et al. / <strong>Nucl</strong>ear <strong>Instr</strong>uments <strong>and</strong> Methods in Physics Research A 552 (2005) 420–439 423<br />
Board is via two monomode optical fibres in <strong>the</strong><br />
electro-optical cable.<br />
The Shore Board receives <strong>the</strong> data packages via<br />
<strong>the</strong> ‘up-link’, which are stored temporarily in local<br />
buffers. It broadcasts a global 40 MHz clock signal<br />
via <strong>the</strong> ‘down-link’ to <strong>the</strong> Floor Board, sends<br />
comm<strong>and</strong>s to set <strong>the</strong> run or calibration parameters<br />
<strong>and</strong> initiates functions to be executed by <strong>the</strong><br />
Housekeeping board. The ‘down-link’ can also<br />
be used to re-program <strong>the</strong> FPGA/PLDs within <strong>the</strong><br />
Floor Board <strong>and</strong> change <strong>the</strong> trigger logic parameters.<br />
The Housekeeping Board controls <strong>the</strong> distribution<br />
<strong>of</strong> power to <strong>the</strong> pmts as well as setting <strong>and</strong><br />
monitoring <strong>the</strong> pmt’s high voltage supply that is<br />
generated within <strong>the</strong> optical modules. The board<br />
also records information from <strong>the</strong> environmental<br />
sensors (compass <strong>and</strong> tilt meters, <strong>the</strong>rmometers,<br />
humidity <strong>and</strong> hygrometry) inside <strong>the</strong> Ti-sphere<br />
<strong>and</strong> from o<strong>the</strong>r sensors (e.g. water pressure <strong>and</strong><br />
water current meters) that can be mounted<br />
externally. The Housekeeping Board also operates<br />
<strong>the</strong> LED flasher units <strong>of</strong> <strong>the</strong> calibration system.<br />
The Floor Board h<strong>and</strong>les <strong>the</strong> pmt signal sensing,<br />
majority logic event triggering, waveform capture,<br />
digitization <strong>and</strong> event formatting [23,24]. It also<br />
h<strong>and</strong>les <strong>the</strong> communications with <strong>the</strong> shore board,<br />
<strong>the</strong> ‘up-link’ sending <strong>the</strong> data to shore <strong>and</strong> <strong>the</strong><br />
‘down-link’ receiving <strong>the</strong> clock signal, comm<strong>and</strong>s<br />
<strong>and</strong> downloads <strong>of</strong> operational parameters.<br />
The heart <strong>of</strong> <strong>the</strong> DAQ system is a novel ASIC<br />
developed at LBNL, <strong>the</strong> ‘‘Analog Transient<br />
Waveform Digitizer’’ (ATWD) [25]. Each ATWD<br />
has four channels, each with 128 common-ramp,<br />
10-bit, Wilkinson ADCs that, after activation,<br />
digitize all 128 samples <strong>of</strong> a selected channel. An<br />
active delay line generates <strong>the</strong> sampling so that no<br />
clocks are involved in waveform capture. The<br />
sampling rate is determined by a single external<br />
current <strong>and</strong> may be varied from 200 M samples/s<br />
to 2 G samples/s.<br />
A sampling speed <strong>of</strong> 273 M samples/s was<br />
selected in order to capture <strong>the</strong> pmt signals <strong>and</strong><br />
to recognize overlapping pulses, giving a sampling<br />
period <strong>of</strong> 3.66 ns. This gives a dynamical range<br />
(active time window) for each ATWD channel <strong>of</strong><br />
465 ns. There are five ATWDs on <strong>the</strong> Floor Board,<br />
providing 20 digitization channels. Twelve are<br />
used to digitize <strong>the</strong> pmt waveforms whilst five<br />
channels (one per ATWD) are used to digitize <strong>the</strong><br />
waveform <strong>of</strong> <strong>the</strong> 40 MHz clock signal, broadcast<br />
from <strong>the</strong> shore board; this gives a continuous<br />
check <strong>of</strong> <strong>the</strong> sampling interval stability. A fur<strong>the</strong>r<br />
channel is used to digitize <strong>the</strong> trigger majority logic<br />
signal to provide information for <strong>the</strong> synchronization<br />
<strong>and</strong> timing checks. The last two channels are<br />
used for internal calibration functions. A fur<strong>the</strong>r<br />
feature <strong>of</strong> <strong>the</strong> floor board is a st<strong>and</strong>ard pulse<br />
generator: in calibration mode, <strong>the</strong> pulse can be<br />
applied to all ATWD ‘data’ channels <strong>and</strong> digitized<br />
to continuously calibrate <strong>the</strong> gain <strong>of</strong> each channel.<br />
An event selection trigger is generated when <strong>the</strong><br />
majority coincidence requirement between pmt<br />
signals above a certain threshold level (typically<br />
30 mV), is satisfied. The trigger window is adjustable<br />
to cover different maximum distances<br />
between <strong>the</strong> optical modules. With <strong>the</strong> physical<br />
layout <strong>of</strong> <strong>the</strong> detector floor presently deployed<br />
(12 m diameter), <strong>the</strong> trigger window was set at<br />
60 ns, corresponding to <strong>the</strong> luminal transit time<br />
across <strong>the</strong> detector.<br />
The leading edge <strong>of</strong> <strong>the</strong> majority logic signal<br />
(corresponding to <strong>the</strong> time when <strong>the</strong> last <strong>of</strong> <strong>the</strong><br />
pmt pulses participating in <strong>the</strong> trigger crosses <strong>the</strong><br />
threshold level) is used to define <strong>the</strong> absolute time 2<br />
<strong>of</strong> <strong>the</strong> trigger occurrence with respect to <strong>the</strong><br />
40 MHz clock. The occurrence <strong>of</strong> <strong>the</strong> trigger<br />
initiates waveform capture by <strong>the</strong> ATWDs, reading<br />
<strong>of</strong> <strong>the</strong> environmental parameters <strong>and</strong> data<br />
transmission to <strong>the</strong> shore. The relative delays<br />
between <strong>the</strong> electronics cause <strong>the</strong> event trigger to<br />
occur at 197.5 ns within <strong>the</strong> ATWD time window.<br />
It is also possible to generate a forced trigger by<br />
comm<strong>and</strong> from <strong>the</strong> shore control system that<br />
initiates digitization <strong>and</strong> data transmission. This<br />
<strong>test</strong> function is especially useful for taking data<br />
during <strong>the</strong> deployment operations when <strong>the</strong> pmts<br />
are not powered.<br />
The sampling period, as well as <strong>the</strong> gains <strong>of</strong> <strong>the</strong><br />
ATWD channels have been continuously moni-<br />
2 This timestampcharacterizes <strong>the</strong> time <strong>of</strong> occurrence <strong>of</strong> a<br />
floor event. It is transmitted to <strong>the</strong> shore inside <strong>the</strong> data<br />
package <strong>and</strong> in a future multi-floor <strong>NESTOR</strong> detector will be<br />
used to build a global event by combining experimental<br />
information from several floors.
ARTICLE IN PRESS<br />
424<br />
G. Aggouras et al. / <strong>Nucl</strong>ear <strong>Instr</strong>uments <strong>and</strong> Methods in Physics Research A 552 (2005) 420–439<br />
Fig. 1. Distribution <strong>of</strong> <strong>the</strong> sampling intervals <strong>of</strong> an ATWD<br />
estimated on an event-by-event basis, during data taking. The<br />
curve corresponds to a Gaussian function <strong>of</strong> mean value <strong>and</strong><br />
sigma equal to 3.66 ns <strong>and</strong> 5 ps, respectively.<br />
tored <strong>and</strong> found extremely stable during long time<br />
periods. Fig. 1 shows <strong>the</strong> stability <strong>of</strong> <strong>the</strong> ATWD<br />
sampling during a long data-taking run. Each<br />
entry to <strong>the</strong> histogram is an estimated value <strong>of</strong> <strong>the</strong><br />
sampling interval, using <strong>the</strong> digitized waveforms <strong>of</strong><br />
<strong>the</strong> 40 MHz clock in an event. The st<strong>and</strong>ard<br />
deviation <strong>of</strong> this distribution is 5 ps, which is<br />
negligible compared to <strong>the</strong> mean value <strong>of</strong> <strong>the</strong><br />
sampling interval <strong>of</strong> 3.66 ns.<br />
The DAQ computer cluster at <strong>the</strong> shore<br />
laboratory consists <strong>of</strong> three distinct subsystems,<br />
<strong>the</strong> Server, <strong>the</strong> Fast Monitor <strong>and</strong> <strong>the</strong> Data Quality<br />
Checking subsystem, performing <strong>the</strong> following<br />
complementary tasks:<br />
(i) The Server subsystem controls, through <strong>the</strong><br />
Shore Board, <strong>the</strong> experimental parameters,<br />
<strong>the</strong> main functions <strong>of</strong> <strong>the</strong> DAQ <strong>and</strong> receives<br />
<strong>the</strong> data streams. After a fast structural check<br />
<strong>of</strong> <strong>the</strong> data packages, it builds event files <strong>and</strong><br />
manages <strong>the</strong> recording on <strong>the</strong> storage media<br />
(hard discs <strong>and</strong> CD-ROMs). In parallel, it<br />
provides sample event files to <strong>the</strong> Fast<br />
Monitor subsystem. These are groups <strong>of</strong> 13<br />
consecutive events picked up uniformly in<br />
time from <strong>the</strong> data stream. The period <strong>of</strong> this<br />
event sample selection can be adjusted according<br />
to <strong>the</strong> needs <strong>of</strong> <strong>the</strong> run. A typical selection<br />
period, when <strong>the</strong> experiment runs with a<br />
trigger rate <strong>of</strong> about 4 Hz is <strong>of</strong> <strong>the</strong> order <strong>of</strong><br />
10 s. This subsystem is also responsible for <strong>the</strong><br />
construction <strong>and</strong> updating <strong>of</strong> a database<br />
(electronic logbook) containing detailed information<br />
about <strong>the</strong> DAQ status, as well as<br />
<strong>the</strong> summary <strong>of</strong> <strong>the</strong> experimental parameters<br />
<strong>and</strong> <strong>the</strong> environmental conditions relative to<br />
each data file.<br />
(ii) The Fast Monitor subsystem runs an interactive<br />
s<strong>of</strong>tware package, developed in Lab-<br />
View. This package uses <strong>the</strong> sample event files<br />
provided by <strong>the</strong> Server subsystem, performs<br />
fast analysis operations, builds parameter files<br />
<strong>and</strong> histograms within an interactive, graphic<br />
display environment.<br />
The environmental conditions <strong>of</strong> <strong>the</strong> detector<br />
are continuously monitored, such as <strong>the</strong> floor<br />
orientation (compass <strong>and</strong> tilt meters), <strong>the</strong><br />
temperatures, humidity <strong>and</strong> hygrometry within<br />
<strong>the</strong> titanium sphere, <strong>the</strong> external water<br />
temperature <strong>and</strong> pressure <strong>and</strong> data from o<strong>the</strong>r<br />
environmental instruments mounted on <strong>the</strong><br />
sea bottom station (pyramid). In addition, <strong>the</strong><br />
electrical power distribution network <strong>and</strong> <strong>the</strong><br />
high voltages applied to <strong>the</strong> pmts, <strong>the</strong> pmt<br />
counting rates, <strong>the</strong> trigger rates, majority logic<br />
rates as well as o<strong>the</strong>r parameters relative to<br />
DAQ <strong>performance</strong> (dead time, number <strong>of</strong><br />
corrupted events, etc.) are also monitored<br />
continuously.<br />
An alarm network within <strong>the</strong> Fast Monitor<br />
subsystem is activated when any <strong>of</strong> <strong>the</strong><br />
monitored parameters is found outside <strong>the</strong><br />
predefined tolerance windows. The Fast<br />
Monitor also builds summary files on dem<strong>and</strong><br />
<strong>and</strong> records information in <strong>the</strong> electronic<br />
logbook. The event display feature gives <strong>the</strong><br />
operator an opportunity to quickly check <strong>the</strong><br />
pmt waveform digitization, during data taking.<br />
(iii) The Data Quality Checking subsystem performs<br />
a fast reconstruction analysis on small<br />
subsets <strong>of</strong> <strong>the</strong> accumulated events during data
ARTICLE IN PRESS<br />
G. Aggouras et al. / <strong>Nucl</strong>ear <strong>Instr</strong>uments <strong>and</strong> Methods in Physics Research A 552 (2005) 420–439 425<br />
taking to check <strong>the</strong> integrity <strong>of</strong> <strong>the</strong> data <strong>and</strong><br />
ensure that <strong>the</strong> selection trigger is unbiased. It<br />
complements <strong>the</strong> Fast Monitor by performing<br />
detailed signal processing (as described in<br />
Section 4) <strong>and</strong> provides additional information<br />
on <strong>the</strong> <strong>performance</strong> <strong>of</strong> <strong>the</strong> pmts, <strong>the</strong><br />
triggering, digitization <strong>and</strong> readout electronics.<br />
This includes <strong>the</strong> stability 3 <strong>of</strong>, <strong>the</strong> pmt<br />
pulse height distributions, <strong>the</strong> ATWD gain<br />
<strong>and</strong> sampling interval, <strong>the</strong> majority coincidence<br />
rate <strong>and</strong> <strong>the</strong> distribution <strong>of</strong> <strong>the</strong> total<br />
number <strong>of</strong> photoelectrons inside <strong>the</strong> trigger<br />
window. Fur<strong>the</strong>rmore, it checks <strong>the</strong> trigger<br />
formation <strong>and</strong> timing with respect to <strong>the</strong><br />
digitized pmt pulses <strong>and</strong> <strong>the</strong> dependence <strong>of</strong> <strong>the</strong><br />
total number <strong>of</strong> accumulated photoelectrons<br />
inside <strong>the</strong> coincidence window 4 to <strong>the</strong> coincidence<br />
level. The subsystem provides a fast<br />
track, ‘on-line’ reconstruction on <strong>the</strong> hypo<strong>the</strong>sis<br />
that <strong>the</strong> data corresponds to muons<br />
passing through <strong>the</strong> fiducial volume <strong>of</strong> <strong>the</strong><br />
detector.<br />
4. Detector calibration <strong>and</strong> signal processing<br />
t d ¼ 250 ns, Z ¼ 75 O, rise time r t ¼ 12 ns). In<br />
order to reconstruct <strong>the</strong> original pmt pulse properties,<br />
<strong>the</strong> digitized waveforms must be corrected.<br />
This correction has an important effect on <strong>the</strong><br />
estimation <strong>of</strong> arrival time <strong>of</strong> <strong>the</strong> pmt pulse <strong>and</strong><br />
consequently on <strong>the</strong> tracking accuracy (e.g. muon<br />
direction resolution) <strong>of</strong> <strong>the</strong> detector.<br />
Each individual pmt transmission line, including<br />
<strong>the</strong> cable from <strong>the</strong> pmt to <strong>the</strong> Floor Board <strong>and</strong> all<br />
corresponding passive <strong>and</strong> active electronic elements<br />
upto <strong>the</strong> ATWD, has been calibrated <strong>and</strong><br />
<strong>the</strong> signal attenuation measured in <strong>the</strong> laboratory<br />
before deployment <strong>of</strong> <strong>the</strong> detector. A very narrow<br />
electronic pulse was propagated through each pmt<br />
transmission line <strong>and</strong> digitized at <strong>the</strong> corresponding<br />
ATWD channel. The Fourier spectra <strong>of</strong> <strong>the</strong><br />
input pulse <strong>and</strong> <strong>the</strong> digitized waveform (after<br />
pedestal subtraction) were compared to produce a<br />
signal attenuation correction as a function <strong>of</strong><br />
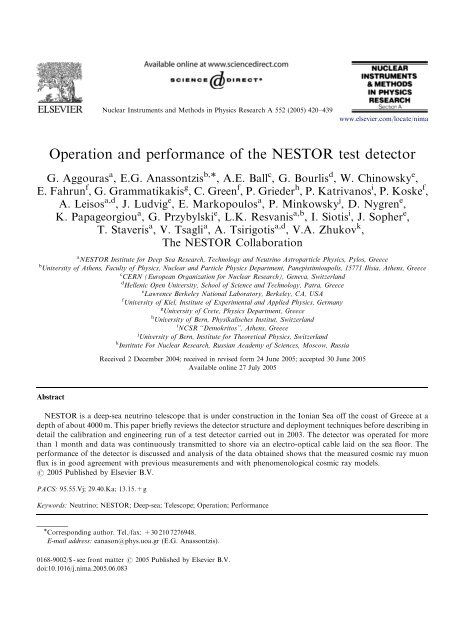
frequency, <strong>the</strong> ‘so-called’ response function. Fig. 2<br />
shows <strong>the</strong> amplitude <strong>and</strong> phase <strong>of</strong> <strong>the</strong> response<br />
function for a typical transmission line. The<br />
response function is estimated by using a large<br />
number <strong>of</strong> identical narrow pulses, with<br />
FWHME4 ns, sent through <strong>the</strong> transmission lines<br />
Each <strong>of</strong> <strong>the</strong> 128 Wilkinson ADCs <strong>of</strong> an ATWD<br />
channel has its own pedestal. This has to be<br />
subtracted from <strong>the</strong> digitized pmt waveform, on a<br />
sample-by-sample basis, in order to bring <strong>the</strong> base<br />
line to zero. The measurement <strong>of</strong> <strong>the</strong> pedestals was<br />
made in <strong>the</strong> laboratory before <strong>the</strong> deployment.<br />
The stability <strong>of</strong> <strong>the</strong> pedestals was checked 5 using<br />
<strong>the</strong> accumulated data during <strong>the</strong> 2003 run <strong>and</strong> was<br />
found to remain constant with variations <strong>of</strong> less<br />
than 1% over time.<br />
The propagation <strong>of</strong> <strong>the</strong> pmt signals through <strong>the</strong><br />
transmission lines to <strong>the</strong> ATWDs causes amplitude<br />
attenuation <strong>and</strong> broadening <strong>of</strong> <strong>the</strong> pulse shape.<br />
This is mainly due to <strong>the</strong> delay lines just before <strong>the</strong><br />
pulse reaches <strong>the</strong> ATWDs (AV1258, time delay<br />
3 Under constant event selection criteria.<br />
4 This is <strong>the</strong> sum <strong>of</strong> <strong>the</strong> pmt pulse heights (in units <strong>of</strong> <strong>the</strong> mean<br />
value <strong>of</strong> <strong>the</strong> one-photoelectron pulse height distribution) inside<br />
<strong>the</strong> coincidence window.<br />
5 When collecting data with a 4-fold coincidence trigger, <strong>the</strong><br />
majority <strong>of</strong> <strong>the</strong> events contain 8 empty ATWD channels.<br />
Fig. 2. The amplitude <strong>and</strong> phase <strong>of</strong> <strong>the</strong> response function <strong>of</strong> a<br />
PMT transmission line using narrow pulses (FWHME4 ns,<br />
dots) <strong>and</strong> wider pulses (FWHME10 ns, small stars).
ARTICLE IN PRESS<br />
426<br />
G. Aggouras et al. / <strong>Nucl</strong>ear <strong>Instr</strong>uments <strong>and</strong> Methods in Physics Research A 552 (2005) 420–439<br />
<strong>and</strong> digitized by <strong>the</strong> ATWDs. The statistical<br />
uncertainty <strong>of</strong> <strong>the</strong> response function, as is shown<br />
in Fig. 2 (points) is very small (<strong>the</strong> error bars in<br />
Fig. 2 represents <strong>the</strong> spread <strong>of</strong> <strong>the</strong> estimate <strong>of</strong> <strong>the</strong><br />
response function). The spread <strong>of</strong> <strong>the</strong> amplitude <strong>of</strong><br />
<strong>the</strong> response function is very small for frequencies<br />
below 70 MHz. Similarly, <strong>the</strong> spread <strong>of</strong> <strong>the</strong> phase<br />
<strong>of</strong> <strong>the</strong> response function becomes large for<br />
frequencies greater than 70 MHz. In order to<br />
check for systematic errors, <strong>the</strong> response function<br />
is also estimated (stars in Fig. 2) by using a wider<br />
<strong>test</strong> pulse with FWHME10 ns, 6 (<strong>the</strong> shape <strong>of</strong> <strong>the</strong>se<br />
<strong>test</strong> pulses is similar to a sine wave). It is obvious<br />
from <strong>the</strong> figure that this response function deviates<br />
from <strong>the</strong> previous one for frequencies greater than<br />
65 MHz. This is expected because, when using a<br />
wider <strong>test</strong> pulse, <strong>the</strong> power spectrum <strong>of</strong> <strong>the</strong> pulse<br />
becomes smaller for high frequencies <strong>and</strong> that is<br />
where <strong>the</strong> electronic noise dominates; for this<br />
reason we do not use <strong>the</strong>se high frequencies (see<br />
below).<br />
Moreover, it has been verified in <strong>the</strong> laboratory<br />
that, by applying <strong>the</strong>se corrections to <strong>the</strong> digitized<br />
pmt pulses, <strong>the</strong> original shape <strong>and</strong> amplitude<br />
characteristics <strong>of</strong> <strong>the</strong> pulses are recovered. Fig. 3<br />
shows a typical input <strong>test</strong> pulse (generated with a<br />
pulse generator) on a high-resolution digital<br />
oscilloscope (points), <strong>the</strong> output <strong>of</strong> <strong>the</strong> ATWDs<br />
after <strong>the</strong> pedestal subtraction, <strong>the</strong> quadratic<br />
interpolation <strong>and</strong> <strong>the</strong> electronic noise subtraction<br />
described below (dashed line) <strong>and</strong> <strong>the</strong> reconstructed<br />
pulse after <strong>the</strong> attenuation correction<br />
(solid line). As can be seen from <strong>the</strong> figure, <strong>the</strong><br />
original <strong>and</strong> reconstructed pulses agree very well.<br />
It has been verified with high statistics that <strong>the</strong><br />
amplitude <strong>of</strong> <strong>the</strong> reconstructed pulse agree with<br />
<strong>the</strong> amplitude <strong>of</strong> <strong>the</strong> original pulse with an<br />
accuracy <strong>of</strong> a few percent. The pulse shape<br />
agreement is discussed in detail below.<br />
Fig. 4 gives an example <strong>of</strong> <strong>the</strong> first two stages <strong>of</strong><br />
st<strong>and</strong>ard processing <strong>of</strong> <strong>the</strong> digitized waveforms.<br />
First, <strong>the</strong> pedestals are subtracted on a sample-bysample<br />
basis. Extra points, between <strong>the</strong> 128<br />
original samples <strong>of</strong> <strong>the</strong> digitized waveform are<br />
estimated by means <strong>of</strong> a quadratic interpolation.<br />
6 The FWHM <strong>of</strong> a typical pmt pulse at <strong>the</strong> single photoelectron<br />
level is about 10 ns.<br />
Fig. 3. A typical input <strong>test</strong> pulse (generated with a pulse<br />
generator) on a high-resolution digital oscilloscope (points), <strong>the</strong><br />
output <strong>of</strong> <strong>the</strong> ATWDs after <strong>the</strong> pedestal subtraction, <strong>the</strong><br />
quadratic interpolation <strong>and</strong> <strong>the</strong> electronic noise subtraction<br />
(dashed line) <strong>and</strong> <strong>the</strong> reconstructed pulse after <strong>the</strong> attenuation<br />
correction (solid line).<br />
Fig. 4. Demonstration <strong>of</strong> <strong>the</strong> signal processing stages <strong>of</strong> a PMT<br />
pulse. Top: The raw digitized waveform (ATWD output).<br />
Middle: The waveform after pedestal subtraction, sample<br />
number to time <strong>and</strong> ATWD count to voltage conversion.<br />
Bottom: The recovered waveform after <strong>the</strong> attenuation correction<br />
<strong>and</strong> application <strong>of</strong> filters.<br />
The coordinates are transformed to voltage (mV)<br />
<strong>and</strong> time (ns), using <strong>the</strong> known ATWD gains<br />
<strong>and</strong> sampling intervals, respectively. Then <strong>the</strong>
ARTICLE IN PRESS<br />
G. Aggouras et al. / <strong>Nucl</strong>ear <strong>Instr</strong>uments <strong>and</strong> Methods in Physics Research A 552 (2005) 420–439 427<br />
waveform undergoes a discrete Fourier transformation.<br />
The Fourier coefficients are modified<br />
using <strong>the</strong> corresponding attenuation corrections.<br />
The corrected waveform is recovered by means <strong>of</strong><br />
an inverse Fourier transformation. The small<br />
ripples that can be seen in Figs. 4 <strong>and</strong> 6 are<br />
remnants <strong>of</strong> electronic noise picked up by <strong>the</strong><br />
ATWD channels. The pattern <strong>of</strong> this noise has<br />
been identified for each ATWD channel <strong>and</strong> is<br />
subtracted on a sample-by-sample basis; but some<br />
<strong>of</strong> it remains after <strong>the</strong> subtraction. In order to<br />
minimize this effect, <strong>the</strong> following filters were<br />
applied to <strong>the</strong> raw waveforms: (a) smoothing <strong>of</strong><br />
<strong>the</strong> waveform in regions <strong>of</strong> <strong>the</strong> ATWD active time<br />
window where <strong>the</strong>re is no pulse greater than 15 mV<br />
(<strong>the</strong> pmt threshold is 30 mV <strong>and</strong> <strong>the</strong> pulse height<br />
attenuation correction is always smaller than a<br />
factor <strong>of</strong> 2), <strong>and</strong> (b) cutting <strong>of</strong>f <strong>the</strong> contribution <strong>of</strong><br />
<strong>the</strong> frequencies above 60–70 MHz (depending on<br />
<strong>the</strong> ATWD channel) in <strong>the</strong> raw pulse before <strong>the</strong><br />
attenuation correction. The result <strong>of</strong> this is a loss<br />
<strong>of</strong> some information <strong>of</strong> <strong>the</strong> raw waveform.<br />
However this has an insignificant effect on signal<br />
processing, as can be seen in Fig. 3.<br />
The pmt pulse arrival time is defined after this<br />
stage, as <strong>the</strong> time where <strong>the</strong> tangent to <strong>the</strong> rising<br />
edge <strong>of</strong> <strong>the</strong> pulse shape at <strong>the</strong> inflection point<br />
intersects with <strong>the</strong> base line. This definition is<br />
found to be <strong>the</strong> least dependent on <strong>the</strong> pulse<br />
amplitude (slewing). Note that for some checks<br />
<strong>and</strong> comparisons with <strong>the</strong> hardware trigger, <strong>the</strong><br />
arrival time is taken to be <strong>the</strong> time when <strong>the</strong> rising<br />
edge <strong>of</strong> <strong>the</strong> pmt pulse crosses a threshold level<br />
(typically 30 mV).<br />
Along with <strong>the</strong> digitized pmt waveforms, <strong>the</strong><br />
Floor Board sends to <strong>the</strong> shore <strong>the</strong> digitized<br />
waveform <strong>of</strong> <strong>the</strong> trigger majority logic signal that<br />
is generated in <strong>the</strong> trigger circuit <strong>of</strong> <strong>the</strong> Floor<br />
Board. The falling edge <strong>of</strong> <strong>the</strong> trigger signal<br />
initializes <strong>the</strong> pmt waveform capture from <strong>the</strong><br />
ATWDs. The digitized trigger signal has a time<br />
stability <strong>of</strong> <strong>the</strong> order <strong>of</strong> a few tens <strong>of</strong> picoseconds.<br />
The time, when <strong>the</strong> falling edge <strong>of</strong> <strong>the</strong> digitized<br />
trigger signal crosses <strong>the</strong> threshold (typically equal<br />
to 500 ADC counts), will be called hardware<br />
trigger time. This trigger signal is generated when<br />
<strong>the</strong> N majority coincidence occurs, i.e. at <strong>the</strong> very<br />
time when <strong>the</strong> Nth pmt pulse (within <strong>the</strong> coincidence<br />
window typically equal to 60 ns) crosses<br />
<strong>the</strong> threshold (typically equal to 30 mV). After<br />
<strong>the</strong> full shape <strong>and</strong> amplitude <strong>of</strong> <strong>the</strong> pmt pulses<br />
is reconstructed, using <strong>the</strong> signal processing, <strong>the</strong><br />
time that <strong>the</strong> Nth pmt pulse crosses <strong>the</strong> threshold<br />
in <strong>the</strong> coincidence time window is estimated;<br />
this time is <strong>the</strong> s<strong>of</strong>tware trigger time. The<br />
difference <strong>of</strong> <strong>the</strong> hardware <strong>and</strong> s<strong>of</strong>tware trigger<br />
times is shown in Fig. 5. This difference should<br />
be stable <strong>and</strong> its stability is only affected by <strong>the</strong><br />
reconstruction accuracy <strong>of</strong> <strong>the</strong> rising edge <strong>of</strong> <strong>the</strong><br />
pmt pulses. As shown in this figure, this reconstruction<br />
accuracy is 0.8 ns. This uncertainty is<br />
consistent with <strong>the</strong> uncertainty estimated with<br />
simple statistical arguments using <strong>the</strong> sampling<br />
period <strong>of</strong> 3.66 ns/O12 ¼ 1.06 ns. In fact it is smaller<br />
because <strong>of</strong> <strong>the</strong> quadrature interpolation used.<br />
However, note that <strong>the</strong> reconstruction accuracy<br />
<strong>of</strong> <strong>the</strong> rising edge <strong>of</strong> <strong>the</strong> pmt pulses is only one<br />
contribution to <strong>the</strong> time resolution <strong>of</strong> <strong>the</strong> pmt<br />
signal. This has to be compounded in quadrature<br />
with <strong>the</strong> main pmt’s pulse uncertainty, which is <strong>the</strong><br />
Transit Time Spread (TTS). The resulting pulse<br />
arrival time resolution as a function <strong>of</strong> <strong>the</strong> pulse<br />
Fig. 5. The distribution <strong>of</strong> <strong>the</strong> time differences between <strong>the</strong><br />
hardware <strong>and</strong> s<strong>of</strong>tware trigger (see text), before (open circles)<br />
<strong>and</strong> after (solid points) signal processing. The solid line<br />
represents a Gaussian fit to <strong>the</strong> time difference with a sigma<br />
<strong>of</strong> 0.8 ns.
ARTICLE IN PRESS<br />
428<br />
G. Aggouras et al. / <strong>Nucl</strong>ear <strong>Instr</strong>uments <strong>and</strong> Methods in Physics Research A 552 (2005) 420–439<br />
amplitude is measured in <strong>the</strong> laboratory <strong>and</strong><br />
checked during operation in <strong>the</strong> deep sea using<br />
<strong>the</strong> LED flasher units (Fig. 16, later). This pulse<br />
arrival time resolution is <strong>the</strong> main error source <strong>of</strong><br />
<strong>the</strong> track fitting.<br />
There are cases where <strong>the</strong> digitized waveform <strong>of</strong><br />
<strong>the</strong> pmt includes overlapping pulses. In many such<br />
cases, <strong>the</strong> overlapcan be disentangled after <strong>the</strong> two<br />
first steps <strong>of</strong> <strong>the</strong> signal processing. This is<br />
demonstrated in Fig. 6 where <strong>the</strong> st<strong>and</strong>ard<br />
correction <strong>of</strong> <strong>the</strong> original pulse shape results in<br />
<strong>the</strong> resolution <strong>of</strong> <strong>the</strong> two overlapping pulses.<br />
However, <strong>the</strong>re are some cases where <strong>the</strong> overlapping<br />
is not resolved at this stage. These pulses<br />
can <strong>of</strong>ten be separated in a third processing stage<br />
by a w 2 fitting using st<strong>and</strong>ard pulse shapes. An<br />
example <strong>of</strong> such a fit is shown in Fig. 7.<br />
Finally, pmt pulses <strong>of</strong> very high amplitude,<br />
which exceed 1.8 V (more than 15 photoelectrons),<br />
cause overflows in <strong>the</strong> digitization electronics.<br />
These pulses undergo an extra pre-processing,<br />
before <strong>the</strong> attenuation correction, that includes<br />
pulse shape fitting <strong>and</strong> amplitude estimation.<br />
The 12 optical modules used in <strong>the</strong> present<br />
deployment (<strong>and</strong> a number <strong>of</strong> spares) have been<br />
simultaneously illuminated in <strong>the</strong> laboratory using<br />
<strong>the</strong> calibration LED flasher unit. The full data<br />
acquisition <strong>and</strong> analysis chain was used <strong>and</strong> <strong>the</strong><br />
LED was operated at several levels <strong>of</strong> light output.<br />
The collected calibration data has been used to<br />
optimize <strong>the</strong> working point (pmt high voltage),<br />
synchronize <strong>the</strong> pmt pulse arrival times <strong>and</strong><br />
measure <strong>the</strong> characteristics <strong>of</strong> <strong>the</strong> pmt pulse height<br />
distribution, corresponding to <strong>the</strong> emission <strong>of</strong> one<br />
photoelectron from <strong>the</strong> photocathode. 7<br />
Fig. 8 demonstrates <strong>the</strong> effect <strong>of</strong> <strong>the</strong> signal<br />
processing on <strong>the</strong> digitized pmt pulse amplitude<br />
from <strong>the</strong> deployed detector. It shows <strong>the</strong> pulse<br />
height distribution <strong>of</strong> a pmt before <strong>and</strong> after <strong>the</strong><br />
processing stages described above. The data<br />
presented have been selected with a 4-fold or<br />
higher-level coincidence trigger during normal<br />
data taking at <strong>the</strong> experimental site. The majority<br />
Fig. 6. Separation <strong>of</strong> overlapping pulses after <strong>the</strong> attenuation<br />
correction.<br />
Fig. 7. Separation <strong>of</strong> overlapping pulses by means <strong>of</strong> a w 2 fit.<br />
7 It will be referred to as ‘‘one photoelectron pulse height<br />
distribution’’ hereafter. The mean values <strong>of</strong> <strong>the</strong>se distributions,<br />
for <strong>the</strong> selected operating values <strong>of</strong> <strong>the</strong> pmt high voltages, were<br />
about 120 mV.<br />
Fig. 8. PMT pulse height distribution due to K 40 background<br />
before (dashed line) <strong>and</strong> after (solid line) <strong>the</strong> signal processing.
ARTICLE IN PRESS<br />
G. Aggouras et al. / <strong>Nucl</strong>ear <strong>Instr</strong>uments <strong>and</strong> Methods in Physics Research A 552 (2005) 420–439 429<br />
<strong>of</strong> <strong>the</strong>se events are due to r<strong>and</strong>om coincidences <strong>of</strong><br />
pulses from K 40 decays. The emitted electrons<br />
produce Cherenkov light at <strong>the</strong> level <strong>of</strong> few<br />
photoelectrons. The corrected pulse height distribution<br />
is in a very good agreement with <strong>the</strong><br />
results <strong>of</strong> <strong>the</strong> calibration data accumulated in <strong>the</strong><br />
laboratory before <strong>the</strong> deployment <strong>of</strong> <strong>the</strong> detector<br />
(see Section 6).<br />
For <strong>the</strong> rest <strong>of</strong> this paper whenever pulse-heights<br />
are presented, <strong>the</strong>y have been corrected using <strong>the</strong><br />
outlined procedure (unless o<strong>the</strong>rwise noted).<br />
5. Detector simulation<br />
We have developed a simulation package that<br />
describes in detail <strong>the</strong> detector architecture <strong>and</strong> its<br />
functionality, as well as <strong>the</strong> physical processes<br />
related to an underwater neutrino telescope. It was<br />
extensively used for studying <strong>the</strong> overall <strong>performance</strong><br />
<strong>of</strong> <strong>the</strong> detector <strong>and</strong> data analysis. The<br />
simulation process consists <strong>of</strong> two phases. In <strong>the</strong><br />
first phase, we simulate <strong>the</strong> physical processes<br />
resulting in <strong>the</strong> production <strong>of</strong> Cherenkov photons<br />
<strong>and</strong> <strong>the</strong> propagation <strong>of</strong> <strong>the</strong> photons through <strong>the</strong><br />
water <strong>and</strong> <strong>the</strong> materials surrounding <strong>the</strong> pmt [21]<br />
until <strong>the</strong>y arrive at <strong>the</strong> photo-cathode. In <strong>the</strong><br />
second phase we simulate in detail <strong>the</strong> pmt<br />
response, <strong>the</strong> functions <strong>of</strong> <strong>the</strong> electronics <strong>and</strong> <strong>the</strong><br />
data acquisition system.<br />
In <strong>the</strong> first simulation phase, all known processes<br />
that can occur when a neutrino interacts or<br />
when a charged lepton passes through <strong>the</strong> matter<br />
surrounding <strong>the</strong> detector are included. Since <strong>the</strong><br />
signal is produced by <strong>the</strong> Cherenkov photons that<br />
hit <strong>the</strong> photocathode <strong>of</strong> <strong>the</strong> pmts, special attention<br />
is given to <strong>the</strong> Cherenkov radiation <strong>and</strong> <strong>the</strong><br />
propagation <strong>of</strong> light in <strong>the</strong> water <strong>and</strong> through<br />
<strong>the</strong> Optical Module. The tool used in this stage is<br />
<strong>the</strong> GEANT 4 simulation package [26] <strong>and</strong> its<br />
interfaces with o<strong>the</strong>r packages such as Pythia [36],<br />
EGS [37], etc. All <strong>the</strong> energy losses <strong>of</strong> <strong>the</strong> particles<br />
involved (ionization, atomic excitation, bremsstrahlung,<br />
pair production, muon–nucleus interaction,<br />
formation <strong>of</strong> electromagnetic <strong>and</strong> hadronic<br />
showers, etc.) as well as multiple scattering are<br />
taken into account. The simulation package tracks<br />
every primary <strong>and</strong> secondary particle between<br />
consecutive interactions. At each stepCherenkov<br />
photons are generated, which may interact ei<strong>the</strong>r<br />
by absorption, or by scattering in <strong>the</strong> water, before<br />
<strong>the</strong>y reach <strong>the</strong> Optical Module. The Optical<br />
Module [21] consists <strong>of</strong> many components, which<br />
are described in detail in <strong>the</strong> simulation. For this<br />
we used a geometrical description <strong>of</strong> <strong>the</strong> benthos<br />
sphere (<strong>the</strong> glass housing <strong>of</strong> <strong>the</strong> pmt), <strong>the</strong> glycerine<br />
(<strong>the</strong> optical coupling between <strong>the</strong> glass envelope<br />
<strong>and</strong> <strong>the</strong> pmt) <strong>and</strong> <strong>the</strong> shading caused by <strong>the</strong><br />
magnetic shielding cage. The optical properties <strong>of</strong><br />
each component, such as <strong>the</strong> absorption length<br />
<strong>and</strong> <strong>the</strong> refractive index, are taken as a function <strong>of</strong><br />
<strong>the</strong> photon wavelength.<br />
The second phase includes <strong>the</strong> generation <strong>of</strong><br />
single electrical pulses, <strong>the</strong> contribution <strong>of</strong> <strong>the</strong><br />
background sources, <strong>the</strong> generation <strong>of</strong> <strong>the</strong> pmt<br />
waveforms <strong>and</strong> <strong>the</strong> functions <strong>of</strong> <strong>the</strong> electronics.<br />
The simulation in this phase is based on <strong>the</strong><br />
following assumptions:<br />
(a) The emission <strong>of</strong> photoelectrons is a stochastic<br />
process. Each photon <strong>of</strong> a certain wavelength<br />
(l) liberates an electron from <strong>the</strong> photocathode<br />
according to <strong>the</strong> probability that is <strong>the</strong> product<br />
<strong>of</strong> <strong>the</strong> quantum efficiency <strong>of</strong> <strong>the</strong> photocathode<br />
at wavelength l <strong>and</strong> <strong>the</strong> collection efficiency,<br />
which depends on <strong>the</strong> position where <strong>the</strong><br />
photon hits <strong>the</strong> photocathode [21].<br />
(b) Each emitted photoelectron produces a single<br />
electrical pulse at <strong>the</strong> anode with amplitude<br />
that follows <strong>the</strong> one-photoelectron pmt pulse<br />
height distribution; this has been measured in<br />
<strong>the</strong> laboratory for each individual pmt.<br />
(c) The functional form, which describes <strong>the</strong><br />
electrical pulse shape, was defined by fitting<br />
digitized pmt pulses measured in <strong>the</strong> laboratory.<br />
(d) The transition time <strong>of</strong> <strong>the</strong> pmt pulses varies<br />
according to a Gaussian distribution measured<br />
for each pmt separately [21].<br />
(e) The pmt response to ‘n’ photoelectrons is a<br />
linear sum <strong>of</strong> <strong>the</strong> pulses simulated for each<br />
individual photoelectron.<br />
(f) Background pulses due to <strong>the</strong>rmionic noise<br />
<strong>and</strong> <strong>the</strong> after <strong>and</strong> late pulses <strong>of</strong> <strong>the</strong> pmt are<br />
added to each event. The characteristics <strong>of</strong> <strong>the</strong><br />
first contribution (<strong>the</strong> pulse height distribu-
ARTICLE IN PRESS<br />
430<br />
G. Aggouras et al. / <strong>Nucl</strong>ear <strong>Instr</strong>uments <strong>and</strong> Methods in Physics Research A 552 (2005) 420–439<br />
tion, <strong>and</strong> counting rate) have been measured in<br />
situ (see Section 6) whilst <strong>the</strong> emission <strong>of</strong> after<br />
<strong>and</strong> late pulses has been studied extensively in<br />
<strong>the</strong> laboratory [21].<br />
(g) K 40 radioactivity in <strong>the</strong> water produces an<br />
optical background that has been extensively<br />
studied at <strong>the</strong> deployment site (see Section 6).<br />
The corresponding measured electrical counting<br />
rate <strong>and</strong> pulse height distribution are used<br />
to add this background noise in <strong>the</strong> simulation<br />
<strong>of</strong> each pmt signal.<br />
(h) The final pmt waveform generated is <strong>the</strong> linear<br />
sum <strong>of</strong> all <strong>the</strong> signal <strong>and</strong> background pulses.<br />
The generated pmt waveform <strong>the</strong>n follows a<br />
simulated electronics data chain to include (i) <strong>the</strong><br />
pulse attenuation <strong>and</strong> propagation through <strong>the</strong><br />
signal transmission line, (ii) <strong>the</strong> trigger formation<br />
<strong>and</strong> (iii) <strong>the</strong> digitization <strong>of</strong> <strong>the</strong> pulses.<br />
As a final stepin <strong>the</strong> procedure, <strong>the</strong> simulated<br />
events are formatted using <strong>the</strong> same data protocol<br />
as <strong>the</strong> Data Acquisition System. In this way Monte<br />
Carlo generated events have <strong>the</strong> same format as<br />
<strong>the</strong> experimental data <strong>and</strong> can be analyzed with<br />
<strong>the</strong> same tools.<br />
The Monte Carlo package has been used to<br />
produce event samples <strong>of</strong> simulated detector<br />
response to background sources only <strong>and</strong> to<br />
atmospheric muons 8 arriving at <strong>the</strong> detector depth.<br />
A large number <strong>of</strong> muons (2.26 10 7 ) have been<br />
generated within a circle <strong>of</strong> 100 m radius, 100 m<br />
above <strong>the</strong> detector, with energy <strong>and</strong> angular<br />
distributions taken from <strong>the</strong> phenomenological<br />
parameterisation <strong>of</strong> Okada [27]. The ‘‘100 m<br />
radius’’ was selected because it is <strong>the</strong> asymptotic<br />
value <strong>of</strong> <strong>the</strong> ‘‘(trigger efficiency) (generation disk<br />
area)’’ versus <strong>the</strong> ‘‘radius <strong>of</strong> generation disk’’ for<br />
triggers with more than 3 <strong>and</strong> more that 5<br />
photomultipliers in coincidence, Fig. 9.<br />
6. Detector <strong>performance</strong><br />
The deployed detector was operated continuously<br />
for more than a month <strong>and</strong> over 5 million<br />
8 The Monte Carlo muon event samples contain also<br />
contribution from background sources.<br />
Fig. 9. The trigger efficiency versus <strong>the</strong> generation disk area as<br />
calculated for triggers with coincidence <strong>of</strong> 4 or more <strong>and</strong> 6 or<br />
more photomultipliers.<br />
events were accumulated, investigating different<br />
trigger modes, coincidence levels <strong>and</strong> pmt thresholds.<br />
In addition, several million calibration events<br />
were taken at various pmt high voltage levels or<br />
using <strong>the</strong> LED flash units. Of this total data, some<br />
2 million events were accumulated under constant<br />
running conditions with a 4-fold or higher coincidence<br />
trigger <strong>and</strong> 30 mV pmt threshold; this<br />
event sample has been used for <strong>the</strong> following<br />
<strong>performance</strong> analysis <strong>and</strong> for track reconstruction.<br />
The readout <strong>and</strong> DAQ chain was operated<br />
continuously with practically no dead time <strong>and</strong> <strong>the</strong><br />
monitored experimental parameters (environmental<br />
<strong>and</strong> operational) remained stable within<br />
tolerances. The pmt counting rates remained stable<br />
during <strong>the</strong> whole running period at a level <strong>of</strong><br />
around 50 kHz per pmt, due principally to<br />
Cherenkov light emitted by electrons from K 40<br />
decays <strong>and</strong> <strong>the</strong>rmionic noise. The pmt counting<br />
rate (inside <strong>the</strong> 60 ns window) was found to remain<br />
constant as a function <strong>of</strong> <strong>the</strong> coincidence level,<br />
showing that <strong>the</strong> trigger is not biased by <strong>the</strong> rate.<br />
A majority <strong>of</strong> <strong>the</strong> events, accumulated with a 4-<br />
fold coincidence trigger, result from accidental<br />
coincidences between pmt pulses from <strong>the</strong> K 40<br />
background <strong>and</strong> <strong>the</strong>rmionic noise. Consequently,<br />
<strong>the</strong> pmt pulse height distribution shape should
ARTICLE IN PRESS<br />
G. Aggouras et al. / <strong>Nucl</strong>ear <strong>Instr</strong>uments <strong>and</strong> Methods in Physics Research A 552 (2005) 420–439 431<br />
remain stable, corresponding to <strong>the</strong> emission <strong>of</strong> a<br />
very few photoelectrons.<br />
In a typical example shown in Fig. 10a, <strong>the</strong> pulse<br />
height distribution has a shape corresponding to a<br />
few (average 1.3) photoelectrons. This distribution<br />
can be described very well as <strong>the</strong> overlay <strong>of</strong> <strong>the</strong><br />
one-photoelectron (see insert plot) <strong>and</strong> two-photoelectron<br />
pulse height distributions, measured in <strong>the</strong><br />
laboratory during <strong>the</strong> detector calibration. The<br />
average number 1.3 <strong>of</strong> photoelectrons is not <strong>the</strong><br />
mean <strong>of</strong> a Poissonian distribution but <strong>the</strong> mean <strong>of</strong><br />
<strong>the</strong> distribution in <strong>the</strong> main plot (after <strong>the</strong><br />
subtraction <strong>of</strong> <strong>the</strong> exponential contribution for<br />
<strong>the</strong> dark current, line a) normalized to <strong>the</strong> mean <strong>of</strong><br />
<strong>the</strong> calibration pulse height distribution for single<br />
photoelectron (insert plot). The contribution <strong>of</strong><br />
<strong>the</strong> two-photoelectron component is surprisingly<br />
high [1]. It cannot be attributed to late photomultiplier<br />
pulses, because <strong>the</strong>y were measured in<br />
<strong>the</strong> laboratory <strong>and</strong> are less than 1%, or to<br />
radioactive contamination <strong>of</strong> <strong>the</strong> photomultiplier<br />
glass <strong>and</strong>/or <strong>the</strong> glass sphere protective housing,<br />
because <strong>the</strong> laboratory measurements (insert in<br />
Fig. 10a) were done with <strong>the</strong> same Optical<br />
Module.<br />
The K 40 background has been used as a stable<br />
‘st<strong>and</strong>ard c<strong>and</strong>le’ in order to monitor <strong>the</strong> gain<br />
stability <strong>of</strong> <strong>the</strong> detector. The pmt pulse height<br />
distributions from each data file were compared to<br />
a st<strong>and</strong>ard shape defined at <strong>the</strong> beginning <strong>of</strong> <strong>the</strong><br />
run <strong>and</strong> found to be extremely stable for all <strong>of</strong> <strong>the</strong><br />
pmts during <strong>the</strong> whole running period.<br />
However, <strong>the</strong>re were periods <strong>of</strong> time when <strong>the</strong><br />
instantaneous counting rates <strong>of</strong> a group<strong>of</strong> pmts<br />
<strong>and</strong> <strong>the</strong> collection trigger rate show a large<br />
increase; Fig. 10b gives an example <strong>of</strong> such<br />
behaviour. The downlooking group<strong>of</strong> pmts<br />
exhibits a synchronous increase <strong>of</strong> counting rates<br />
whilst <strong>the</strong> o<strong>the</strong>rs remain relatively quiet, indicating<br />
that <strong>the</strong>re is probably a localized light source<br />
below <strong>the</strong> detector. These phenomena last typically<br />
from 1 to 10 s <strong>and</strong> represent a total 1.1% <strong>of</strong> <strong>the</strong><br />
active experimental time. The effect is consistent<br />
with bioluminescent activity from marine organisms<br />
in <strong>the</strong> detector vicinity.<br />
The pulse height distribution <strong>of</strong> <strong>the</strong> pmts during<br />
a period <strong>of</strong> bioluminescence is very similar to <strong>the</strong><br />
distribution due to <strong>the</strong> K 40 decay. To demonstrate<br />
this, Fig. 11 compares <strong>the</strong> distribution <strong>of</strong> <strong>the</strong> total<br />
number <strong>of</strong> accumulated photoelectrons inside <strong>the</strong><br />
trigger window with a 4-fold or higher level<br />
coincidence trigger for events collected during<br />
periods with <strong>and</strong> without bioluminescence activity.<br />
Bioluminescence can be easily identified because<br />
<strong>of</strong> its characteristic time duration <strong>and</strong> <strong>the</strong>refore<br />
does not cause any background problem. In <strong>the</strong><br />
analysis that follows, all events collected during<br />
periods <strong>of</strong> bioluminescence activity have been<br />
excluded. This represents a reduction <strong>of</strong> only<br />
1.1% in <strong>the</strong> size <strong>of</strong> <strong>the</strong> data sample. 9<br />
The average experimental trigger rate, corresponding<br />
to <strong>the</strong> coincidence <strong>of</strong> four or more pmt<br />
pulses above 30 mV amplitude, was 3.76 Hz<br />
compared to an estimated rate <strong>of</strong> 3.79 Hz derived<br />
from <strong>the</strong> Monte Carlo simulations (see Section 5).<br />
According to <strong>the</strong> Monte Carlo estimation, only<br />
a small fraction (5.5%, 0.21 Hz) <strong>of</strong> this trigger rate<br />
corresponds to atmospheric muons passing close<br />
to <strong>the</strong> detector. When <strong>the</strong> pmt thresholds were set<br />
to 120 mV, <strong>the</strong> measured trigger rate was 0.29 Hz,<br />
in agreement with <strong>the</strong> equivalent Monte Carlo<br />
estimate <strong>of</strong> 0.30 Hz.<br />
Fur<strong>the</strong>rmore, <strong>the</strong> measured coincidence rates,<br />
shown in Fig. 12, are in very good agreement with<br />
<strong>the</strong> Monte Carlo estimations for several levels <strong>of</strong><br />
coincidence at different pmt thresholds. In <strong>the</strong><br />
same plots, we present <strong>the</strong> Monte Carlo estimated<br />
contribution <strong>of</strong> <strong>the</strong> atmospheric muon flux to <strong>the</strong><br />
triggers, showing that higher-level coincidences<br />
exclude <strong>the</strong> combinatorial background. A better<br />
rejection <strong>of</strong> <strong>the</strong> combinatorial background is<br />
achieved at higher pmt threshold values.<br />
Several studies have been made to ensure that all<br />
<strong>the</strong> collected light on <strong>the</strong> pmts can be attributed to<br />
<strong>the</strong> known sources. Since higher coincidence levels<br />
reject better <strong>the</strong> combinatorial background, <strong>the</strong><br />
dependence <strong>of</strong> <strong>the</strong> total number <strong>of</strong> collected<br />
photons per event on <strong>the</strong> coincidence level has<br />
been studied. The total number <strong>of</strong> accumulated<br />
photoelectrons inside <strong>the</strong> coincidence window has<br />
been used as a measure <strong>of</strong> <strong>the</strong> total number <strong>of</strong><br />
9 High levels <strong>of</strong> bioluminescence [28] can cause severe deadtime<br />
in data taking. Note that in o<strong>the</strong>r Mediterranean sites,<br />
periods with more than 30% <strong>of</strong> bioluminescence activity has<br />
been observed [29].
ARTICLE IN PRESS<br />
432<br />
G. Aggouras et al. / <strong>Nucl</strong>ear <strong>Instr</strong>uments <strong>and</strong> Methods in Physics Research A 552 (2005) 420–439<br />
collected photons. The mean value <strong>of</strong> <strong>the</strong> number<br />
<strong>of</strong> accumulated photoelectrons inside <strong>the</strong> coincidence<br />
window, as a function <strong>of</strong> <strong>the</strong> coincidence<br />
level is compared to <strong>the</strong> Monte Carlo prediction in<br />
Fig. 13. As expected <strong>the</strong> high multiplicity events<br />
have much more photons per pmt because <strong>the</strong>y<br />
correspond to Cherenkov light produced by<br />
nearby muons while <strong>the</strong> low multiplicities are <strong>the</strong><br />
result <strong>of</strong> r<strong>and</strong>om coincidences.<br />
Ano<strong>the</strong>r sensitive <strong>test</strong> is to examine <strong>the</strong> pulse<br />
height distributions <strong>of</strong> individual pmt pulses that<br />
contribute to events with high multiplicity coincidences;<br />
<strong>the</strong>se are typically pulses produced by<br />
atmospheric muons. The pulse height distribution<br />
<strong>of</strong> a typical pmt (in units <strong>of</strong> <strong>the</strong> mean value <strong>of</strong> <strong>the</strong><br />
one photoelectron spectrum), when participating<br />
in a 6-fold or higher coincidence, is shown in Fig.<br />
14 <strong>and</strong> is compared to <strong>the</strong> Monte Carlo estimation.<br />
The agreement between <strong>the</strong> measured <strong>and</strong><br />
predicted spectra, which has been verified for all<br />
pmts <strong>of</strong> <strong>the</strong> detector, indicates that <strong>the</strong> collected<br />
light is produced by <strong>the</strong> sources that are used in <strong>the</strong><br />
detector simulation.<br />
Finally, <strong>the</strong> global arrival time distribution <strong>of</strong><br />
<strong>the</strong> accumulated photoelectrons was studied, for<br />
events with at least six pmt pulses inside <strong>the</strong><br />
coincidence window. This is <strong>the</strong> distribution <strong>of</strong> <strong>the</strong><br />
arrival time <strong>of</strong> any digitized pmt pulse, weighted<br />
by <strong>the</strong> pulse amplitude (in units <strong>of</strong> <strong>the</strong> mean value<br />
<strong>of</strong> <strong>the</strong> one photoelectron pulse height distribution)<br />
<strong>and</strong> normalized to <strong>the</strong> total number <strong>of</strong> selected<br />
events. This distribution expresses <strong>the</strong> correlation<br />
<strong>of</strong> <strong>the</strong> Cherenkov light intensity <strong>and</strong> <strong>the</strong> arrival<br />
time. As shown in Fig. 15, <strong>the</strong> Monte Carlo<br />
simulation agrees, within statistical errors, with <strong>the</strong><br />
experimental global arrival time distribution <strong>of</strong> <strong>the</strong><br />
accumulated photoelectrons.<br />
Fig. 10. The pulse height distribution <strong>of</strong> a PMT (not <strong>the</strong> same<br />
as in Fig. 8) during operation in deep sea (main plot) <strong>and</strong> from<br />
a calibration run in <strong>the</strong> laboratory (insert plot). The solid line in<br />
<strong>the</strong> main plot is <strong>the</strong> result <strong>of</strong> a fit to <strong>the</strong> data points using an<br />
exponential shape for <strong>the</strong> dark current (line a), as well as <strong>the</strong><br />
one photoelectron (line b) <strong>and</strong> <strong>the</strong> two photoelectrons (line c)<br />
pulse height spectra evaluated during calibration runs at <strong>the</strong><br />
laboratory. (b) PMT counting rates as a function <strong>of</strong> time during<br />
bioluminescent activity. Each row represents a pair <strong>of</strong> PMTs on<br />
<strong>the</strong> same arm <strong>of</strong> <strong>the</strong> hexagonal detector floor.
ARTICLE IN PRESS<br />
G. Aggouras et al. / <strong>Nucl</strong>ear <strong>Instr</strong>uments <strong>and</strong> Methods in Physics Research A 552 (2005) 420–439 433<br />
Fig. 11. The total number <strong>of</strong> accumulated photoelectrons inside <strong>the</strong> trigger window during bioluminescence activity (crosses) <strong>and</strong> with<br />
no bioluminescence (histogram).<br />
Fig. 12. Trigger rates as a function <strong>of</strong> <strong>the</strong> coincidence level, for<br />
two threshold settings. The points represent <strong>the</strong> data, <strong>the</strong> solid<br />
line <strong>the</strong> Monte Carlo estimation including background <strong>and</strong> <strong>the</strong><br />
dashed line <strong>the</strong> Monte Carlo estimation for <strong>the</strong> contribution <strong>of</strong><br />
<strong>the</strong> atmospheric muons.<br />
At <strong>the</strong> end <strong>of</strong> <strong>the</strong> active experimental window<br />
<strong>the</strong>re is a small peak in <strong>the</strong> data that does not<br />
appear in <strong>the</strong> Monte Carlo expectation. This is due<br />
to a known malfunction in <strong>the</strong> first generation <strong>of</strong><br />
ATWDs, which digitize a low amplitude ghost<br />
Fig. 13. Total number <strong>of</strong> photoelectrons inside <strong>the</strong> coincidence<br />
window as a function <strong>of</strong> <strong>the</strong> coincidence level for two threshold<br />
settings. The points represent <strong>the</strong> data <strong>and</strong> <strong>the</strong> histogram gives<br />
<strong>the</strong> Monte Carlo estimation. The errors are calculated from<br />
event statistics <strong>and</strong> not from <strong>the</strong> number <strong>of</strong> <strong>the</strong> photoelectrons.<br />
The number <strong>of</strong> photoelectrons is <strong>the</strong> mean number collected<br />
inside <strong>the</strong> coincidence window per trigger.<br />
pulse at <strong>the</strong> end <strong>of</strong> <strong>the</strong>ir active window. This<br />
problem does not affect <strong>the</strong> analysis because only<br />
pulses inside <strong>the</strong> trigger window are used.
ARTICLE IN PRESS<br />
434<br />
G. Aggouras et al. / <strong>Nucl</strong>ear <strong>Instr</strong>uments <strong>and</strong> Methods in Physics Research A 552 (2005) 420–439<br />
Fig. 14. The pulse height distribution <strong>of</strong> a typical PMT, in units <strong>of</strong> <strong>the</strong> mean value <strong>of</strong> <strong>the</strong> one photoelectron distribution, participating<br />
in a high-level coincidence. The crosses represent <strong>the</strong> data whilst <strong>the</strong> histograms show <strong>the</strong> corresponding Monte Carlo prediction.<br />
Data from calibration runs with <strong>the</strong> LED flasher<br />
units was used to monitor operation at <strong>the</strong> deepsea<br />
site. In particular, this data has been used to<br />
check <strong>the</strong> detector time resolution.<br />
The pmts are positioned symmetrically with<br />
respect to <strong>the</strong> LED flasher unit so <strong>the</strong> digitized pmt<br />
pulses are expected to have <strong>the</strong> same arrival time,<br />
within measurement errors. The distributions <strong>of</strong><br />
<strong>the</strong> arrival time difference between pulses <strong>of</strong> any<br />
pair <strong>of</strong> pmts, produced by <strong>the</strong> same LED flash <strong>and</strong><br />
with a pulse height greater than 800 mV, show a<br />
peak at zero time with a st<strong>and</strong>ard deviation<br />
compatible to <strong>the</strong> light pulse duration convoluted<br />
with <strong>the</strong> arrival time resolution. However, when<br />
we choose <strong>the</strong> pulses <strong>of</strong> <strong>the</strong> first pmt to have lower<br />
amplitude, <strong>the</strong> mean difference <strong>of</strong> <strong>the</strong> arrival times<br />
deviates from zero <strong>and</strong> <strong>the</strong> st<strong>and</strong>ard deviation <strong>of</strong><br />
<strong>the</strong> distribution increases. The first effect is a result<br />
<strong>of</strong> <strong>the</strong> dependence <strong>of</strong> <strong>the</strong> arrival time definition on<br />
<strong>the</strong> pulse amplitude (slewing), whilst <strong>the</strong> second<br />
effect reflects <strong>the</strong> transient time spread [21] <strong>and</strong> <strong>the</strong><br />
pulse reconstruction resolution dependence on <strong>the</strong><br />
amplitude <strong>of</strong> <strong>the</strong> pulse. These dependencies are<br />
measured using <strong>the</strong> calibration data <strong>and</strong> parameterized<br />
in order to be used in <strong>the</strong> track<br />
reconstruction analysis. Fig. 16 shows <strong>the</strong> slewing
ARTICLE IN PRESS<br />
G. Aggouras et al. / <strong>Nucl</strong>ear <strong>Instr</strong>uments <strong>and</strong> Methods in Physics Research A 552 (2005) 420–439 435<br />
Fig. 15. Global arrival time distribution <strong>of</strong> <strong>the</strong> accumulated photoelectrons (solid points) compared with <strong>the</strong> Monte Carlo expectation<br />
(open circles) for events with six or more PMT pulses inside <strong>the</strong> trigger window.<br />
<strong>and</strong> arrival time resolution parameterized as a<br />
function <strong>of</strong> <strong>the</strong> pulse height for one <strong>of</strong> <strong>the</strong> pmts.<br />
7. Atmospheric muon studies<br />
Fig. 16. Measurement <strong>of</strong> <strong>the</strong> pulse amplitude dependence <strong>of</strong> <strong>the</strong><br />
bias (slewing) <strong>and</strong> <strong>the</strong> resolution in evaluating <strong>the</strong> pulse arrival<br />
time, using <strong>the</strong> collected calibration data during operation for a<br />
pmt. The continuous line is <strong>the</strong> parameterized function used in<br />
<strong>the</strong> in <strong>the</strong> track reconstruction analysis.<br />
From <strong>the</strong> total data sample collected with a 4-<br />
fold or higher coincidence trigger <strong>and</strong> 30 mV pmt<br />
threshold, a subset containing 45,800 events has<br />
been selected that have six or more pmt pulses<br />
(hits) within <strong>the</strong> 60 ns time window. These events<br />
have been analysed in order to reconstruct muon<br />
tracks. The arrival time <strong>of</strong> <strong>the</strong> digitized pmt pulses<br />
was used to estimate <strong>the</strong> muon track parameters<br />
by means <strong>of</strong> a w 2 fit whilst <strong>the</strong> pmt pulse heights<br />
were used to reject ghost solutions <strong>and</strong> poorly<br />
reconstructed tracks. The details <strong>of</strong> <strong>the</strong> reconstruction<br />
strategy <strong>and</strong> <strong>the</strong> relevant studies are reported<br />
in ano<strong>the</strong>r paper [30]. The results are summarized<br />
here.<br />
From <strong>the</strong> selected sample <strong>of</strong> events, 745 muon<br />
tracks have been reconstructed that have a<br />
perpendicular distance from <strong>the</strong> centre <strong>of</strong> <strong>the</strong><br />
detector (impact parameter) greater than 6 m.<br />
Fig. 17 shows <strong>the</strong> distribution <strong>of</strong> <strong>the</strong> azimuth<br />
angle <strong>of</strong> <strong>the</strong> reconstructed tracks. As expected, <strong>the</strong><br />
distribution in azimuth <strong>of</strong> <strong>the</strong> muon tracks at <strong>the</strong><br />
detector depth is not affected by <strong>the</strong> detector<br />
response or <strong>the</strong> reconstruction efficiency.<br />
The zenith angular distribution <strong>of</strong> <strong>the</strong> reconstructed<br />
tracks is compared to <strong>the</strong> Monte<br />
Carlo prediction in Fig. 18. Due to <strong>the</strong> limited
ARTICLE IN PRESS<br />
436<br />
G. Aggouras et al. / <strong>Nucl</strong>ear <strong>Instr</strong>uments <strong>and</strong> Methods in Physics Research A 552 (2005) 420–439<br />
Fig. 17. The experimental distribution <strong>of</strong> <strong>the</strong> reconstructed azimuth angles (solid points) compared with <strong>the</strong> Monte Carlo prediction<br />
(histogram).<br />
reconstruction resolution, 10 <strong>the</strong> distributions extend<br />
to zenith angles higher than 901.<br />
In order to quantify <strong>the</strong> level <strong>of</strong> agreement<br />
between <strong>the</strong> measured data <strong>and</strong> <strong>the</strong> predictions <strong>of</strong><br />
<strong>the</strong> Okada model [27], <strong>the</strong> w 2 probability <strong>of</strong> <strong>the</strong><br />
experimental points to <strong>the</strong> Monte Carlo prediction<br />
was calculated. This was found to give a confidence<br />
level <strong>of</strong> 52%, demonstrating very good<br />
agreement.<br />
The number <strong>of</strong> atmospheric muons (N) arriving<br />
at <strong>the</strong> detector depth per unit solid angle (O), per<br />
unit time (t) <strong>and</strong> per unit area (S), dN=ðdO dt dSÞ,<br />
is usually parameterized as [15,31,32]<br />
dN<br />
dO dt dS ¼ I 0 cos a ðyÞ (1)<br />
where I 0 is <strong>the</strong> vertical intensity.<br />
The index a has been found to be equal to<br />
4.570.8 in previous measurements at 3697 m<br />
water depth at <strong>the</strong> Nestor site [15,31]. The vertical<br />
intensity was evaluated by integrating Eq. (1) <strong>and</strong><br />
setting <strong>the</strong> total number <strong>of</strong> muons equal to <strong>the</strong><br />
total number <strong>of</strong> <strong>the</strong> reconstructed data tracks<br />
(D ¼ 745) divided by <strong>the</strong> total efficiency (e) in<br />
reconstructing atmospheric muon tracks.<br />
I 0 ¼<br />
D=hiða þ 1Þ<br />
2pTS<br />
(2)<br />
10 Monte Carlo studies [30] show an average reconstruction<br />
resolution <strong>of</strong> 111.<br />
Fig. 18. Distribution <strong>of</strong> <strong>the</strong> Zenith angle (y) <strong>of</strong> reconstructed<br />
tracks for <strong>the</strong> data (triangles) <strong>and</strong> Monte Carlo (solid points)<br />
event samples. The insert plot shows <strong>the</strong> same distributions on a<br />
linear scale.<br />
where T st<strong>and</strong>s for <strong>the</strong> total experimental time <strong>of</strong><br />
609,580 s during which this data subset was<br />
accumulated.<br />
The total efficiency (e) has been estimated from<br />
<strong>the</strong> Monte Carlo simulated data as <strong>the</strong> ratio <strong>of</strong> <strong>the</strong><br />
number <strong>of</strong> reconstructed tracks to <strong>the</strong> corresponding<br />
number <strong>of</strong> atmospheric muons generated with<br />
energies greater than 1 GeV at <strong>the</strong> detector depth
ARTICLE IN PRESS<br />
G. Aggouras et al. / <strong>Nucl</strong>ear <strong>Instr</strong>uments <strong>and</strong> Methods in Physics Research A 552 (2005) 420–439 437<br />
(in a circle <strong>of</strong> 100 m 11 radius at 100 m above <strong>the</strong><br />
detector). The total efficiency, corresponding 12 to<br />
a Monte Carlo production model following <strong>the</strong><br />
angular distribution <strong>of</strong> Eq. (1), with a ¼ 4:5, was<br />
found to be: ¼ 3:89 10 4 0:04 10 4 .<br />
The vertical atmospheric muon intensity, found<br />
using formula (2) gives:<br />
I 0 ¼ 8:8 10 9 1:3 10 9 cm 2 s 1 sr 1 (3)<br />
where <strong>the</strong> estimated error is calculated from<br />
statistical uncertainties in <strong>the</strong> data <strong>and</strong> Monte<br />
Carlo simulation <strong>and</strong> <strong>the</strong> measurement error on<br />
<strong>the</strong> index a. The cited uncertainty comes from all<br />
<strong>the</strong> contributions <strong>of</strong> <strong>the</strong> uncertainties <strong>of</strong> <strong>the</strong><br />
quantities in <strong>the</strong> right-h<strong>and</strong> side <strong>of</strong> Eq. (2), added<br />
in quadrature. The dominant uncertainty however<br />
is <strong>the</strong> error <strong>of</strong> <strong>the</strong> spectral index a. The reconstruction<br />
efficiency (e) depends on <strong>the</strong> zenith angle, so it<br />
also depends on <strong>the</strong> spectral index a. In this way<br />
<strong>the</strong> uncertainty <strong>of</strong> <strong>the</strong> reconstruction efficiency has<br />
two contributions: <strong>the</strong> one is <strong>the</strong> statistical<br />
uncertainty that has been estimated from <strong>the</strong><br />
calculation <strong>of</strong> <strong>the</strong> reconstruction efficiency via<br />
<strong>the</strong> Monte Carlo <strong>and</strong> <strong>the</strong> second is through <strong>the</strong><br />
propagation from <strong>the</strong> spectral index a. The latter<br />
contribution to <strong>the</strong> estimation uncertainty <strong>of</strong> <strong>the</strong><br />
vertical flux is insignificant (less than 0.15 10 9 );<br />
details could be found in Ref. [30].<br />
This measured intensity is in good agreement<br />
with predictions <strong>of</strong> <strong>the</strong> vertical intensity <strong>of</strong> <strong>the</strong><br />
atmospheric muons at a depth <strong>of</strong> 3800 m.w.e, by<br />
Okada [27] (I 0 ¼ 8:8 10 9 cm 2 s 1 sr 1 ) <strong>and</strong><br />
Bugaev et al. [33,34] (I 0 ¼ 9:0 10 9 cm 2 s 1 sr 1 )<br />
as well as with <strong>the</strong> previous <strong>NESTOR</strong> measurements<br />
[35] <strong>of</strong> I 0 ¼ 9:8 10 9 4:0 10 9 cm 2 s 1 sr 1<br />
at depths between 3700 <strong>and</strong> 3900 m. It is also<br />
consistent with <strong>the</strong> DUMAND measurement [32]<br />
<strong>of</strong> I 0 ¼ 1:31 10 8 0:4 10 8 cm 2 s 1 sr 1 at a<br />
depth <strong>of</strong> 3707 m.<br />
A more accurate analysis <strong>of</strong> <strong>the</strong> data with a<br />
simultaneous estimation <strong>of</strong> <strong>the</strong> index a <strong>and</strong> <strong>the</strong><br />
11 Approximately twice <strong>the</strong> light transmission length in <strong>the</strong><br />
water at <strong>the</strong> experimental site.<br />
12 The re-weighting <strong>of</strong> <strong>the</strong> Monte Carlo events, produced with<br />
<strong>the</strong> Okada model, to follow <strong>the</strong> differential flux <strong>of</strong> Eq. (1), is<br />
described in Ref. [30].<br />
vertical muon intensity I 0<br />
publication. [30].<br />
8. Conclusions<br />
could be found in<br />
In March 2003, <strong>the</strong> <strong>NESTOR</strong> collaboration<br />
successfully deployed a <strong>test</strong> floor <strong>of</strong> <strong>the</strong> detector<br />
tower, fully equipped with final electronics <strong>and</strong><br />
associated environmental sensors to a depth <strong>of</strong><br />
3800 m, situated 80 m above <strong>the</strong> sea bottom<br />
station.<br />
The deployed detector was continuously operated<br />
for more than a month. The monitored<br />
experimental parameters, operational <strong>and</strong> environmental,<br />
remained stable within <strong>the</strong> accepted<br />
tolerances whilst <strong>the</strong> readout <strong>and</strong> DAQ chain<br />
performed well <strong>and</strong> with practically zero deadtime.<br />
The 1.1% <strong>of</strong> <strong>the</strong> total experimental time was lost<br />
due to bioluminescent activity around <strong>the</strong> detector.<br />
This 1% dead time is consistent with previous<br />
measurements in <strong>the</strong> same site done with autonomous<br />
drops [19]. Events collected during such<br />
periods <strong>of</strong> activity were easily identified <strong>and</strong><br />
rejected.<br />
Several studies have been made to ensure that<br />
<strong>the</strong> event selection trigger was unbiased <strong>and</strong> that<br />
<strong>the</strong> collected light on <strong>the</strong> pmts can be attributed to<br />
<strong>the</strong> expected natural sources. The pmt pulse height<br />
distributions, <strong>the</strong> trigger rates <strong>and</strong> <strong>the</strong> total<br />
number <strong>of</strong> photoelectrons inside <strong>the</strong> trigger<br />
window as functions <strong>of</strong> <strong>the</strong> signal thresholds <strong>and</strong><br />
coincidence level settings as well as <strong>the</strong> arrival time<br />
distribution <strong>of</strong> <strong>the</strong> accumulated photoelectrons,<br />
agree very well with Monte Carlo predictions<br />
based on <strong>the</strong> atmospheric muon flux parameterization<br />
<strong>of</strong> Okada [27], on <strong>the</strong> natural K 40 radioactivity<br />
in <strong>the</strong> sea water <strong>and</strong> <strong>the</strong> pmt dark currents<br />
<strong>and</strong> after pulses.<br />
In parallel, calibration in <strong>the</strong> sea using <strong>the</strong> LED<br />
flasher units mounted above <strong>and</strong> below <strong>the</strong><br />
detector floor, provided a rigorous <strong>test</strong> on <strong>the</strong><br />
time stability <strong>of</strong> <strong>the</strong> detector as well as a<br />
measurement <strong>of</strong> <strong>the</strong> resolution <strong>of</strong> <strong>the</strong> arrival time<br />
<strong>of</strong> <strong>the</strong> pmt signals.<br />
A subset <strong>of</strong> <strong>the</strong> accumulated data, consisting <strong>of</strong><br />
events with six or more pmt pulses inside a 60 ns
ARTICLE IN PRESS<br />
438<br />
G. Aggouras et al. / <strong>Nucl</strong>ear <strong>Instr</strong>uments <strong>and</strong> Methods in Physics Research A 552 (2005) 420–439<br />
time window, has been analysed <strong>and</strong> <strong>the</strong> trajectories<br />
<strong>of</strong> atmospheric muons have been reconstructed.<br />
The distributions <strong>of</strong> <strong>the</strong> azimuth <strong>and</strong><br />
zenith angles <strong>of</strong> <strong>the</strong> reconstructed muon tracks are<br />
found to be in a very good agreement with Monte<br />
Carlo predictions, based on <strong>the</strong> atmospheric muon<br />
model <strong>of</strong> Okada [27].<br />
Finally, based on previous measurements by <strong>the</strong><br />
<strong>NESTOR</strong> collaboration concerning <strong>the</strong> shape <strong>of</strong><br />
<strong>the</strong> zenith angle distribution, we estimated <strong>the</strong><br />
vertical atmospheric muon intensity at <strong>the</strong> deepsea<br />
site. Our measurement, <strong>of</strong><br />
I 0 ¼ 8:8 10 9 1:3 10 9 cm 2 s 1 sr 1<br />
is in very good agreement with previous underwater<br />
measurements <strong>and</strong> with phenomenological<br />
expectations. A more detailed description <strong>of</strong> our<br />
data analysis <strong>and</strong> track reconstruction has been<br />
published elsewhere [30].<br />
The objectives for this deployment <strong>of</strong> <strong>the</strong><br />
<strong>NESTOR</strong> <strong>test</strong> detector were to perform a thorough<br />
<strong>test</strong> <strong>of</strong> <strong>the</strong> electrical supply <strong>and</strong> distribution<br />
systems, <strong>the</strong> monitoring <strong>and</strong> control systems <strong>and</strong><br />
<strong>the</strong> full data acquisition <strong>and</strong> transmission chain<br />
from <strong>the</strong> sea to <strong>the</strong> shore station. These objectives<br />
have been met successfully. In addition we have<br />
been able to demonstrate <strong>the</strong> ability <strong>of</strong> <strong>the</strong><br />
proposed neutrino telescope to reconstruct muon<br />
trajectories.<br />
Acknowledgements<br />
The authors wish to acknowledge <strong>the</strong> help<strong>and</strong><br />
support <strong>of</strong> <strong>the</strong> o<strong>the</strong>r members <strong>of</strong> <strong>the</strong> <strong>NESTOR</strong><br />
collaboration. Our very sincere thanks are also due<br />
to <strong>the</strong> technical <strong>and</strong> support staff from <strong>the</strong><br />
collaborating institutes, especially <strong>of</strong> <strong>the</strong> <strong>NESTOR</strong><br />
Institute in Pylos <strong>and</strong> <strong>the</strong> ‘‘Institut fur Angew<strong>and</strong>te<br />
Physik’’, University <strong>of</strong> Kiel, for <strong>the</strong>ir<br />
unstinting efforts over several years. It is also a<br />
pleasure to acknowledge our many industrial<br />
partners for <strong>the</strong>ir essential contributions; in<br />
particular we express our gratitude to OTE S.A,<br />
<strong>the</strong> Greek Telecom Company for <strong>the</strong> substantial<br />
material support <strong>and</strong> for <strong>the</strong> sea <strong>and</strong> underwater<br />
operations that underpin <strong>the</strong> results presented<br />
here. Many thanks are due to <strong>the</strong> Masters, Crews<br />
<strong>and</strong> Cable Engineers on <strong>the</strong> Thales (OTE) <strong>and</strong><br />
Raymond Croze (France Telecom marine) <strong>and</strong><br />
TENEO (Tyco) as well as <strong>the</strong> support vessel<br />
DYNATOS, for <strong>the</strong>ir help<strong>and</strong> advice in sea<br />
operations <strong>and</strong> deployments.<br />
Last but not least, we greatly appreciate <strong>the</strong><br />
support <strong>of</strong> many institutes <strong>and</strong> agencies that have<br />
provided funding for <strong>the</strong> <strong>NESTOR</strong> project; in<br />
particular <strong>the</strong> General Secretariat for Research<br />
<strong>and</strong> Technology <strong>of</strong> <strong>the</strong> Greek Ministry <strong>of</strong> Development,<br />
<strong>the</strong> General Secretariat <strong>of</strong> Peloponnesus<br />
<strong>and</strong> <strong>the</strong> German Bundesministerium fur Bildung<br />
und Forschung, Germany. We are also grateful to<br />
<strong>the</strong> Wolfermann-Naegeli foundation in Kuesnacht<br />
(CH) for its support in <strong>the</strong> preparation phase<br />
leading to <strong>the</strong> results discussed in this paper. We<br />
hope that <strong>the</strong> completion <strong>of</strong> this important stage in<br />
this project demonstrates that <strong>the</strong>ir confidence was<br />
not misplaced.<br />
We also thank John Learned <strong>and</strong> <strong>the</strong> members<br />
<strong>of</strong> <strong>the</strong> DUMAND collaboration who shared<br />
generously with us <strong>the</strong>ir hard gained experience.<br />
References<br />
[1] DUMAND Proposal, Report No. HDC-2-88, 1988 (unpublished).<br />
[2] Baikal Collaboration, <strong>Nucl</strong>. Phys. Proc. (Suppl. 87) (2000)<br />
405.<br />
[3] E. Andres, et al., Astropart. Phys. 13 (2000) 1.<br />
[4] Icecube Collaboration, <strong>Nucl</strong>. Phys. Proc. (Suppl 118)<br />
(2003) 388.<br />
[5] for <strong>NESTOR</strong> coll, <strong>NESTOR</strong>: A Neutrino Particle Astrophysics<br />
Underwater Laboratory for <strong>the</strong> Mediterranean, in:<br />
V.J. Stenger, J.G. Learned, S. Paksava, X. Tata (Eds.),<br />
Proceedings <strong>of</strong> <strong>the</strong> High Energy Neutrino Astrophysics<br />
Workshop, Hawaii, vol. 325, World Scientific, Singapore,<br />
1992.<br />
[6] L.K. Resvanis, in: L.K. Resvanis (Ed.), Proceedings <strong>of</strong> <strong>the</strong><br />
second <strong>NESTOR</strong> International Workshop, 1992, pp. 1–19.<br />
website http://www.nestor.org.gr;<br />
L.K. Resvanis, in: L.K. Resvanis (Ed.), Proceedings <strong>of</strong> <strong>the</strong><br />
third <strong>NESTOR</strong> International Workshop, 1993, pp. 1–17.<br />
website http://www.nestor.org.gr<br />
[7] ANTARES: E. Aslanides, et al. [ANTARES Collaboration],<br />
ANTARES Proposal, astro-ph/9907432, 1999. website<br />
http://antares.in2p3.fr<br />
[8] NEMO: E. Migneco, et al. [NEMO Collaboration], ‘‘The<br />
NEMO Project’’, in: Proceedings <strong>of</strong> <strong>the</strong> VLVnT Workshop,<br />
NIKHEF, Amsterdam 5–8 October 2003, pp. 5–10.<br />
website http://nemoweb.lns.infn.it
ARTICLE IN PRESS<br />
G. Aggouras et al. / <strong>Nucl</strong>ear <strong>Instr</strong>uments <strong>and</strong> Methods in Physics Research A 552 (2005) 420–439 439<br />
[9] <strong>NESTOR</strong> Collaboration, CERN Courier 43 (N9) (2003)<br />
23.<br />
[10] P.K.F. Grieder [<strong>NESTOR</strong> Collaboration], ‘‘<strong>NESTOR</strong> neutrino<br />
telescope status report’’, in: Proceedings <strong>of</strong> <strong>the</strong> 28th<br />
International Cosmic Ray Conference, (ICRC 2003) 1377.<br />
[11] A.G. Tsirigotis [<strong>NESTOR</strong> Collaboration], Proceedings <strong>of</strong><br />
<strong>the</strong> International Europhysics Conference on High Energy<br />
Physics (EPS 2003, Aachen Germany), Eur. Phys. J. C<br />
ISSN, 1434-6044.<br />
[12] S.E. Tzamarias, <strong>NESTOR</strong> Collaboration, in: Proceedings<br />
<strong>of</strong> <strong>the</strong> VLVnT Workshop, NIKHEF, Amsterdam 5–8<br />
October 2003, pp. 11–16.<br />
[13] L.K. Resvanis, ‘‘<strong>NESTOR</strong>, First Results’’, Proceedings <strong>of</strong><br />
<strong>the</strong> eighth International Workshopon Topics in Astroparticle<br />
<strong>and</strong> Underground Physics, (TAUP 2003) September<br />
5–9, 2003, University <strong>of</strong> Washington, Seattle,<br />
Washington, pp. 187–190.<br />
[14] E.G. Anassontzis, et al., Sea Technology (2003) 10.<br />
[15] L.K. Resvanis, in: L.K. Resvanis (Ed.), Proceedings <strong>of</strong> <strong>the</strong><br />
second <strong>NESTOR</strong> International Workshop, 1992, pp. 1–19<br />
http://www.nestor.org.gr<br />
[16] S.A. Khanaev, et al., in: L.K. Resvanis (Ed.), Proceedings<br />
<strong>of</strong> <strong>the</strong> second <strong>NESTOR</strong> International Workshop, 1992,<br />
p. 253. http://www.nestor.org.gr<br />
[17] E.G. Anassontzis, et al., <strong>Nucl</strong>. <strong>Instr</strong>. <strong>and</strong> Meth. A 349<br />
(1994) 242.<br />
[18] T. A. Demidova, et al., in: L.K. Resvanis (Ed.). Proceedings<br />
<strong>of</strong> <strong>the</strong> second <strong>NESTOR</strong> International Workshop,<br />
1992, p. 284. http://www.nestor.org.gr<br />
[19] S<strong>of</strong>oklis Sotiriou, Ph.D. Thesis, University <strong>of</strong> A<strong>the</strong>ns,<br />
http://www.nestor.org.gr<br />
[20] E. Trimonis, et al., in: L.K. Resvanis (Ed.), Proceedings<br />
<strong>of</strong> <strong>the</strong> second <strong>NESTOR</strong> International Workshop, 1992,<br />
p. 321. http://www.nestor.org.gr<br />
[21] E.G. Anassontzis, et al., <strong>Nucl</strong>. <strong>Instr</strong>. <strong>and</strong> Meth. A 479<br />
(2002) 439.<br />
[22] J. Ludvig, Ph Arragain; ‘‘<strong>NESTOR</strong> Shore Board’’, LBNL<br />
Report, October 1999.<br />
[23] Joshua Sopher; ‘‘<strong>NESTOR</strong> FLOOR BOARD’’, Technical<br />
Report, Internal <strong>NESTOR</strong> Publication 2002, http://<br />
www.nestor.org.gr<br />
[24] D. Nygren, et al., ‘‘<strong>NESTOR</strong> Data Acquisition System—<br />
Based on Waveform Capture’’, August 20, LBNL, 1998.<br />
[25] Stuart Kleinfelder, ‘‘Analog Transient Waveform Digitizer’’,<br />
LBNL 1998.<br />
[26] S. Agostinelli, et al., <strong>Nucl</strong>. <strong>Instr</strong>. <strong>and</strong> Meth. A 506 (2003)<br />
250.<br />
[27] A. Okada, Astropart Phys. 2 (1994) 393.<br />
[28] E.J.V. Battle, et al., Proceedings <strong>of</strong> <strong>the</strong> VLVnT Workshop,<br />
NIKHEF, Amsterdam 5–8 October 2003, pp. 41–43.<br />
[29] for <strong>the</strong> ANTARES Collaboration, Eur Phys J C 33 (s01)<br />
(2004) s971.<br />
[30] G. Aggouras, et al., Astropart. Phys. 23 (2005) 377<br />
Apostolos Tsirigotis, Ph.D. Thesis, Hellenic Open University,<br />
http://www.eap.gr/tsirigotis/PhD/index.htm<br />
[31] P.K.F. Grieder, Cosmic Rays at Earth, Elsevier, Amsterdam,<br />
2001 (Chapter 4).<br />
[32] J. Babson, et al., Phys. Rev. D 42 (1990) 3613.<br />
[33] E.V. Bugaev, et al., in: L. K. Resvanis (Ed.), Proceedings<br />
<strong>of</strong> <strong>the</strong> third <strong>NESTOR</strong> International Workshop, 1993,<br />
pp. 268–304. http://www.nestor.org.gr<br />
[34] E.V. Bugaev, et al., Phys. Rev. D 58 (1998) 054001.<br />
[35] I. F. Barinov et al., in: L.K. Resvanis (Ed.), Proceedings<br />
<strong>of</strong> <strong>the</strong> second <strong>NESTOR</strong> International Workshop, 1992,<br />
p. 340. http://www.nestor.org.gr<br />
[36] T. Sjo¨str<strong>and</strong>, Comput. Phys. Commun. 82 (1994) 74.<br />
[37] R.L. Ford, W.R. Nelson, Stanford Linear Accelerator<br />
Center Report SLAC-210, 1978.