Population size and structure of three mussel species (Bivalvia ...
Population size and structure of three mussel species (Bivalvia ...
Population size and structure of three mussel species (Bivalvia ...

You also want an ePaper? Increase the reach of your titles
YUMPU automatically turns print PDFs into web optimized ePapers that Google loves.
174<br />
S<strong>and</strong>, org. matter [%]<br />
90<br />
60<br />
30<br />
0<br />
Sediment<br />
II I III<br />
Station<br />
0,15 0.15<br />
0,10 0.10<br />
0,05 0.05<br />
0,00 0.00<br />
Current velocity [m/s]<br />
s<strong>and</strong> org.matter current velocity<br />
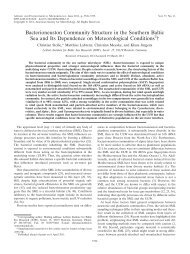
Figure 3. Average percentages <strong>of</strong> s<strong>and</strong> <strong>and</strong> organic matter in<br />
the sediments as well as the average current velocity measured<br />
in the water column. I, II, III ¼ sampling stations.<br />
A comparison <strong>of</strong> the dominance <strong>structure</strong>s<br />
observed at the <strong>three</strong> stations by means <strong>of</strong><br />
Renkonen’s coefficient underlined the special position<br />
<strong>of</strong> station II (Table 3).<br />
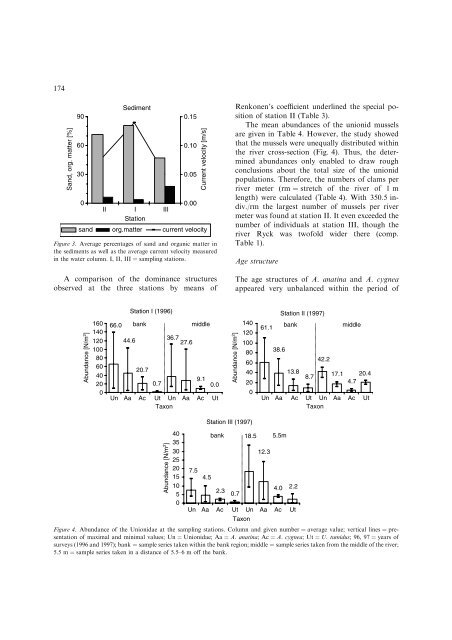
The mean abundances <strong>of</strong> the unionid <strong>mussel</strong>s<br />
are given in Table 4. However, the study showed<br />
that the <strong>mussel</strong>s were unequally distributed within<br />
the river cross-section (Fig. 4). Thus, the determined<br />
abundances only enabled to draw rough<br />
conclusions about the total <strong>size</strong> <strong>of</strong> the unionid<br />
populations. Therefore, the numbers <strong>of</strong> clams per<br />
river meter (rm ¼ stretch <strong>of</strong> the river <strong>of</strong> 1 m<br />
length) were calculated (Table 4). With 350.5 indiv./rm<br />
the largest number <strong>of</strong> <strong>mussel</strong>s per river<br />
meter was found at station II. It even exceeded the<br />
number <strong>of</strong> individuals at station III, though the<br />
river Ryck was tw<strong>of</strong>old wider there (comp.<br />
Table 1).<br />
Age <strong>structure</strong><br />
The age <strong>structure</strong>s <strong>of</strong> A. anatina <strong>and</strong> A. cygnea<br />
appeared very unbalanced within the period <strong>of</strong><br />
Station I (1996)<br />
Station II (1997)<br />
Abundance [N/m 2 ]<br />
160<br />
140<br />
120<br />
100<br />
80<br />
60<br />
40<br />
20<br />
0<br />
66.0<br />
44.6<br />
bank<br />
20.7<br />
0.7<br />
middle<br />
36.7 27.6<br />
9.1<br />
0.0<br />
Un Aa Ac Ut Un Aa Ac Ut<br />
Taxon<br />
Abundance [N/m 2 ]<br />
140<br />
120<br />
100<br />
80<br />
60<br />
40<br />
20<br />
0<br />
61.1<br />
38.6<br />
bank<br />
13.8<br />
8.7<br />
42.2<br />
middle<br />
17.1 20.4<br />
4.7<br />
Un Aa Ac Ut Un Aa Ac Ut<br />
Taxon<br />
Abundance [N/m 2 ]<br />
40<br />
35<br />
30<br />
25<br />
20<br />
15<br />
10<br />
5<br />
0<br />
7.5<br />
Station III (1997)<br />
4.5<br />
bank 18.5 5.5m<br />
2.3 0.7<br />
12.3<br />
4.0 2.2<br />
Un Aa Ac Ut Un Aa Ac Ut<br />
Taxon<br />
Figure 4. Abundance <strong>of</strong> the Unionidae at the sampling stations. Column <strong>and</strong> given number ¼ average value; vertical lines ¼ presentation<br />
<strong>of</strong> maximal <strong>and</strong> minimal values; Un ¼ Unionidae; Aa ¼ A. anatina; Ac¼ A. cygnea; Ut¼ U. tumidus; 96, 97 ¼ years <strong>of</strong><br />
surveys (1996 <strong>and</strong> 1997); bank ¼ sample series taken within the bank region; middle ¼ sample series taken from the middle <strong>of</strong> the river;<br />
5.5 m ¼ sample series taken in a distance <strong>of</strong> 5.5–6 m <strong>of</strong>f the bank.