Population size and structure of three mussel species (Bivalvia ...
Population size and structure of three mussel species (Bivalvia ...
Population size and structure of three mussel species (Bivalvia ...

You also want an ePaper? Increase the reach of your titles
YUMPU automatically turns print PDFs into web optimized ePapers that Google loves.
175<br />
Dominance [%]<br />
80<br />
70<br />
60<br />
50<br />
40<br />
30<br />
20<br />
10<br />
0<br />
Station I<br />
II<br />
III<br />
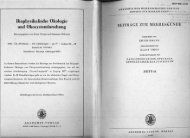
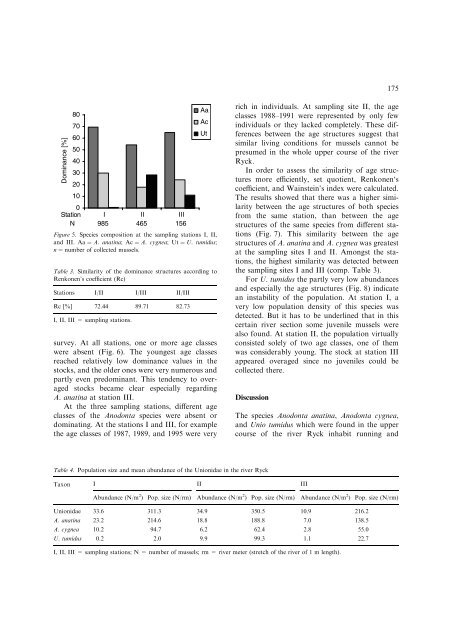
N 985 465 156<br />
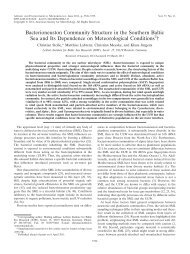
Figure 5. Species composition at the sampling stations I, II,<br />
<strong>and</strong> III. Aa ¼ A. anatina; Ac¼ A. cygnea; Ut¼ U. tumidus;<br />
n ¼ number <strong>of</strong> collected <strong>mussel</strong>s.<br />
Table 3. Similarity <strong>of</strong> the dominance <strong>structure</strong>s according to<br />
Renkonen’s coefficient (Rc)<br />
Stations I/II I/III II/III<br />
Rc [%] 72.44 89.71 82.73<br />
I, II, III = sampling stations.<br />
survey. At all stations, one or more age classes<br />
were absent (Fig. 6). The youngest age classes<br />
reached relatively low dominance values in the<br />
stocks, <strong>and</strong> the older ones were very numerous <strong>and</strong><br />
partly even predominant. This tendency to overaged<br />
stocks became clear especially regarding<br />
A. anatina at station III.<br />
At the <strong>three</strong> sampling stations, different age<br />
classes <strong>of</strong> the Anodonta <strong>species</strong> were absent or<br />
dominating. At the stations I <strong>and</strong> III, for example<br />
the age classes <strong>of</strong> 1987, 1989, <strong>and</strong> 1995 were very<br />
Aa<br />
Ac<br />
Ut<br />
rich in individuals. At sampling site II, the age<br />
classes 1988–1991 were represented by only few<br />
individuals or they lacked completely. These differences<br />
between the age <strong>structure</strong>s suggest that<br />
similar living conditions for <strong>mussel</strong>s cannot be<br />
presumed in the whole upper course <strong>of</strong> the river<br />
Ryck.<br />
In order to assess the similarity <strong>of</strong> age <strong>structure</strong>s<br />
more efficiently, set quotient, Renkonen‘s<br />
coefficient, <strong>and</strong> Wainstein’s index were calculated.<br />
The results showed that there was a higher similarity<br />
between the age <strong>structure</strong>s <strong>of</strong> both <strong>species</strong><br />
from the same station, than between the age<br />
<strong>structure</strong>s <strong>of</strong> the same <strong>species</strong> from different stations<br />
(Fig. 7). This similarity between the age<br />
<strong>structure</strong>s <strong>of</strong> A. anatina <strong>and</strong> A. cygnea was greatest<br />
at the sampling sites I <strong>and</strong> II. Amongst the stations,<br />
the highest similarity was detected between<br />
the sampling sites I <strong>and</strong> III (comp. Table 3).<br />
For U. tumidus the partly very low abundances<br />
<strong>and</strong> especially the age <strong>structure</strong>s (Fig. 8) indicate<br />
an instability <strong>of</strong> the population. At station I, a<br />
very low population density <strong>of</strong> this <strong>species</strong> was<br />
detected. But it has to be underlined that in this<br />
certain river section some juvenile <strong>mussel</strong>s were<br />
also found. At station II, the population virtually<br />
consisted solely <strong>of</strong> two age classes, one <strong>of</strong> them<br />
was considerably young. The stock at station III<br />
appeared overaged since no juveniles could be<br />
collected there.<br />
Discussion<br />
The <strong>species</strong> Anodonta anatina, Anodonta cygnea,<br />
<strong>and</strong> Unio tumidus which were found in the upper<br />
course <strong>of</strong> the river Ryck inhabit running <strong>and</strong><br />
Table 4. <strong>Population</strong> <strong>size</strong> <strong>and</strong> mean abundance <strong>of</strong> the Unionidae in the river Ryck<br />
Taxon I II III<br />
Abundance (N/m 2 ) Pop. <strong>size</strong> (N/rm) Abundance (N/m 2 ) Pop. <strong>size</strong> (N/rm) Abundance (N/m 2 ) Pop. <strong>size</strong> (N/rm)<br />
Unionidae 33.6 311.3 34.9 350.5 10.9 216.2<br />
A. anatina 23.2 214.6 18.8 188.8 7.0 138.5<br />
A. cygnea 10.2 94.7 6.2 62.4 2.8 55.0<br />
U. tumidus 0.2 2.0 9.9 99.3 1.1 22.7<br />
I, II, III = sampling stations; N = number <strong>of</strong> <strong>mussel</strong>s; rm = river meter (stretch <strong>of</strong> the river <strong>of</strong> 1 m length).