Caledonian Ward Profile - Islington Council
Caledonian Ward Profile - Islington Council
Caledonian Ward Profile - Islington Council

Create successful ePaper yourself
Turn your PDF publications into a flip-book with our unique Google optimized e-Paper software.
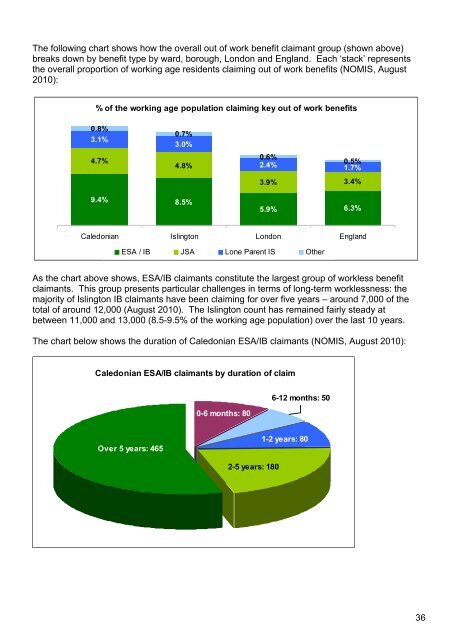
The following chart shows how the overall out of work benefit claimant group (shown above)<br />
breaks down by benefit type by ward, borough, London and England. Each ‘stack’ represents<br />
the overall proportion of working age residents claiming out of work benefits (NOMIS, August<br />
2010):<br />
% of the working age population claiming key out of work benefits<br />
0.8%<br />
3.1%<br />
4.7%<br />
0.7%<br />
3.0%<br />
4.8%<br />
0.6%<br />
2.4%<br />
0.5%<br />
1.7%<br />
3.9% 3.4%<br />
9.4% 8.5%<br />
5.9% 6.3%<br />
<strong>Caledonian</strong> <strong>Islington</strong> London England<br />
ESA / IB JSA Lone Parent IS Other<br />
As the chart above shows, ESA/IB claimants constitute the largest group of workless benefit<br />
claimants. This group presents particular challenges in terms of long-term worklessness: the<br />
majority of <strong>Islington</strong> IB claimants have been claiming for over five years – around 7,000 of the<br />
total of around 12,000 (August 2010). The <strong>Islington</strong> count has remained fairly steady at<br />
between 11,000 and 13,000 (8.5-9.5% of the working age population) over the last 10 years.<br />
The chart below shows the duration of <strong>Caledonian</strong> ESA/IB claimants (NOMIS, August 2010):<br />
<strong>Caledonian</strong> ESA/IB claimants by duration of claim<br />
0-6 months: 80<br />
6-12 months: 50<br />
Over 5 years: 465<br />
1-2 years: 80<br />
2-5 years: 180<br />
36