OPENING SESSION - ismrm
OPENING SESSION - ismrm
OPENING SESSION - ismrm
You also want an ePaper? Increase the reach of your titles
YUMPU automatically turns print PDFs into web optimized ePapers that Google loves.
Monday AM<br />
DfMRI and BOLD responses were also observed, such as negative BOLD signals accompanying positive DfMRI responses<br />
supporting the assumption that the DfMRI and BOLD responses have different origins.<br />
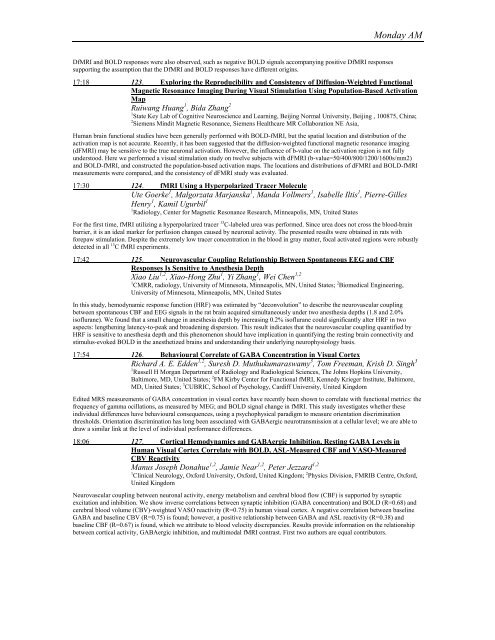
17:18 123. Exploring the Reproducibility and Consistency of Diffusion-Weighted Functional<br />
Magnetic Resonance Imaging During Visual Stimulation Using Population-Based Activation<br />
Map<br />
Ruiwang Huang 1 , Bida Zhang 2<br />
1 State Key Lab of Cognitive Neuroscience and Learning, Beijing Normal University, Beijing , 100875, China;<br />
2 Siemens Mindit Magnetic Resonance, Siemens Healthcare MR Collaboration NE Asia,<br />
Human brain functional studies have been generally performed with BOLD-fMRI, but the spatial location and distribution of the<br />
activation map is not accurate. Recently, it has been suggested that the diffusion-weighted functional magnetic resonance imaging<br />
(dFMRI) may be sensitive to the true neuronal activation. However, the influence of b-value on the activation region is not fully<br />
understood. Here we performed a visual stimulation study on twelve subjects with dFMRI (b-value=50/400/800/1200/1600s/mm2)<br />
and BOLD-fMRI, and constructed the population-based activation maps. The locations and distributions of dFMRI and BOLD-fMRI<br />
measurements were compared, and the consistency of dFMRI study was evaluated.<br />
17:30 124. fMRI Using a Hyperpolarized Tracer Molecule<br />
Ute Goerke 1 , Malgorzata Marjanska 1 , Manda Vollmers 1 , Isabelle Iltis 1 , Pierre-Gilles<br />
Henry 1 , Kamil Ugurbil 1<br />
1 Radiology, Center for Magnetic Resonance Research, Minneapolis, MN, United States<br />
For the first time, fMRI utilizing a hyperpolarized tracer 13 C-labeled urea was performed. Since urea does not cross the blood-brain<br />
barrier, it is an ideal marker for perfusion changes caused by neuronal activity. The presented results were obtained in rats with<br />
forepaw stimulation. Despite the extremely low tracer concentration in the blood in gray matter, focal activated regions were robustly<br />
detected in all 13 C fMRI experiments.<br />
17:42 125. Neurovascular Coupling Relationship Between Spontaneous EEG and CBF<br />
Responses Is Sensitive to Anesthesia Depth<br />
Xiao Liu 1,2 , Xiao-Hong Zhu 1 , Yi Zhang 1 , Wei Chen 1,2<br />
1 CMRR, radiology, University of Minnesota, Minneapolis, MN, United States; 2 Biomedical Engineering,<br />
University of Minnesota, Minneapolis, MN, United States<br />
In this study, hemodynamic response function (HRF) was estimated by “deconvolution” to describe the neurovascular coupling<br />
between spontaneous CBF and EEG signals in the rat brain acquired simultaneously under two anesthesia depths (1.8 and 2.0%<br />
isoflurane). We found that a small change in anesthesia depth by increasing 0.2% isoflurane could significantly alter HRF in two<br />
aspects: lengthening latency-to-peak and broadening dispersion. This result indicates that the neurovascular coupling quantified by<br />
HRF is sensitive to anesthesia depth and this phenomenon should have implication in quantifying the resting brain connectivity and<br />
stimulus-evoked BOLD in the anesthetized brains and understanding their underlying neurophysiology basis.<br />
17:54 126. Behavioural Correlate of GABA Concentration in Visual Cortex<br />
Richard A. E. Edden 1,2 , Suresh D. Muthukumaraswamy 3 , Tom Freeman, Krish D. Singh 3<br />
1 Russell H Morgan Department of Radiology and Radiological Sciences, The Johns Hopkins University,<br />
Baltimore, MD, United States; 2 FM Kirby Center for Functional fMRI, Kennedy Krieger Institute, Baltimore,<br />
MD, United States; 3 CUBRIC, School of Psychology, Cardiff University, United Kingdom<br />
Edited MRS measurements of GABA concentration in visual cortex have recently been shown to correlate with functional metrics: the<br />
frequency of gamma ocillations, as measured by MEG; and BOLD signal change in fMRI. This study investigates whether these<br />
individual differences have behavioural consequences, using a psychophysical paradigm to measure orientation discrimination<br />
thresholds. Orientation discrimination has long been associated with GABAergic neurotransmission at a cellular level; we are able to<br />
draw a similar link at the level of individual performance differences.<br />
18:06 127. Cortical Hemodynamics and GABAergic Inhibition. Resting GABA Levels in<br />
Human Visual Cortex Correlate with BOLD, ASL-Measured CBF and VASO-Measured<br />
CBV Reactivity<br />
Manus Joseph Donahue 1,2 , Jamie Near 1,2 , Peter Jezzard 1,2<br />
1 Clinical Neurology, Oxford University, Oxford, United Kingdom; 2 Physics Division, FMRIB Centre, Oxford,<br />
United Kingdom<br />
Neurovascular coupling between neuronal activity, energy metabolism and cerebral blood flow (CBF) is supported by synaptic<br />
excitation and inhibition. We show inverse correlations between synaptic inhibition (GABA concentration) and BOLD (R=0.68) and<br />
cerebral blood volume (CBV)-weighted VASO reactivity (R=0.75) in human visual cortex. A negative correlation between baseline<br />
GABA and baseline CBV (R=0.75) is found; however, a positive relationship between GABA and ASL reactivity (R=0.38) and<br />
baseline CBF (R=0.67) is found, which we attribute to blood velocity discrepancies. Results provide information on the relationship<br />
between cortical activity, GABAergic inhibition, and multimodal fMRI contrast. First two authors are equal contributors.


