
You also want an ePaper? Increase the reach of your titles
YUMPU automatically turns print PDFs into web optimized ePapers that Google loves.
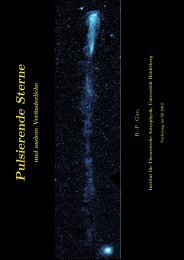
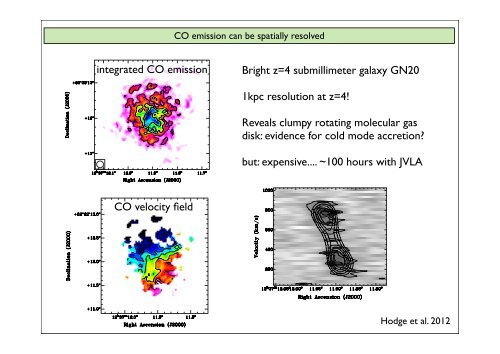
integr<strong>at</strong>ed CO emission<br />
CO velocity field<br />
Fig. 6.— CO(2–1) 0th (top) and 1st (bottom) moment maps for<br />
GN20 <strong>at</strong> intermedi<strong>at</strong>e resolution (0.19 ′′ ). The 0th moment map<br />
(i.e. integr<strong>at</strong>ed intensity) shows contours starting <strong>at</strong> (and in steps<br />
of) 594 µJy km s −1 .The1stmomentmap(i.e.,intensity–weighted<br />
CO emission can be sp<strong>at</strong>ially resolved<br />
<strong>Molecular</strong> <strong>Gas</strong> in GN20 7<br />
ity, bottom), which shows a zoomed–in region of the 0th<br />
moment map. Although some noise is still present in the<br />
outskirts, a clear velocity gradient is apparent across the<br />
disk.<br />
Bright z=4 submillimeter galaxy GN20<br />
4.2.2. Dynamical Modeling<br />
1kpc resolution <strong>at</strong> z=4!<br />
For the dynamical modeling of GN20, we used the<br />
GALMOD task (part of the GIPSY package). We used<br />
an input d<strong>at</strong>a cube with a spectral resolution of 26 km<br />
s −1 ,andwetaperedthed<strong>at</strong><strong>at</strong>oanangularresolutionof<br />
0.77 ′′ as it was found th<strong>at</strong> higher resolutions resolved out<br />
too much flux to be usable for modeling. The GALMOD<br />
task requires a radial profile as input, which (guided by<br />
the 0th moment map) we set as an exponential radial<br />
profile with a slope of –0.4. We used a thin disk model<br />
and we found th<strong>at</strong> changes in the thickness of the disk<br />
(within a reasonable range, < few kpc) did not result in<br />
major changes to the model.<br />
While the 8 resolution of the d<strong>at</strong>a make it difficult to<br />
constrain the exact shape of the rot<strong>at</strong>ion curve, we find<br />
th<strong>at</strong> the velocity field is fully consistent with a rot<strong>at</strong>ing<br />
disk with a steeply–rising rot<strong>at</strong>ion curve th<strong>at</strong> quickly<br />
fl<strong>at</strong>tens. By comparing different models to the d<strong>at</strong>a, we<br />
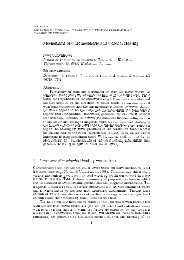
found th<strong>at</strong> the best–fit model (Figure 7) was a rot<strong>at</strong>ing<br />
disk with an inclin<strong>at</strong>ion of i =30 ◦ ± 15 ◦ ,amaximum<br />
rot<strong>at</strong>ional velocity of v max =575± 100 km s −1 ,anda<br />
dispersion of δ =100± 30 km s −1 . Note th<strong>at</strong> deriving<br />
the dispersion from a sp<strong>at</strong>ially and spectrally convolved<br />
disk model, unlike other mean–weighted dispersion estim<strong>at</strong>ors,<br />
is unbiased by beam smearing(Daviesetal.<br />
2011).<br />
The rel<strong>at</strong>ively large value of v max is due to the fairly<br />
low value found for the inclin<strong>at</strong>ion; while v max ×sin(i)<br />
is well constrained, the two are difficult to disentangle<br />
<strong>at</strong> our angular resolution. The final inclin<strong>at</strong>ion value of<br />
30 ◦ was chosen to reproduce the resulting ellipticity in<br />
the 0th moment map, but we cannot definitively rule<br />
Fig. 7.— Major axis position–velocity diagram for CO(2–1) in<br />
out largerGN20, values taken of the <strong>at</strong> a inclin<strong>at</strong>ion position angle(within of 25 ◦ . The the velocities quoted on the<br />
error), andvertical therefore axis are lower rel<strong>at</strong>ive. values Greyscale of v max and thin . The countours uncertainty<br />
quoted for v max folds in the uncertainty in the<br />
show the<br />
observed d<strong>at</strong>a, and thick contours show the best fit model (see text<br />
for details).<br />
inclin<strong>at</strong>ion.<br />
The blanking on higher–J process transition allows us lines; to recover Daddi et more al. 2009b; of theCarilli<br />
diffuse emission et al. 2010). from GN20, We will and usethis, thisin estim<strong>at</strong>e turn, leads to setto limits a on<br />
larger disk. From the 0th moment map, we estim<strong>at</strong>e a ra-<br />
Reveals clumpy rot<strong>at</strong>ing molecular gas<br />
disk: evidence for cold mode accretion?<br />
but: expensive.... ~100 hours with JVLA<br />
ignored the contribution from d<br />
make up only a tiny fraction of<br />
M ⊙ ;Magdisetal.2011).Weha<br />
tribution from dark m<strong>at</strong>ter, wh<br />
even further. Including 15% da<br />
observ<strong>at</strong>ion th<strong>at</strong> the dark m<strong>at</strong>ter<br />
ies is 10–20% (Genzel et al. 2008<br />
upper limit on the conversion f<br />
M ⊙ (K km s −1 pc 2 ) −1 . A conv<br />
M ⊙ (K km s −1 pc 2 ) −1 as seen<br />
(Daddi et al. 2010; Tacconi et a<br />
likely as well. Our constraints o<br />
the limit α < 1.0 derived using t<br />
metallicity rel<strong>at</strong>ion (Magdis et a<br />
Note th<strong>at</strong> the l<strong>at</strong>ter case resul<br />
m<strong>at</strong>e of 2.3 × 10 11 M ⊙ .Thisalso<br />
derived by Daddi et al. (2009b)<br />
the ACS through IRAC photome<br />
ing a Chabrier (2003) IMF. Thi<br />
uncertainties associ<strong>at</strong>ed with st<br />
SMGs, but the agreement is inte<br />
look <strong>at</strong> this multiwavelength da<br />
for GN20, in the next section.<br />
Hodge et al. 2012<br />
4.3. Multiwavelength