True Coincidence Summing Correction in Gamma Spectroscopy
True Coincidence Summing Correction in Gamma Spectroscopy
True Coincidence Summing Correction in Gamma Spectroscopy

You also want an ePaper? Increase the reach of your titles
YUMPU automatically turns print PDFs into web optimized ePapers that Google loves.
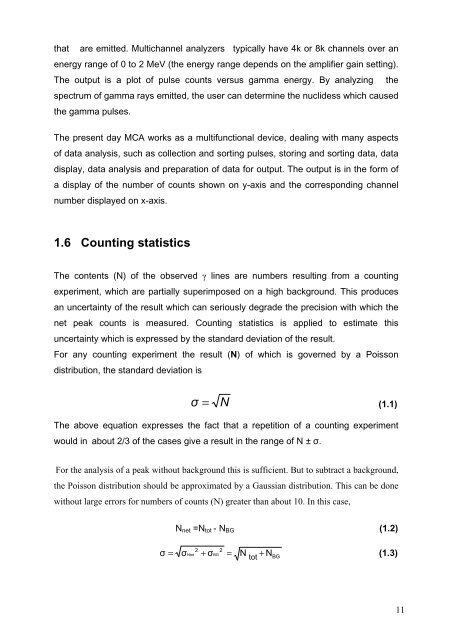
that are emitted. Multichannel analyzers typically have 4k or 8k channels over an<br />
energy range of 0 to 2 MeV (the energy range depends on the amplifier ga<strong>in</strong> sett<strong>in</strong>g).<br />
The output is a plot of pulse counts versus gamma energy. By analyz<strong>in</strong>g the<br />
spectrum of gamma rays emitted, the user can determ<strong>in</strong>e the nuclidess which caused<br />
the gamma pulses.<br />
The present day MCA works as a multifunctional device, deal<strong>in</strong>g with many aspects<br />
of data analysis, such as collection and sort<strong>in</strong>g pulses, stor<strong>in</strong>g and sort<strong>in</strong>g data, data<br />
display, data analysis and preparation of data for output. The output is <strong>in</strong> the form of<br />
a display of the number of counts shown on y-axis and the correspond<strong>in</strong>g channel<br />
number displayed on x-axis.<br />
1.6 Count<strong>in</strong>g statistics<br />
The contents (N) of the observed γ l<strong>in</strong>es are numbers result<strong>in</strong>g from a count<strong>in</strong>g<br />
experiment, which are partially superimposed on a high background. This produces<br />
an uncerta<strong>in</strong>ty of the result which can seriously degrade the precision with which the<br />
net peak counts is measured. Count<strong>in</strong>g statistics is applied to estimate this<br />
uncerta<strong>in</strong>ty which is expressed by the standard deviation of the result.<br />
For any count<strong>in</strong>g experiment the result (N) of which is governed by a Poisson<br />
distribution, the standard deviation is<br />
σ = N<br />
(1.1)<br />
The above equation expresses the fact that a repetition of a count<strong>in</strong>g experiment<br />
would <strong>in</strong> about 2/3 of the cases give a result <strong>in</strong> the range of N ± σ.<br />
For the analysis of a peak without background this is sufficient. But to subtract a background,<br />
the Poisson distribution should be approximated by a Gaussian distribution. This can be done<br />
without large errors for numbers of counts (N) greater than about 10. In this case,<br />
N net =N tot - N BG (1.2)<br />
σ<br />
= 2 2<br />
σ + σ =<br />
Ntot<br />
BG N N<br />
(1.3)<br />
BG<br />
tot +<br />
11