True Coincidence Summing Correction in Gamma Spectroscopy
True Coincidence Summing Correction in Gamma Spectroscopy
True Coincidence Summing Correction in Gamma Spectroscopy

Create successful ePaper yourself
Turn your PDF publications into a flip-book with our unique Google optimized e-Paper software.
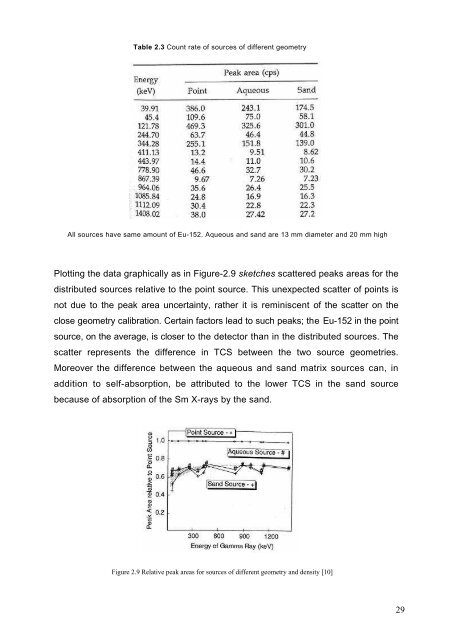
Table 2.3 Count rate of sources of different geometry<br />
All sources have same amount of Eu-152. Aqueous and sand are 13 mm diameter and 20 mm high<br />
Plott<strong>in</strong>g the data graphically as <strong>in</strong> Figure-2.9 sketches scattered peaks areas for the<br />
distributed sources relative to the po<strong>in</strong>t source. This unexpected scatter of po<strong>in</strong>ts is<br />
not due to the peak area uncerta<strong>in</strong>ty, rather it is rem<strong>in</strong>iscent of the scatter on the<br />
close geometry calibration. Certa<strong>in</strong> factors lead to such peaks; the Eu-152 <strong>in</strong> the po<strong>in</strong>t<br />
source, on the average, is closer to the detector than <strong>in</strong> the distributed sources. The<br />
scatter represents the difference <strong>in</strong> TCS between the two source geometries.<br />
Moreover the difference between the aqueous and sand matrix sources can, <strong>in</strong><br />
addition to self-absorption, be attributed to the lower TCS <strong>in</strong> the sand source<br />
because of absorption of the Sm X-rays by the sand.<br />
Figure 2.9 Relative peak areas for sources of different geometry and density [10]<br />
29