A Process and Outcome Evaluation of the 4-H Mentoring/ Youth and ...
A Process and Outcome Evaluation of the 4-H Mentoring/ Youth and ...
A Process and Outcome Evaluation of the 4-H Mentoring/ Youth and ...
You also want an ePaper? Increase the reach of your titles
YUMPU automatically turns print PDFs into web optimized ePapers that Google loves.
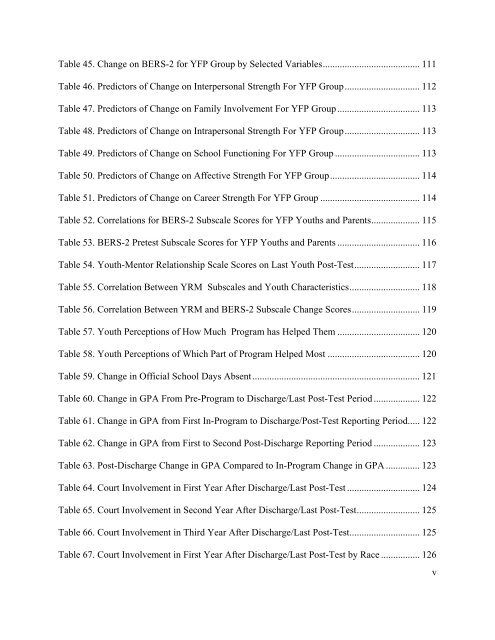
Table 45. Change on BERS-2 for YFP Group by Selected Variables ........................................ 111<br />
Table 46. Predictors <strong>of</strong> Change on Interpersonal Strength For YFP Group ............................... 112<br />
Table 47. Predictors <strong>of</strong> Change on Family Involvement For YFP Group .................................. 113<br />
Table 48. Predictors <strong>of</strong> Change on Intrapersonal Strength For YFP Group ............................... 113<br />
Table 49. Predictors <strong>of</strong> Change on School Functioning For YFP Group ................................... 113<br />
Table 50. Predictors <strong>of</strong> Change on Affective Strength For YFP Group ..................................... 114<br />
Table 51. Predictors <strong>of</strong> Change on Career Strength For YFP Group ......................................... 114<br />
Table 52. Correlations for BERS-2 Subscale Scores for YFP <strong>Youth</strong>s <strong>and</strong> Parents .................... 115<br />
Table 53. BERS-2 Pretest Subscale Scores for YFP <strong>Youth</strong>s <strong>and</strong> Parents .................................. 116<br />
Table 54. <strong>Youth</strong>-Mentor Relationship Scale Scores on Last <strong>Youth</strong> Post-Test ........................... 117<br />
Table 55. Correlation Between YRM Subscales <strong>and</strong> <strong>Youth</strong> Characteristics ............................. 118<br />
Table 56. Correlation Between YRM <strong>and</strong> BERS-2 Subscale Change Scores ............................ 119<br />
Table 57. <strong>Youth</strong> Perceptions <strong>of</strong> How Much Program has Helped Them .................................. 120<br />
Table 58. <strong>Youth</strong> Perceptions <strong>of</strong> Which Part <strong>of</strong> Program Helped Most ...................................... 120<br />
Table 59. Change in Official School Days Absent ..................................................................... 121<br />
Table 60. Change in GPA From Pre-Program to Discharge/Last Post-Test Period ................... 122<br />
Table 61. Change in GPA from First In-Program to Discharge/Post-Test Reporting Period ..... 122<br />
Table 62. Change in GPA from First to Second Post-Discharge Reporting Period ................... 123<br />
Table 63. Post-Discharge Change in GPA Compared to In-Program Change in GPA .............. 123<br />
Table 64. Court Involvement in First Year After Discharge/Last Post-Test .............................. 124<br />
Table 65. Court Involvement in Second Year After Discharge/Last Post-Test .......................... 125<br />
Table 66. Court Involvement in Third Year After Discharge/Last Post-Test ............................. 125<br />
Table 67. Court Involvement in First Year After Discharge/Last Post-Test by Race ................ 126<br />
v


