Comprehensive Annual Financial Report 2012 - Kettering City ...
Comprehensive Annual Financial Report 2012 - Kettering City ...
Comprehensive Annual Financial Report 2012 - Kettering City ...

Create successful ePaper yourself
Turn your PDF publications into a flip-book with our unique Google optimized e-Paper software.
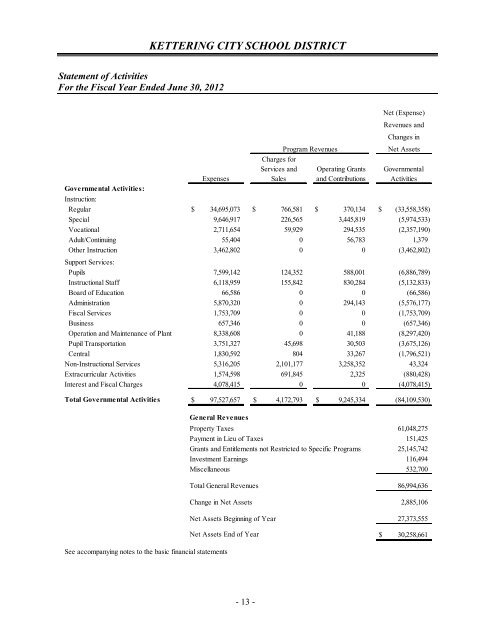
KETTERING CITY SCHOOL DISTRICT<br />
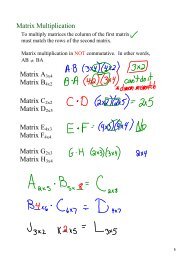
Statement of Activities<br />
For the Fiscal Year Ended June 30, <strong>2012</strong><br />
Expenses<br />
Governmental Activities:<br />
Instruction:<br />
Regular 34,695,073<br />
Charges for<br />
Services and<br />
Sales<br />
Program Revenues<br />
Operating Grants<br />
and Contributions<br />
Net (Expense)<br />
Revenues and<br />
Changes in<br />
Net Assets<br />
Governmental<br />
Activities<br />
$ $ 766,581 $ 370,134 $ (33,558,358)<br />
Special 9,646,917 226,565 3,445,819 (5,974,533)<br />
Vocational 2,711,654 59,929 294,535 (2,357,190)<br />
Adult/Continuing 55,404 0 56,783 1,379<br />
Other Instruction 3,462,802 0 0 (3,462,802)<br />
Support Services:<br />
Pupils 7,599,142 124,352 588,001 (6,886,789)<br />
Instructional Staff 6,118,959 155,842 830,284 (5,132,833)<br />
Board of Education 66,586 0 0 (66,586)<br />
Administration 5,870,320 0 294,143 (5,576,177)<br />
Fiscal Services 1,753,709 0 0 (1,753,709)<br />
Business 657,346 0 0 (657,346)<br />
Operation and Maintenance of Plant 8,338,608 0 41,188 (8,297,420)<br />
Pupil Transportation 3,751,327 45,698 30,503 (3,675,126)<br />
Central 1,830,592 804 33,267 (1,796,521)<br />
Non-Instructional Services 5,316,205 2,101,177 3,258,352 43,324<br />
Extracurricular Activities 1,574,598 691,845 2,325 (880,428)<br />
Interest and Fiscal Charges 4,078,415 0 0 (4,078,415)<br />
Total Governmental Activities $ 97,527,657 $ 4,172,793 $ 9,245,334 (84,109,530)<br />
General Revenues<br />
See accompanying notes to the basic financial statements<br />
Property Taxes<br />
Payment in Lieu of Taxes<br />
Grants and Entitlements not Restricted to Specific Programs<br />
Investment Earnings<br />
Miscellaneous<br />
Total General Revenues<br />
Change in Net Assets<br />
Net Assets Beginning of Year<br />
Net Assets End of Year<br />
$<br />
61,048,275<br />
151,425<br />
25,145,742<br />
116,494<br />
532,700<br />
86,994,636<br />
2,885,106<br />
27,373,555<br />
30,258,661<br />
DRAFT - 13 - 12/18/<strong>2012</strong>