Ground-Water Hydrology of the Upper Klamath Basin, Oregon and ...
Ground-Water Hydrology of the Upper Klamath Basin, Oregon and ...
Ground-Water Hydrology of the Upper Klamath Basin, Oregon and ...

Create successful ePaper yourself
Turn your PDF publications into a flip-book with our unique Google optimized e-Paper software.
Prepared in cooperation with <strong>the</strong> <strong>Oregon</strong> <strong>Water</strong> Resources Department<br />
<strong>Ground</strong>-<strong>Water</strong> <strong>Hydrology</strong> <strong>of</strong> <strong>the</strong> <strong>Upper</strong> <strong>Klamath</strong> <strong>Basin</strong>,<br />
<strong>Oregon</strong> <strong>and</strong> California<br />
Scientific Investigations Report 2007–5050<br />
U.S. Department <strong>of</strong> <strong>the</strong> Interior<br />
U.S. Geological Survey
Cover photographs: left, <strong>Klamath</strong> Marsh at Military Crossing, looking west, (photo by Marshall Gannett);<br />
upper right, Sprague River Valley from Knot Tablel<strong>and</strong>, looking sou<strong>the</strong>ast (photo by Ken Lite); lower right,<br />
Sheepy Ridge (on <strong>the</strong> left) <strong>and</strong> <strong>the</strong> Tule Lake subbasin from Lava Beds National Monument, looking north<br />
(photo by Marshall Gannett).
<strong>Ground</strong>-<strong>Water</strong> <strong>Hydrology</strong> <strong>of</strong> <strong>the</strong> <strong>Upper</strong><br />
<strong>Klamath</strong> <strong>Basin</strong>, <strong>Oregon</strong> <strong>and</strong> California<br />
By Marshall W. Gannett, Kenneth E. Lite Jr., Jonathan L. La Marche,<br />
Bruce J. Fisher, <strong>and</strong> Danial J. Polette<br />
Prepared in cooperation with <strong>the</strong> <strong>Oregon</strong> <strong>Water</strong> Resources Department<br />
Scientific Investigations Report 2007–5050<br />
U.S. Department <strong>of</strong> <strong>the</strong> Interior<br />
U.S. Geological Survey
U.S. Department <strong>of</strong> <strong>the</strong> Interior<br />
DIRK KEMPTHORNE, Secretary<br />
U.S. Geological Survey<br />
Mark D. Myers, Director<br />
U.S. Geological Survey, Reston, Virginia: 2007<br />
For product <strong>and</strong> ordering information:<br />
World Wide Web: http://www.usgs.gov/pubprod<br />
Telephone: 1-888-ASK-USGS<br />
For more information on <strong>the</strong> USGS--<strong>the</strong> Federal source for science about <strong>the</strong> Earth, its natural <strong>and</strong> living resources,<br />
natural hazards, <strong>and</strong> <strong>the</strong> environment:<br />
World Wide Web: http://www.usgs.gov<br />
Telephone: 1-888-ASK-USGS<br />
Any use <strong>of</strong> trade, product, or firm names is for descriptive purposes only <strong>and</strong> does not imply endorsement by <strong>the</strong><br />
U.S. Government.<br />
Although this report is in <strong>the</strong> public domain, permission must be secured from <strong>the</strong> individual copyright owners to<br />
reproduce any copyrighted materials contained within this report.<br />
Suggested citation:<br />
Gannett, M.W., Lite, K.E. Jr., La Marche, J.L., Fisher, B.J., <strong>and</strong> Polette, D.J., 2007, <strong>Ground</strong>-water hydrology <strong>of</strong> <strong>the</strong><br />
upper <strong>Klamath</strong> <strong>Basin</strong>, <strong>Oregon</strong> <strong>and</strong> California: U.S. Geological Survey Scientific Investigations Report 2007-5050, 84 p.
iii<br />
Contents<br />
Abstract............................................................................................................................................................1<br />
Introduction.....................................................................................................................................................2<br />
Study Area..............................................................................................................................................2<br />
Purpose <strong>and</strong> Scope...............................................................................................................................8<br />
Geologic Framework......................................................................................................................................8<br />
Geologic Controls on <strong>Ground</strong>-<strong>Water</strong> Flow........................................................................................8<br />
General Geology....................................................................................................................................8<br />
Hydrogeologic Units............................................................................................................................10<br />
Effects <strong>of</strong> Geologic Structure............................................................................................................12<br />
Hydraulic Characteristics <strong>of</strong> Regional Hydrogeologic Units........................................................12<br />
Aquifer Tests...............................................................................................................................13<br />
Well-Yield Tests..........................................................................................................................16<br />
<strong>Ground</strong>-<strong>Water</strong> <strong>Hydrology</strong>............................................................................................................................17<br />
Hydrologic Budget...............................................................................................................................18<br />
<strong>Ground</strong>-<strong>Water</strong> Recharge....................................................................................................................20<br />
<strong>Ground</strong>-<strong>Water</strong> Discharge to Streams..............................................................................................22<br />
Geographic Distribution <strong>of</strong> <strong>Ground</strong>-<strong>Water</strong> Discharge to Streams.....................................23<br />
Temporal Fluctuations in <strong>Ground</strong>-<strong>Water</strong> Discharge to Streams........................................23<br />
<strong>Ground</strong>-<strong>Water</strong> Discharge to Streams by Subbasin..............................................................23<br />
Sprague River Subbasin—Geographic Distribution <strong>of</strong><br />
<strong>Ground</strong>-<strong>Water</strong> Discharge...................................................................................23<br />
Sprague River Subbasin—Temporal Variations in<br />
<strong>Ground</strong>-<strong>Water</strong> Discharge...................................................................................26<br />
Williamson River Subbasin—Geographic Distribution <strong>of</strong><br />
<strong>Ground</strong>-<strong>Water</strong> Discharge...................................................................................27<br />
Williamson River Subbasin—Temporal Variations in<br />
<strong>Ground</strong>-<strong>Water</strong> Discharge...................................................................................28<br />
<strong>Upper</strong> <strong>Klamath</strong> Lake Subbasin—Geographic Distribution <strong>of</strong><br />
<strong>Ground</strong>-<strong>Water</strong> Discharge...................................................................................29<br />
<strong>Upper</strong> <strong>Klamath</strong> Lake Subbasin—Temporal Variations in<br />
<strong>Ground</strong>-<strong>Water</strong> Discharge...................................................................................31<br />
Lost River Subbasin—Geographic Distribution <strong>of</strong> <strong>Ground</strong>-<strong>Water</strong> Discharge........32<br />
Lost River Subbasin—Temporal Variations in <strong>Ground</strong>-<strong>Water</strong> Discharge................33<br />
<strong>Klamath</strong> River Subbasin—Geographic Distribution <strong>of</strong><br />
<strong>Ground</strong>-<strong>Water</strong> Discharge...................................................................................34<br />
<strong>Klamath</strong> River Subbasin—Temporal Variations in <strong>Ground</strong>-<strong>Water</strong> Discharge........35<br />
Summary <strong>of</strong> Geographic <strong>and</strong> Temporal Variations <strong>of</strong> <strong>Ground</strong>-<strong>Water</strong> Discharge<br />
to Streams......................................................................................................................37
iv<br />
Contents—Continued<br />
<strong>Ground</strong>-<strong>Water</strong> <strong>Hydrology</strong>—Continued<br />
<strong>Ground</strong>-<strong>Water</strong> Discharge to Wells...................................................................................................38<br />
Methods.......................................................................................................................................38<br />
<strong>Ground</strong>-<strong>Water</strong> Pumpage for Public-Supply Use...................................................................38<br />
<strong>Ground</strong>-<strong>Water</strong> Pumping for Irrigation.....................................................................................38<br />
Recent Increases in <strong>the</strong> Rate <strong>of</strong> <strong>Ground</strong>-<strong>Water</strong> Pumping...................................................41<br />
Hydraulic Head Distribution <strong>and</strong> <strong>Ground</strong>-<strong>Water</strong> Flow Directions...............................................42<br />
Sprague River Subbasin............................................................................................................46<br />
Williamson River Subbasin.......................................................................................................46<br />
<strong>Upper</strong> <strong>Klamath</strong> Lake Subbasin.................................................................................................46<br />
<strong>Upper</strong> Lost River Subbasin........................................................................................................47<br />
<strong>Klamath</strong> Valley............................................................................................................................47<br />
Butte Valley/Red Rock Valley Area..........................................................................................47<br />
Lower <strong>Klamath</strong> Lake Subbasin.................................................................................................48<br />
Tule Lake Subbasin....................................................................................................................48<br />
<strong>Klamath</strong> Canyon Area................................................................................................................48<br />
Fluctuations in Hydraulic Head.........................................................................................................48<br />
Climate-Induced Fluctuations..................................................................................................50<br />
Pumping-Induced Fluctuations................................................................................................51<br />
Response to Canal Leakage.....................................................................................................51<br />
Response to Lake Stage............................................................................................................53<br />
Long-Term <strong>Water</strong>-Table Fluctuations......................................................................................53<br />
Fluctuations in Hydraulic Head in Response to Recent Increases in<br />
<strong>Ground</strong>-<strong>Water</strong> Pumping...............................................................................................59<br />
Summary <strong>and</strong> Discussion............................................................................................................................64<br />
Acknowledgments........................................................................................................................................65<br />
References Cited..........................................................................................................................................66<br />
Appendix A. L<strong>and</strong>sat Analysis Methods..................................................................................................71
Figures<br />
Figure 1. Map showing <strong>the</strong> upper <strong>Klamath</strong> <strong>Basin</strong>, <strong>Oregon</strong> <strong>and</strong> California, <strong>and</strong> major<br />
geographic features… ……………………………………………………………… 3<br />
Figure 2. Map showing distribution <strong>of</strong> precipitation in <strong>the</strong> upper <strong>Klamath</strong> <strong>Basin</strong>, <strong>Oregon</strong><br />
<strong>and</strong> California, <strong>and</strong> mean monthly precipitation at selected precipitation<br />
measurement stations… …………………………………………………………… 5<br />
Figure 3. Map showing irrigated areas in <strong>the</strong> Bureau <strong>of</strong> Reclamation <strong>Klamath</strong> Project,<br />
<strong>Oregon</strong> <strong>and</strong> California… …………………………………………………………… 7<br />
Figure 4. Map showing hydrogeologic units <strong>of</strong> <strong>the</strong> upper <strong>Klamath</strong> <strong>Basin</strong>, <strong>Oregon</strong> <strong>and</strong><br />
California… ………………………………………………………………………… 11<br />
Figure 5. Graph showing cumulative distribution <strong>of</strong> transmissivity values estimated<br />
from specific-capacity tests for wells producing from Quaternary sediment,<br />
Tertiary sedimentary rock, <strong>and</strong> Tertiary volcanic rock in <strong>the</strong> upper <strong>Klamath</strong><br />
<strong>Basin</strong>, <strong>Oregon</strong> <strong>and</strong> California……………………………………………………… 17<br />
Figure 6. Schematic representation <strong>of</strong> sources <strong>of</strong> ground-water recharge, flow paths,<br />
<strong>and</strong> mechanisms <strong>of</strong> ground-water discharge in <strong>the</strong> upper <strong>Klamath</strong> <strong>Basin</strong>,<br />
<strong>Oregon</strong> <strong>and</strong> California… …………………………………………………………… 20<br />
Figure 7. Map showing principal areas <strong>of</strong> ground-water discharge to streams <strong>and</strong><br />
major springs in <strong>the</strong> upper <strong>Klamath</strong> <strong>Basin</strong>, <strong>Oregon</strong> <strong>and</strong> California, <strong>and</strong><br />
selected stream-gaging stations… ………………………………………………… 24<br />
Figure 8. Graph showing annual precipitation at Crater Lake National Park, <strong>Oregon</strong>,<br />
<strong>and</strong> <strong>the</strong> cumulative departure from average precipitation from 1932 to 2005… …… 25<br />
Figure 9. Graph showing September mean discharge <strong>of</strong> <strong>the</strong> Sprague River near<br />
Chiloquin, <strong>Oregon</strong> (USGS gaging station number 11501000), <strong>and</strong> <strong>the</strong><br />
cumulative departure from average precipitation at Crater Lake, <strong>Oregon</strong>… ……… 27<br />
Figure 10. Graph showing monthly mean discharge <strong>and</strong> September mean discharge <strong>of</strong><br />
<strong>the</strong> Williamson River below Sheep Creek near Lenz, <strong>Oregon</strong> (USGS gaging<br />
station number 11491400), <strong>and</strong> <strong>the</strong> cumulative departure from average<br />
precipitation at Crater Lake, <strong>Oregon</strong>………………………………………………… 28<br />
Figure 11. Graph showing relation between <strong>the</strong> September mean discharge <strong>of</strong> <strong>the</strong><br />
Williamson River below Sheep Creek near Lenz, <strong>Oregon</strong> (USGS gaging<br />
station number 11491400), <strong>and</strong> <strong>the</strong> cumulative departure from average<br />
precipitation at Crater Lake, <strong>Oregon</strong>………………………………………………… 29<br />
Figure 12. Graph showing discharge measurements <strong>of</strong> Spring Creek, estimated<br />
ground-water discharge to <strong>the</strong> lower Williamson River between Kirk <strong>and</strong><br />
Chiloquin, <strong>and</strong> cumulative departure from average precipitation at Crater<br />
Lake, <strong>Oregon</strong>………………………………………………………………………… 30<br />
Figure 13. Graph showing monthly mean discharge <strong>and</strong> January to March mean<br />
discharge <strong>of</strong> Annie Spring near Crater Lake, <strong>Oregon</strong> (USGS gaging station<br />
number 11503000), <strong>and</strong> <strong>the</strong> cumulative departure from average precipitation<br />
at Crater Lake… …………………………………………………………………… 31
vi<br />
Figures—Continued<br />
Figure 14. Graph showing discharge <strong>of</strong> <strong>the</strong> Wood River as measured or estimated at<br />
various sites, <strong>and</strong> <strong>the</strong> cumulative departure from average precipitation at<br />
Crater Lake, <strong>Oregon</strong>… ……………………………………………………………… 32<br />
Figure 15. Graph showing discharge <strong>of</strong> Bonanza Springs <strong>and</strong> cumulative departure from<br />
average precipitation at Crater Lake, <strong>Oregon</strong>… …………………………………… 34<br />
Figure 16. Graph showing August mean gains in flow (a proxy for ground-water<br />
discharge) between Keno (USGS gaging station number 11509500) <strong>and</strong> <strong>the</strong><br />
John C. Boyle power plant (11510700), estimates <strong>of</strong> inflow by PacifiCorp, <strong>and</strong><br />
<strong>the</strong> cumulative departure from average precipitation at Crater Lake, <strong>Oregon</strong>… …… 36<br />
Figure 17. Graph showing September to November mean gains in flow (a proxy for<br />
ground-water discharge) between <strong>the</strong> John C. Boyle power plant (USGS<br />
station number 11510700) <strong>and</strong> Iron Gate Dam (11516530), <strong>and</strong> <strong>the</strong> cumulative<br />
departure from average precipitation at Crater Lake, <strong>Oregon</strong>… …………………… 37<br />
Figure 18. Map showing areas irrigated with ground water in <strong>the</strong> upper <strong>Klamath</strong> <strong>Basin</strong>,<br />
<strong>Oregon</strong> <strong>and</strong> California, during <strong>the</strong> 2000 water year, <strong>and</strong> areas with primary<br />
ground-water irrigation rights in <strong>Oregon</strong>… ………………………………………… 40<br />
Figure 19. Graph showing growth in total acreage with ground-water irrigation rights<br />
(primary <strong>and</strong> supplemental) in <strong>the</strong> upper <strong>Klamath</strong> <strong>Basin</strong> in <strong>Oregon</strong> through<br />
2005… ……………………………………………………………………………… 41<br />
Figure 20. Maps showing distribution <strong>of</strong> ground-water pumping for <strong>the</strong> Bureau <strong>of</strong><br />
Reclamation pilot water bank during water years 2003 <strong>and</strong> 2004, upper<br />
<strong>Klamath</strong> <strong>Basin</strong>, <strong>Oregon</strong> <strong>and</strong> California… …………………………………………… 43<br />
Figure 21. Map showing generalized water-level contours <strong>and</strong> approximate directions<br />
<strong>of</strong> regional ground-water flow in <strong>the</strong> upper <strong>Klamath</strong> <strong>Basin</strong>, <strong>Oregon</strong> <strong>and</strong><br />
California… ………………………………………………………………………… 45<br />
Figure 22. Map showing selected observation wells in <strong>the</strong> upper <strong>Klamath</strong> <strong>Basin</strong>, <strong>Oregon</strong><br />
<strong>and</strong> California… …………………………………………………………………… 49<br />
Figure 23. Graph showing water-level fluctuations in well 30S/07E-06AAA near Bear<br />
Creek nor<strong>the</strong>ast <strong>of</strong> Crater Lake, <strong>Oregon</strong>… ………………………………………… 50<br />
Figure 24. Graph showing water-level fluctuations in well 36S/14E-25BCB near Bly <strong>and</strong><br />
<strong>the</strong> cumulative departure from average precipitation at Crater Lake, <strong>Oregon</strong>… …… 51<br />
Figure 25. Graph showing water-level fluctuations in well 35S/12E-26DCD north <strong>of</strong><br />
Beatty, <strong>Oregon</strong>… …………………………………………………………………… 52<br />
Figure 26. Graph showing water-level fluctuations in well 40S/12E-32CDB northwest <strong>of</strong><br />
Malin, <strong>Oregon</strong>… …………………………………………………………………… 52<br />
Figure 27. Graph showing water-level fluctuations in well 40S/09E-28ADB on <strong>the</strong><br />
southwest side <strong>of</strong> <strong>the</strong> <strong>Klamath</strong> Hills, <strong>Oregon</strong>, <strong>and</strong> monthly discharge in <strong>the</strong><br />
nearby North Canal… ……………………………………………………………… 53<br />
Figure 28. Graph showing water-level fluctuations in shallow <strong>and</strong> deep water-bearing<br />
zones in double-completion well 39S/12E-35ABB near Lorella, <strong>Oregon</strong>… ………… 54<br />
Figure 29. Graph showing water-level fluctuations in shallow <strong>and</strong> deep water-bearing<br />
zones in double-completion well 39S/12E-35ABB near Lorella, <strong>Oregon</strong>, with<br />
time scale exp<strong>and</strong>ed to show effects <strong>of</strong> nearby ground-water pumping… ………… 54
vii<br />
Figures—Continued<br />
Figure 30. Graph showing water-level fluctuations in well 35S/06E-10ACC near Pelican<br />
Butte <strong>and</strong> stage in <strong>Upper</strong> <strong>Klamath</strong> Lake, <strong>Oregon</strong>… ………………………………… 55<br />
Figure 31. Graph showing water-level fluctuations in well 38S/09E-17CBC in <strong>the</strong> north<br />
part <strong>of</strong> <strong>Klamath</strong> Falls <strong>and</strong> stage in <strong>Upper</strong> <strong>Klamath</strong> Lake, <strong>Oregon</strong>… ………………… 55<br />
Figure 32. Graphs showing water-level fluctuations in wells 36S/14E-25BCB near Bly,<br />
39S/11E-20AAD near Bonanza, <strong>and</strong> 41S/14E-08CCA in <strong>the</strong> sou<strong>the</strong>rn Langell<br />
Valley, <strong>Oregon</strong>… …………………………………………………………………… 56<br />
Figure 33. Graphs showing water-level fluctuations in wells 36S/10E-14ACC <strong>and</strong><br />
36S/11E-20DCA in <strong>the</strong> Sprague River Valley, <strong>Oregon</strong>……………………………… 57<br />
Figure 34. Graph showing water-level fluctuations in well 46N/01E-06N01 in Butte<br />
Valley, California… ………………………………………………………………… 58<br />
Figure 35. Graphs showing water-level fluctuations in wells 40S/11E-11BAD in <strong>the</strong><br />
sou<strong>the</strong>rn Poe Valley <strong>and</strong> well 40S/12E-30DCB north <strong>of</strong> Malin, <strong>Oregon</strong>… …………… 58<br />
Figure 36. Graphs showing water-level fluctuations in wells 39S/11E-26ABD <strong>and</strong><br />
39S/12E-35ADD in <strong>the</strong> western Langell Valley, <strong>Oregon</strong>……………………………… 59<br />
Figure 37. Graph showing water-level fluctuations in well 41S/09E-12AAB at <strong>the</strong><br />
sou<strong>the</strong>rn end <strong>of</strong> <strong>the</strong> <strong>Klamath</strong> Hills, <strong>Oregon</strong>… ……………………………………… 60<br />
Figure 38. Map showing water-level decline between spring <strong>and</strong> fall 2004 in <strong>the</strong> <strong>Klamath</strong><br />
Valley <strong>and</strong> Tule Lake areas, upper <strong>Klamath</strong> <strong>Basin</strong>, <strong>Oregon</strong> <strong>and</strong> California… ……… 61<br />
Figure 39. Graph showing water-level fluctuations in well 48N/04E-35L02 near <strong>the</strong> town<br />
<strong>of</strong> Tulelake, California… …………………………………………………………… 62<br />
Figure 40. Map showing water-level decline between spring 2001 <strong>and</strong> spring 2004 in <strong>the</strong><br />
<strong>Klamath</strong> Valley <strong>and</strong> Tule Lake areas, <strong>Oregon</strong> <strong>and</strong> California………………………… 63<br />
Tables<br />
Table 1. Generalized hydrogeologic units in <strong>the</strong> upper <strong>Klamath</strong> <strong>Basin</strong>, <strong>Oregon</strong> <strong>and</strong><br />
California… ………………………………………………………………………… 12<br />
Table 2. Summary <strong>of</strong> selected aquifer tests, upper <strong>Klamath</strong> <strong>Basin</strong>, <strong>Oregon</strong> <strong>and</strong> California 14<br />
Table 3. Estimates <strong>of</strong> major hydrologic budget elements <strong>of</strong> <strong>the</strong> upper <strong>Klamath</strong> <strong>Basin</strong>,<br />
<strong>Oregon</strong> <strong>and</strong> California… …………………………………………………………… 19<br />
Table 4. Estimated ground-water pumping for irrigation in <strong>the</strong> upper <strong>Klamath</strong> <strong>Basin</strong>,<br />
<strong>Oregon</strong> <strong>and</strong> California, during water year 2000……………………………………… 39<br />
Table 5. <strong>Ground</strong>-water pumping for <strong>the</strong> Bureau <strong>of</strong> Reclamation pilot water bank <strong>and</strong><br />
ground-water acquisition program, upper <strong>Klamath</strong> <strong>Basin</strong>, <strong>Oregon</strong> <strong>and</strong> California 42<br />
Table 6. Estimated ground-water discharge to principal stream reaches in <strong>the</strong> upper<br />
<strong>Klamath</strong> <strong>Basin</strong>, <strong>Oregon</strong> <strong>and</strong> California… …………………………………………… 72
viii<br />
Conversion Factors <strong>and</strong> Datums<br />
Conversion Factors<br />
Multiply By To obtain<br />
acre 0.004047 square kilometer (km 2 )<br />
acre-foot (acre-ft) 1,233 cubic meter (m 3 )<br />
acre-foot per year (acre-ft/yr) 1,233 cubic meter per year (m 3 /yr)<br />
cubic foot (ft 3 ) 0.02832 cubic meter (m 3 )<br />
cubic foot per second (ft 3 /s) 0.02832 cubic meter per second (m 3 /s)<br />
cubic foot per second per mile<br />
[(ft 3 /s)/mi]<br />
0.0176 cubic meter per second per kilometer<br />
[(m 3 /s)/km]<br />
foot (ft) 0.3048 meter (m)<br />
foot per day (ft/d) 0.3048 meter per day (m/d)<br />
foot per mile (ft/mi) 0.1894 meter per kilometer (m/km)<br />
foot squared per day (ft 2 /d) 0.09290 meter squared per day (m 2 /d)<br />
gallon (gal) 3.785 liter (L)<br />
gallon per day per foot [(gal/d)/ft] 0.01242 cubic meter per day per meter<br />
[(m 3 /d)/m]<br />
gallon per minute (gal/min) 0.06309 liter per second (L/s)<br />
inch (in.) 2.54 centimeter (cm)<br />
inch per year (in/yr) 25.4 millimeter per year (mm/yr)<br />
mile (mi) 1.609 kilometer (km)<br />
million gallons (Mgal) 3,785 cubic meter (m 3 )<br />
million gallons per day (Mgal/d) 0.04381 cubic meter per second (m 3 /s)<br />
square foot (ft 2 ) 0.09290 square meter (m 2 )<br />
square mile (mi 2 ) 2.590 square kilometer (km 2 )<br />
Temperature in degrees Fahrenheit (°F) may be converted to degrees Celsius (°C) as follows:<br />
Datums<br />
°C = (°F-32)/1.8.<br />
Horizontal coordinate information is referenced to <strong>the</strong> North American Datum <strong>of</strong> 1927 (NAD 27).<br />
Vertical coordinate information is referenced to <strong>the</strong> National Geodetic Vertical Datum <strong>of</strong> 1929<br />
(NGVD 29). In this report, “altitude” refers to <strong>the</strong> distance above <strong>the</strong> vertical datum.<br />
*Transmissivity: The st<strong>and</strong>ard unit for transmissivity is cubic foot per day per square foot times<br />
foot <strong>of</strong> aquifer thickness [(ft 3 /d)/ft 2 ]ft. In this report, <strong>the</strong> ma<strong>the</strong>matically reduced form, foot<br />
squared per day (ft 2 /d), is used for convenience.
ix<br />
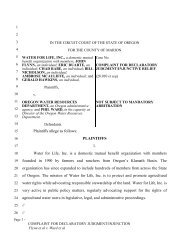
Location System<br />
The system used for locating wells <strong>and</strong> springs in this report is based on <strong>the</strong> rectangular system<br />
for subdivision <strong>of</strong> public l<strong>and</strong>. The States <strong>of</strong> <strong>Oregon</strong> <strong>and</strong> California are divided into 36 squaremile<br />
townships numbered according to <strong>the</strong>ir location relative to an east-west baseline <strong>and</strong> a<br />
north-south meridian. In <strong>Oregon</strong>, <strong>the</strong> Willamette base line <strong>and</strong> meridian are used, <strong>and</strong> in California,<br />
<strong>the</strong> Mount Diablo baseline <strong>and</strong> meridian are used. The position <strong>of</strong> a township is given by<br />
its north-south “Township” position relative to <strong>the</strong> baseline <strong>and</strong> its east-west “Range” position<br />
relative to <strong>the</strong> meridian. Each township is divided into 36 sections approximately 1 square mile<br />
(640-acre) in area <strong>and</strong> numbered from 1 to 36. For example, a well designated as 36S/11E-<br />
20DCA is located in Township 36 south, Range 11 east, section 20. The three letters following<br />
<strong>the</strong> section number (A,B,C, or D) correspond to <strong>the</strong> location within <strong>the</strong> section; <strong>the</strong> first<br />
letter identifies <strong>the</strong> quarter section (160 acres), <strong>the</strong> second letter identifies <strong>the</strong> quarter-quarter<br />
section (40 acres), <strong>and</strong> <strong>the</strong> third letter identifies <strong>the</strong> quarter-quarter-quarter section (10 acres).<br />
Thus, well 20DCA is located in <strong>the</strong> NE quarter <strong>of</strong> <strong>the</strong> SW quarter <strong>of</strong> <strong>the</strong> SE quarter <strong>of</strong> section<br />
20. When more than one designated well occurs in <strong>the</strong> quarter-quarter-quarter section, a serial<br />
number is appended. For some wells that were field located during previous studies or by <strong>the</strong><br />
California Department <strong>of</strong> <strong>Water</strong> Resources, a different system <strong>of</strong> letters following <strong>the</strong> section<br />
number was used for <strong>the</strong> location within <strong>the</strong> section. This system assigns a letter to one <strong>of</strong> 16<br />
quarter-quarter sections (40 acres) that divide <strong>the</strong> section. The location 20DCA corresponds to<br />
<strong>the</strong> location 20Q. When more than one designated well occurs in <strong>the</strong> quarter-quarter section, a<br />
serial number is appended.<br />
R. 8 E. R. 10 E. R. 12 E. R. 14 E.<br />
T. 34 S.<br />
T. 36 S.<br />
6<br />
5<br />
4<br />
3<br />
2<br />
1<br />
7 8 9 10 11 12<br />
18<br />
17<br />
16<br />
15<br />
14<br />
13<br />
19 20 21 22 23<br />
24<br />
30<br />
29<br />
28<br />
27<br />
26<br />
25<br />
31 32 33 34 35 36<br />
B<br />
20<br />
A<br />
D<br />
E<br />
C<br />
F<br />
B<br />
G<br />
20<br />
A<br />
H<br />
C<br />
B<br />
D<br />
B A<br />
C<br />
C D<br />
A<br />
D<br />
M<br />
N<br />
L<br />
P<br />
K<br />
Q<br />
J<br />
R<br />
36S/11E-20DCA<br />
36S/11E-20Q
Mapping Sources<br />
Base modified from U.S. Geological Survey 1:100,000 <strong>and</strong> 1:24,000 scale quadrangle maps.<br />
Relief from U.S. Geological Survey National Elevation Data Set 30 meter digital elevation<br />
model. <strong>Klamath</strong> Reclamation Project boundaries are from Bureau <strong>of</strong> Reclamation, <strong>Klamath</strong><br />
<strong>Basin</strong> Area Office GIS data.<br />
Vertical datum: National Geodetic Vertical Datum <strong>of</strong> 1929 (NGVD29)<br />
Projection: Universal Transverse Mercator, Zone 10, 1927 North American Datum<br />
<strong>Ground</strong>-<strong>Water</strong> <strong>Hydrology</strong> <strong>of</strong> <strong>the</strong> <strong>Upper</strong> <strong>Klamath</strong> <strong>Basin</strong>, <strong>Oregon</strong> <strong>and</strong> California
<strong>Ground</strong>-<strong>Water</strong> <strong>Hydrology</strong> <strong>of</strong> <strong>the</strong> <strong>Upper</strong> <strong>Klamath</strong> <strong>Basin</strong>,<br />
<strong>Oregon</strong> <strong>and</strong> California<br />
By Marshall W. Gannett, Kenneth E. Lite Jr., Jonathan L. La Marche, Bruce J. Fisher, <strong>and</strong> Danial J.<br />
Polette<br />
Abstract<br />
The upper <strong>Klamath</strong> <strong>Basin</strong> spans <strong>the</strong> California-<strong>Oregon</strong><br />
border from <strong>the</strong> flank <strong>of</strong> <strong>the</strong> Cascade Range eastward to <strong>the</strong><br />
<strong>Basin</strong> <strong>and</strong> Range Province, <strong>and</strong> encompasses <strong>the</strong> <strong>Klamath</strong><br />
River drainage basin above Iron Gate Dam. Most <strong>of</strong> <strong>the</strong> basin<br />
is semiarid, but <strong>the</strong> Cascade Range <strong>and</strong> upl<strong>and</strong>s in <strong>the</strong> interior<br />
<strong>and</strong> eastern parts <strong>of</strong> <strong>the</strong> basin receive on average more than<br />
30 inches <strong>of</strong> precipitation per year. The basin has several<br />
perennial streams with mean annual discharges <strong>of</strong> hundreds<br />
<strong>of</strong> cubic feet per second, <strong>and</strong> <strong>the</strong> <strong>Klamath</strong> River at Iron Gate<br />
Dam, which represents drainage from <strong>the</strong> entire upper basin,<br />
has a mean annual discharge <strong>of</strong> about 2,100 cubic feet per<br />
second. The basin once contained three large lakes: <strong>Upper</strong> <strong>and</strong><br />
Lower <strong>Klamath</strong> Lakes <strong>and</strong> Tule Lake, each <strong>of</strong> which covered<br />
areas <strong>of</strong> 100 to 150 square miles, including extensive marginal<br />
wetl<strong>and</strong>s. Lower <strong>Klamath</strong> Lake <strong>and</strong> Tule Lake have been<br />
mostly drained, <strong>and</strong> <strong>the</strong> former lake beds are now cultivated.<br />
<strong>Upper</strong> <strong>Klamath</strong> Lake remains, <strong>and</strong> is an important source<br />
<strong>of</strong> irrigation water. Much <strong>of</strong> <strong>the</strong> wetl<strong>and</strong> surrounding <strong>Upper</strong><br />
<strong>Klamath</strong> Lake has been diked <strong>and</strong> drained, although efforts<br />
are underway to restore large areas. <strong>Upper</strong> <strong>Klamath</strong> Lake <strong>and</strong><br />
<strong>the</strong> remaining parts <strong>of</strong> Lower <strong>Klamath</strong> <strong>and</strong> Tule Lakes provide<br />
important wildlife habitat, <strong>and</strong> parts <strong>of</strong> each are included in <strong>the</strong><br />
<strong>Klamath</strong> <strong>Basin</strong> National Wildlife Refuges Complex.<br />
The upper <strong>Klamath</strong> <strong>Basin</strong> has a substantial regional<br />
ground-water flow system. The late Tertiary to Quaternary<br />
volcanic rocks that underlie <strong>the</strong> region are generally<br />
permeable, with transmissivity estimates ranging from 1,000<br />
to 100,000 feet squared per day, <strong>and</strong> compose a system <strong>of</strong><br />
variously interconnected aquifers. Interbedded with <strong>the</strong><br />
volcanic rocks are late Tertiary sedimentary rocks composed<br />
primarily <strong>of</strong> fine-grained lake sediments <strong>and</strong> basin-filling<br />
deposits. These sedimentary deposits have generally low<br />
permeability, are not good aquifers, <strong>and</strong> probably restrict<br />
ground-water movement in some areas. The regional groundwater<br />
system is underlain <strong>and</strong> bounded on <strong>the</strong> east <strong>and</strong> west<br />
by older Tertiary volcanic <strong>and</strong> sedimentary rocks that have<br />
generally low permeability. Eight regional-scale hydrogeologic<br />
units are defined in <strong>the</strong> upper <strong>Klamath</strong> <strong>Basin</strong> on <strong>the</strong> basis <strong>of</strong><br />
surficial geology <strong>and</strong> subsurface data.<br />
<strong>Ground</strong> water flows from recharge areas in <strong>the</strong> Cascade<br />
Range <strong>and</strong> upl<strong>and</strong> areas in <strong>the</strong> basin interior <strong>and</strong> eastern<br />
margins toward stream valleys <strong>and</strong> interior subbasins. <strong>Ground</strong><br />
water discharges to streams throughout <strong>the</strong> basin, <strong>and</strong> most<br />
streams have some component <strong>of</strong> ground water (baseflow).<br />
Some streams, however, are predominantly ground-water<br />
fed <strong>and</strong> have relatively constant flows throughout <strong>the</strong> year.<br />
Large amounts <strong>of</strong> ground water discharge in <strong>the</strong> Wood River<br />
subbasin, <strong>the</strong> lower Williamson River area, <strong>and</strong> along <strong>the</strong><br />
margin <strong>of</strong> <strong>the</strong> Cascade Range. Much <strong>of</strong> <strong>the</strong> inflow to <strong>Upper</strong><br />
<strong>Klamath</strong> Lake can be attributed to ground-water discharge<br />
to streams <strong>and</strong> major spring complexes within a dozen or so<br />
miles from <strong>the</strong> lake. This large component <strong>of</strong> ground water<br />
buffers <strong>the</strong> lake somewhat from climate cycles. There are<br />
also ground-water discharge areas in <strong>the</strong> eastern parts <strong>of</strong> <strong>the</strong><br />
basin, for example in <strong>the</strong> upper Williamson <strong>and</strong> Sprague River<br />
subbasins <strong>and</strong> in <strong>the</strong> Lost River subbasin at Bonanza Springs.<br />
Irrigated agriculture is an integral part <strong>of</strong> <strong>the</strong> economy <strong>of</strong><br />
<strong>the</strong> upper <strong>Klamath</strong> <strong>Basin</strong>. Although estimates vary somewhat,<br />
roughly 500,000 acres are irrigated in <strong>the</strong> upper <strong>Klamath</strong><br />
<strong>Basin</strong>, about 190,000 acres <strong>of</strong> which are part <strong>of</strong> <strong>the</strong> Bureau <strong>of</strong><br />
Reclamation <strong>Klamath</strong> Project. Most <strong>of</strong> this l<strong>and</strong> is irrigated<br />
with surface water. <strong>Ground</strong> water has been used for many<br />
decades to irrigate areas where surface water is not available,<br />
for example outside <strong>of</strong> irrigation districts <strong>and</strong> stream valleys.<br />
<strong>Ground</strong> water has also been used as a supplemental source<br />
<strong>of</strong> water in areas where surface water supplies are limited<br />
<strong>and</strong> during droughts. <strong>Ground</strong> water use for irrigation has<br />
increased in recent years due to drought <strong>and</strong> shifts in surfacewater<br />
allocation from irrigation to instream uses. The shifts in<br />
surface-water allocation have resulted from efforts to improve<br />
habitat for fish listed under <strong>the</strong> Federal Endangered Species<br />
Act.<br />
The ground-water system in <strong>the</strong> upper <strong>Klamath</strong> <strong>Basin</strong><br />
responds to external stresses such as climate cycles, pumping,<br />
lake stage variations, <strong>and</strong> canal operation. This response is<br />
manifest as fluctuations in hydraulic head (as represented<br />
by fluctuations in <strong>the</strong> water-table surface) <strong>and</strong> variations in<br />
ground-water discharge to springs. <strong>Basin</strong>wide, decadal-scale<br />
climate cycles are <strong>the</strong> largest factor controlling head <strong>and</strong><br />
discharge fluctuations. Climate-driven water-table fluctuations<br />
<strong>of</strong> more than 12 feet have been observed near <strong>the</strong> Cascade
<strong>Ground</strong>-<strong>Water</strong> <strong>Hydrology</strong> <strong>of</strong> <strong>the</strong> <strong>Upper</strong> <strong>Klamath</strong> <strong>Basin</strong>, <strong>Oregon</strong> <strong>and</strong> California<br />
Range, <strong>and</strong> decadal-scale fluctuations <strong>of</strong> 5 feet are common<br />
throughout <strong>the</strong> basin. <strong>Ground</strong>-water discharge to springs <strong>and</strong><br />
streams varies basinwide in response to decadal-scale climate<br />
cycles.<br />
The response <strong>of</strong> <strong>the</strong> ground-water system to pumping<br />
is generally largest in areas where pumping occurs. Annual<br />
drawdown <strong>and</strong> recovery cycles <strong>of</strong> 1 to 10 feet are common<br />
in pumping areas. Long-term drawdown effects, where <strong>the</strong><br />
water table has reached or is attempting to reach a new level<br />
in equilibrium with <strong>the</strong> pumping, are apparent in parts <strong>of</strong> <strong>the</strong><br />
basin.<br />
Since 2001, ground-water use in <strong>the</strong> upper <strong>Klamath</strong> <strong>Basin</strong><br />
has increased by about 50 percent. Much <strong>of</strong> this increase has<br />
occurred in <strong>the</strong> area in <strong>and</strong> around <strong>the</strong> Bureau <strong>of</strong> Reclamation<br />
<strong>Klamath</strong> Project, roughly tripling ground-water pumping in<br />
that area. This focused increase in pumping has resulted in<br />
ground-water level declines in <strong>the</strong> pumped aquifer in excess<br />
<strong>of</strong> 10 to 15 feet over a large part <strong>of</strong> <strong>the</strong> Project between 2001<br />
<strong>and</strong> 2004. If pumping rates <strong>of</strong> recent years are continued,<br />
<strong>the</strong> aquifer could achieve a new equilibrium; however, <strong>the</strong><br />
final configuration <strong>of</strong> <strong>the</strong> water table (depth to water) <strong>and</strong> <strong>the</strong><br />
spatial <strong>and</strong> temporal distribution <strong>of</strong> <strong>the</strong> resulting effects to<br />
streams are unknown. Historical water-level data suggest that<br />
<strong>the</strong> water table should recover from recent declines if pumping<br />
is reduced to pre-2001 rates.<br />
Introduction<br />
The upper <strong>Klamath</strong> <strong>Basin</strong> spans <strong>the</strong> <strong>Oregon</strong>-California<br />
border from <strong>the</strong> flank <strong>of</strong> <strong>the</strong> Cascade Range eastward to <strong>the</strong><br />
high desert. Although much <strong>of</strong> <strong>the</strong> basin is high desert, <strong>the</strong><br />
region receives considerable run<strong>of</strong>f from <strong>the</strong> Cascade Range<br />
<strong>and</strong> upl<strong>and</strong>s to <strong>the</strong> east. As a result, <strong>the</strong> area has numerous<br />
perennial streams, large shallow lakes, <strong>and</strong> extensive wetl<strong>and</strong>s,<br />
<strong>and</strong> <strong>the</strong> <strong>Klamath</strong> River has historically supported anadromous<br />
fish runs. <strong>Water</strong> in <strong>the</strong> basin is used for agricultural<br />
irrigation, for extensive waterfowl refuges, <strong>and</strong> to support<br />
aquatic wildlife in lakes <strong>and</strong> streams in <strong>the</strong> upper basin <strong>and</strong><br />
downstream.<br />
The agricultural economy <strong>of</strong> <strong>the</strong> upper <strong>Klamath</strong> <strong>Basin</strong><br />
relies on irrigation water. Just over 500,000 acres are irrigated<br />
in <strong>the</strong> upper <strong>Klamath</strong> <strong>Basin</strong>, about 190,000 acres <strong>of</strong> which<br />
are within <strong>the</strong> <strong>Klamath</strong> Project developed <strong>and</strong> operated by <strong>the</strong><br />
Bureau <strong>of</strong> Reclamation (Reclamation) (Burt <strong>and</strong> Freeman,<br />
2003; Natural Resources Conservation Service, 2004). The<br />
principal source <strong>of</strong> water for <strong>the</strong> Bureau <strong>of</strong> Reclamation<br />
<strong>Klamath</strong> Project is <strong>Upper</strong> <strong>Klamath</strong> Lake. In recent years,<br />
Endangered Species Act biological opinions have required<br />
Reclamation to maintain certain lake levels in <strong>Upper</strong> <strong>Klamath</strong><br />
Lake to protect habitat for endangered fish (specifically<br />
<strong>the</strong> Lost River <strong>and</strong> shortnose suckers) <strong>and</strong> at <strong>the</strong> same time<br />
maintain specified flows in <strong>the</strong> <strong>Klamath</strong> River below <strong>the</strong> lake<br />
<strong>and</strong> project diversions to provide habitat for listed salmon.<br />
This shift in water management has resulted in increased<br />
dem<strong>and</strong>s for water. Owing to <strong>the</strong> limitations <strong>of</strong> o<strong>the</strong>r options,<br />
<strong>the</strong> increased dem<strong>and</strong> has resulted in increased use <strong>of</strong> ground<br />
water in <strong>the</strong> basin. The problems associated with increased<br />
dem<strong>and</strong>s are exacerbated by drought.<br />
The upper <strong>Klamath</strong> <strong>Basin</strong> has a substantial regional<br />
ground-water system, <strong>and</strong> ground water traditionally has<br />
been used for irrigation for many decades in certain areas.<br />
The changes in water management described above coupled<br />
with a series <strong>of</strong> dryer than average years have resulted in an<br />
approximately 50 percent increase in ground-water pumping<br />
in <strong>the</strong> basin since 2001. Most <strong>of</strong> this increase is focused in <strong>the</strong><br />
area <strong>of</strong> <strong>the</strong> <strong>Klamath</strong> Project. Increased pumping has caused<br />
local water-level declines that have been problematic for some<br />
ground-water users <strong>and</strong> generated concern among resource<br />
management agencies <strong>and</strong> <strong>the</strong> community. In addition to <strong>the</strong><br />
measured effects, <strong>the</strong> basic principles <strong>of</strong> hydrology require that<br />
<strong>the</strong> volume <strong>of</strong> ground-water pumped <strong>and</strong> used consumptively<br />
must be <strong>of</strong>fset by changes in flow to or from o<strong>the</strong>r boundaries<br />
including streams.<br />
The effects <strong>of</strong> large-scale ground-water pumping can<br />
spread beyond <strong>the</strong> pumping centers to o<strong>the</strong>r parts <strong>of</strong> <strong>the</strong><br />
regional ground-water system. Prior to this study, <strong>the</strong> groundwater<br />
hydrology had been studied only in separate parts <strong>of</strong> <strong>the</strong><br />
basin, with many areas left undescribed. Therefore, <strong>the</strong>re was<br />
no basic framework with which to underst<strong>and</strong> <strong>the</strong> potential<br />
regional effects <strong>of</strong> ground-water development in <strong>the</strong> basin<br />
<strong>and</strong> <strong>the</strong> broad ramifications <strong>of</strong> water-management decisions.<br />
In 1999, <strong>the</strong> U.S. Geological Survey (USGS) <strong>and</strong> <strong>the</strong> <strong>Oregon</strong><br />
<strong>Water</strong> Resources Department (OWRD) began a cooperative<br />
study to (1) quantitatively characterize <strong>the</strong> regional groundwater<br />
flow system in <strong>the</strong> upper <strong>Klamath</strong> <strong>Basin</strong> <strong>and</strong> (2) develop<br />
a computer model to simulate regional ground-water flow<br />
that can be used to help underst<strong>and</strong> <strong>the</strong> resource <strong>and</strong> test<br />
management scenarios. This report summarizes efforts to<br />
quantitatively characterize <strong>the</strong> ground-water hydrology.<br />
Study Area<br />
The upper <strong>Klamath</strong> <strong>Basin</strong> (fig. 1) comprises <strong>the</strong><br />
entire drainage basin above Iron Gate Dam, including <strong>the</strong><br />
internally drained Lost River <strong>and</strong> Butte Creek subbasins,<br />
<strong>and</strong> encompasses about 8,000 mi 2 (square miles). Studyarea<br />
boundaries were defined to correspond to hydrologic<br />
boundaries across which ground-water flow can be estimated<br />
or assumed negligible. The southwestern boundary near<br />
Iron Gate Dam was selected because it corresponds with <strong>the</strong><br />
transition from a geologic terrane dominated by permeable<br />
volcanic rock to a terrane dominated by older rock with much<br />
lower permeability. It is not likely that significant regional<br />
ground-water flow crosses this geologic boundary. The<br />
boundary between <strong>the</strong> regional flow systems in <strong>the</strong> upper<br />
<strong>Klamath</strong> <strong>Basin</strong> <strong>and</strong> <strong>the</strong> Deschutes <strong>and</strong> Fort Rock <strong>Basin</strong>s to<br />
<strong>the</strong> north (not shown on fig. 1) is defined by a surface-water<br />
divide that roughly corresponds to <strong>the</strong> ground-water divide.
Creek<br />
Introduction<br />
<br />
43°15'<br />
43°00'<br />
45'<br />
30'<br />
15'<br />
42°00'<br />
45'<br />
122°30' 15'<br />
D O U G L A S<br />
Camp Cr<br />
Scotch Cr<br />
Dry Cr<br />
138<br />
62<br />
Butte<br />
Falls<br />
66<br />
Prospect<br />
J A C K S O N<br />
Mt<br />
McLoughlin<br />
Mill Cr<br />
Jenny<br />
Cr<br />
Little<br />
Fall<br />
Cr<br />
<strong>Klamath</strong><br />
Iron<br />
Gate<br />
Res<br />
Bogus<br />
Cr<br />
Shasta<br />
Annie<br />
Spring<br />
Pinehurst<br />
Diamond<br />
Lake<br />
Copco<br />
Lake<br />
230<br />
R A N G E<br />
Crater<br />
Lake<br />
C A S C A D E<br />
Spencer<br />
Edge Cr<br />
Shovel<br />
River<br />
Cr<br />
Crater<br />
Lake<br />
Annie<br />
Creek<br />
Mares<br />
Egg<br />
Spring<br />
Cherry<br />
Creek<br />
Pelican<br />
Butte<br />
Rocky<br />
Point<br />
Fourmile<br />
Cr<br />
Crane<br />
Lake<br />
<strong>of</strong> <strong>the</strong><br />
Woods<br />
Creek<br />
Sevenmile<br />
122°00'<br />
Scott<br />
Creek<br />
S<strong>and</strong><br />
Creek<br />
Sun<br />
Creek<br />
Cr<br />
Fourmile<br />
Creek<br />
Rock<br />
Creek<br />
River<br />
Creek<br />
Aspen<br />
Lake<br />
John C. Boyle<br />
Reservoir<br />
Mount<br />
Thielsen<br />
Wood<br />
River<br />
<strong>Upper</strong><br />
Spring<br />
Creek<br />
Agency<br />
Lake<br />
Keno<br />
Dam<br />
<strong>Klamath</strong><br />
Strait<br />
John C. Boyle<br />
Power Plant<br />
Larkin<br />
Creek<br />
<strong>Klamath</strong><br />
Lake<br />
Big<br />
Springs<br />
Creek<br />
45'<br />
Lower<br />
<strong>Klamath</strong><br />
Lake<br />
S I S K I Y O U<br />
Jack<br />
30'<br />
K L A M AT H<br />
Sprague<br />
Trout Cr<br />
Creek<br />
Fort<br />
<strong>Klamath</strong><br />
Kirk<br />
Solomon<br />
Butte<br />
<strong>Klamath</strong><br />
Agency<br />
Whitehorse<br />
Spring<br />
McReady<br />
62 Chiloquin Spring<br />
Narrows<br />
Chiloquin Kamkaun<br />
Spring<br />
140<br />
Keno<br />
Dorris<br />
Miller<br />
Creek<br />
Sink<br />
Creek<br />
138<br />
Butte<br />
Valley<br />
Macdoel<br />
Lenz<br />
Modoc<br />
Point<br />
66<br />
97<br />
<strong>Klamath</strong> Valley<br />
<strong>Klamath</strong> Hills<br />
North Canal<br />
Chemult<br />
Silver<br />
<strong>Klamath</strong><br />
Red Rock Valley<br />
Marsh<br />
Lake<br />
Wildhorse<br />
Ridge<br />
Olene<br />
Lost River<br />
Diversion<br />
Channel<br />
Merrill<br />
Yonna Valley<br />
Lost<br />
River<br />
Sheepy Ridge<br />
Williamson<br />
Buck<br />
Cr<br />
Tule<br />
Lake<br />
Sump<br />
Sheep<br />
Creek<br />
River<br />
Taylor<br />
Butte<br />
Rocky<br />
Ford<br />
Knot Tablel<strong>and</strong><br />
Sprague<br />
River<br />
Swan Lake Valley<br />
Dairy<br />
<strong>Klamath</strong> Falls<br />
Lake Ewauna The<br />
Gap<br />
Poe Valley<br />
Stukel<br />
Mountain<br />
River<br />
Lost<br />
Road<br />
Jackson<br />
Creek<br />
Wickiup<br />
Spring<br />
Whisky<br />
Creek<br />
Bly<br />
Mt<br />
70<br />
Malin<br />
River<br />
Tulelake<br />
Long<br />
Sycan<br />
Brown<br />
Spring<br />
15'<br />
Yamsay<br />
Mountain<br />
Torrent<br />
Spring<br />
Bonanza<br />
Area shown in figures 3, 20, 38, <strong>and</strong> 40<br />
Study<br />
Spodue<br />
Mountain<br />
Bryant Mountain<br />
Creek<br />
River<br />
Brown<br />
Creek<br />
Yainax<br />
Butte<br />
Lorella<br />
Fivemile<br />
Miller Cr<br />
Langell<br />
Valley<br />
Clear<br />
Lake<br />
Res<br />
Silver<br />
Lake<br />
area<br />
Sycan<br />
Marsh<br />
Creek<br />
Meryl<br />
Bly Ridge<br />
121°00'<br />
Fork<br />
N<br />
Beatty<br />
Beatty<br />
Gap<br />
Bly<br />
<strong>Upper</strong><br />
<strong>Klamath</strong><br />
<strong>Basin</strong><br />
L A K E<br />
Creek<br />
Fritz<br />
Creek<br />
S Fork<br />
Gerber<br />
Reservoir<br />
Willow<br />
Boles<br />
31<br />
M O D O C<br />
River<br />
Sprague<br />
Summer<br />
Lake<br />
boundary<br />
Deming<br />
Creek<br />
Creek<br />
Cr<br />
OREGON<br />
Winter Ridge<br />
River<br />
Sprague<br />
CALIFORNIA<br />
120°<br />
45'<br />
Summer Lake<br />
Barns Rim<br />
Modoc Plateau<br />
Gearhart<br />
Mountain<br />
Brownsworth<br />
Creek<br />
140<br />
Coleman Rim<br />
OREGON<br />
CALIFORNIA<br />
41°30'<br />
Shasta River<br />
5<br />
Whitney<br />
Creek<br />
97<br />
Butte<br />
Medicine<br />
139<br />
Lake<br />
Volcano<br />
Scale 1:1,000,000<br />
5 0 5 10 15 20 MILES<br />
5 0 5 10 15 20 KILOMETERS<br />
299<br />
Pit<br />
River<br />
See table <strong>of</strong> contents for mapping sources<br />
Figure 1.<br />
The upper <strong>Klamath</strong> <strong>Basin</strong>, <strong>Oregon</strong> <strong>and</strong> California, <strong>and</strong> major geographic features.<br />
OR19-0048_fig01
<strong>Ground</strong>-<strong>Water</strong> <strong>Hydrology</strong> <strong>of</strong> <strong>the</strong> <strong>Upper</strong> <strong>Klamath</strong> <strong>Basin</strong>, <strong>Oregon</strong> <strong>and</strong> California<br />
This boundary is likely permeable. The boundary between <strong>the</strong><br />
ground-water system <strong>of</strong> <strong>the</strong> upper <strong>Klamath</strong> <strong>Basin</strong> <strong>and</strong> that <strong>of</strong><br />
<strong>the</strong> Pit River <strong>Basin</strong> to <strong>the</strong> south also is defined by a surfacewater<br />
divide in most places. The sou<strong>the</strong>rn surface-water divide<br />
does not correspond to a ground-water divide in all places, as<br />
hydraulic head data indicate that <strong>the</strong>re is southward flow <strong>of</strong><br />
ground water from <strong>the</strong> upper <strong>Klamath</strong> <strong>Basin</strong> south <strong>of</strong> <strong>the</strong> Tule<br />
Lake subbasin toward <strong>the</strong> Pit River <strong>Basin</strong>. The eastern studyarea<br />
boundary corresponds to a surface-water divide <strong>and</strong> is<br />
characterized in many places by a transition to older geologic<br />
strata.<br />
The upper <strong>Klamath</strong> <strong>Basin</strong> occupies a broad, faulted,<br />
volcanic plateau that spans <strong>the</strong> boundary between <strong>the</strong> Cascade<br />
Range <strong>and</strong> <strong>Basin</strong> <strong>and</strong> Range geologic provinces. The basin<br />
is bounded by <strong>the</strong> volcanic arc <strong>of</strong> <strong>the</strong> Cascade Range on <strong>the</strong><br />
west, <strong>the</strong> Deschutes <strong>Basin</strong> to <strong>the</strong> north, <strong>the</strong> internally drained<br />
Silver Lake, Summer Lake, <strong>and</strong> Goose Lake <strong>Basin</strong>s to <strong>the</strong><br />
east, <strong>and</strong> <strong>the</strong> Pit River <strong>Basin</strong> to <strong>the</strong> south. The altitude <strong>of</strong> <strong>the</strong><br />
Cascade Range along <strong>the</strong> western margin ranges from 5,000<br />
to 7,000 ft (feet) with major peaks such as Mount McLoughlin<br />
<strong>and</strong> Mount Thielsen exceeding 9,000 ft. The interior parts <strong>of</strong><br />
<strong>the</strong> basin are dominated by northwest-trending fault-bounded<br />
basins, typically several miles wide, with intervening upl<strong>and</strong>s.<br />
<strong>Basin</strong> floors range in altitude from roughly 4,000 to 4,500 ft,<br />
<strong>and</strong> adjoining fault-block upl<strong>and</strong> altitudes range from 4,500 to<br />
more than 5,000 ft. The nor<strong>the</strong>rn <strong>and</strong> eastern parts <strong>of</strong> <strong>the</strong> upper<br />
<strong>Klamath</strong> <strong>Basin</strong> consist <strong>of</strong> a volcanic upl<strong>and</strong> with numerous<br />
eruptive centers, including Yamsay <strong>and</strong> Gearhart Mountains,<br />
both <strong>of</strong> which exceed 8,000 ft. The sou<strong>the</strong>astern margin <strong>of</strong><br />
<strong>the</strong> upper <strong>Klamath</strong> <strong>Basin</strong> consists <strong>of</strong> a broad, rugged, volcanic<br />
upl<strong>and</strong> known as <strong>the</strong> Modoc Plateau, where most <strong>of</strong> <strong>the</strong> l<strong>and</strong><br />
surface ranges from 4,500 to 5,000 ft. The sou<strong>the</strong>rn margin<br />
<strong>of</strong> <strong>the</strong> basin is marked by <strong>the</strong> broad shield <strong>of</strong> Medicine Lake<br />
Volcano, which reaches an altitude <strong>of</strong> 7,913 ft.<br />
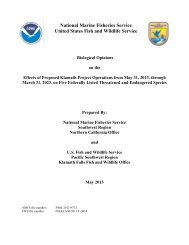
The upper <strong>Klamath</strong> <strong>Basin</strong> is semiarid because <strong>the</strong><br />
Cascade Range intercepts much <strong>of</strong> <strong>the</strong> moisture from <strong>the</strong><br />
predominantly eastward moving Pacific wea<strong>the</strong>r systems.<br />
Mean annual precipitation (1961–90) ranges from 65.4 inches<br />
at Crater Lake National Park in <strong>the</strong> Cascade Range to 13.5<br />
inches at <strong>Klamath</strong> Falls (fig. 2). Most precipitation occurs in<br />
<strong>the</strong> fall <strong>and</strong> winter. November through March precipitation<br />
accounts for 71 percent <strong>of</strong> <strong>the</strong> total at Crater Lake <strong>and</strong> 64<br />
percent <strong>of</strong> <strong>the</strong> total at <strong>Klamath</strong> Falls. Most precipitation falls<br />
as snow at higher elevations. The interior parts <strong>of</strong> <strong>the</strong> basin<br />
are very dry during <strong>the</strong> spring <strong>and</strong> summer; mean monthly<br />
precipitation at <strong>Klamath</strong> Falls is less than 1 inch from April<br />
through October. Winters are generally cold, with January<br />
mean minimum <strong>and</strong> maximum temperatures <strong>of</strong> 20.3°F <strong>and</strong><br />
38.8°F, respectively, at <strong>Klamath</strong> Falls <strong>and</strong> 17.5°F <strong>and</strong> 34.5°F,<br />
respectively, at Crater Lake. Summers, in contrast, are warm,<br />
with July mean minimum <strong>and</strong> maximum temperatures <strong>of</strong><br />
50.8°F <strong>and</strong> 84.6°F, respectively, at <strong>Klamath</strong> Falls <strong>and</strong> 39.8°F<br />
<strong>and</strong> 68.0°F, respectively, at Crater Lake.<br />
Principal streams in <strong>the</strong> upper <strong>Klamath</strong> <strong>Basin</strong> include <strong>the</strong><br />
Williamson River, which drains <strong>the</strong> nor<strong>the</strong>rn <strong>and</strong> eastern parts<br />
<strong>of</strong> <strong>the</strong> basin; <strong>the</strong> Sprague River (a tributary to <strong>the</strong> Williamson)<br />
which drains part <strong>of</strong> <strong>the</strong> eastern side <strong>of</strong> <strong>the</strong> basin; <strong>the</strong> Lost<br />
River, which drains <strong>the</strong> sou<strong>the</strong>astern part <strong>of</strong> <strong>the</strong> basin; <strong>and</strong> <strong>the</strong><br />
<strong>Klamath</strong> River (fig. 1). The Lost River subbasin is actually a<br />
closed stream basin. Prior to development, <strong>the</strong> river flowed to<br />
internally drained Tule Lake, although it occasionally received<br />
flow from <strong>the</strong> <strong>Klamath</strong> River during floods. The Lost River<br />
is now diverted just below Olene into a channel across a low<br />
divide to <strong>the</strong> <strong>Klamath</strong> River. Generally, little water from <strong>the</strong><br />
Lost River drainage above <strong>the</strong> diversion channel now flows to<br />
<strong>the</strong> Tule Lake subbasin. The largest lake in <strong>the</strong> basin is <strong>Upper</strong><br />
<strong>Klamath</strong> Lake, which has a surface area between 100 <strong>and</strong> 140<br />
mi 2 (including non-drained fringe wetl<strong>and</strong>s) depending on<br />
stage (Hubbard, 1970; Snyder <strong>and</strong> Morace, 1997). Principal<br />
tributaries to <strong>Upper</strong> <strong>Klamath</strong> Lake include <strong>the</strong> Williamson<br />
River, <strong>the</strong> Wood River (which originates at a series <strong>of</strong> large<br />
springs north <strong>of</strong> <strong>the</strong> lake), <strong>and</strong> several streams emanating from<br />
<strong>the</strong> Cascade Range.<br />
The 250-mi (mile)-long <strong>Klamath</strong> River begins at <strong>the</strong><br />
outlet <strong>of</strong> <strong>Upper</strong> <strong>Klamath</strong> Lake, which is controlled by a dam.<br />
For <strong>the</strong> first mile downstream <strong>of</strong> <strong>the</strong> lake, <strong>the</strong> river is known<br />
as <strong>the</strong> Link River. About 1 mi below <strong>the</strong> dam, <strong>the</strong> river flows<br />
into a 20-mi-long narrow reservoir behind Keno Dam known<br />
as Lake Ewauna. The dam for ano<strong>the</strong>r impoundment, John<br />
C. Boyle Reservoir, is about 10 mi below Keno Dam. Below<br />
John C. Boyle Dam, <strong>the</strong> river enters a narrow canyon <strong>and</strong><br />
flows freely about 20 mi to Copco Lake (a reservoir) <strong>and</strong><br />
immediately below that, Iron Gate Reservoir. Iron Gate Dam,<br />
at about river mile 190, marks <strong>the</strong> downstream boundary <strong>of</strong><br />
<strong>the</strong> upper <strong>Klamath</strong> <strong>Basin</strong>. There are no impoundments on <strong>the</strong><br />
<strong>Klamath</strong> River below Iron Gate Dam.<br />
The surface hydrology <strong>of</strong> <strong>the</strong> upper <strong>Klamath</strong> <strong>Basin</strong><br />
has been extensively modified by drainage <strong>of</strong> lakes <strong>and</strong><br />
wetl<strong>and</strong>s for agriculture <strong>and</strong> routing <strong>of</strong> irrigation water.<br />
Prior to development, <strong>the</strong> Tule Lake <strong>and</strong> Lower <strong>Klamath</strong><br />
Lake subbasins contained large lakes fringed by extensive<br />
wetl<strong>and</strong>s. Under natural conditions, <strong>the</strong> Lost River flowed<br />
from <strong>the</strong> upper Lost River subbasin through <strong>the</strong> gap near<br />
Olene <strong>and</strong> <strong>the</strong>n south to Tule Lake. The Lost River system<br />
received flow from <strong>the</strong> <strong>Klamath</strong> River system during periods<br />
<strong>of</strong> flood. Prior to development <strong>of</strong> <strong>the</strong> Bureau <strong>of</strong> Reclamation<br />
<strong>Klamath</strong> Project, <strong>the</strong> high stage <strong>of</strong> Tule Lake was about 4,060<br />
ft (La Rue, 1922). At this stage, <strong>the</strong> lake would cover an area<br />
exceeding 96,000 acres. Historical accounts indicate that at<br />
high stage Tule Lake drained into <strong>the</strong> lava flows along <strong>the</strong><br />
sou<strong>the</strong>rn margin. In <strong>the</strong> early 1900s, <strong>the</strong> U.S. Reclamation<br />
Service (predecessor to <strong>the</strong> Bureau <strong>of</strong> Reclamation)<br />
experimented with augmenting this subsurface drainage in<br />
early attempts to drain <strong>the</strong> lake. La Rue (1922) argued that<br />
<strong>the</strong> fact that <strong>the</strong> water <strong>of</strong> Tule Lake was fresh, <strong>and</strong> not saline,<br />
was pro<strong>of</strong> that <strong>the</strong> lake “in <strong>the</strong> past had an outlet.” Subsurface<br />
drainage is also suggested by <strong>the</strong> hydraulic head gradient that<br />
slopes southward away from <strong>the</strong> Tule Lake subbasin toward<br />
<strong>the</strong> Pit River <strong>Basin</strong>. In 1912, a canal <strong>and</strong> dam were completed<br />
that allowed <strong>the</strong> diversion <strong>of</strong> water from <strong>the</strong> Lost River to<br />
<strong>the</strong> <strong>Klamath</strong> River, cutting <strong>of</strong>f <strong>the</strong> supply <strong>of</strong> water to Tule<br />
Lake. Most <strong>of</strong> <strong>the</strong> Tule Lake <strong>Basin</strong> was drained <strong>and</strong> is now
Introduction<br />
<br />
MEAN MONTHLY PRECIPITATION,<br />
IN INCHES<br />
MEAN MONTHLY PRECIPITATION,<br />
IN INCHES<br />
12<br />
10<br />
12<br />
10<br />
MEAN MONTHLY PRECIPITATION,<br />
IN INCHES<br />
MEAN MONTHLY PRECIPITATION,<br />
IN INCHES<br />
12<br />
10<br />
8<br />
6<br />
4<br />
2<br />
CRATER LAKE<br />
1961–90 mean<br />
annual total,<br />
65.4 inches<br />
0<br />
O N D J F M A M J J A S<br />
8<br />
6<br />
4<br />
2<br />
8<br />
6<br />
4<br />
2<br />
HOWARD PRAIRIE DAM<br />
1961–90 mean<br />
annual total,<br />
32.8 inches<br />
0<br />
O N D J F M A M J J A S<br />
12<br />
10<br />
8<br />
6<br />
4<br />
2<br />
MEAN MONTHLY PRECIPITATION,<br />
IN INCHES<br />
12<br />
10<br />
42°00'<br />
122°30'<br />
MOUNT HEBRON<br />
1961–90 mean<br />
annual total,<br />
12.6 inches<br />
0<br />
O N D J F M A M J J A S<br />
8<br />
6<br />
4<br />
2<br />
40<br />
140<br />
66<br />
<strong>Klamath</strong><br />
!.<br />
Crater<br />
Lake<br />
62<br />
<strong>Upper</strong><br />
<strong>Klamath</strong><br />
Lake<br />
River<br />
Dorris<br />
!.<br />
97<br />
138<br />
97<br />
!.<br />
Chiloquin<br />
!. !.<br />
20<br />
43°00'<br />
42°30'<br />
40<br />
30<br />
50<br />
41°30'<br />
60<br />
70<br />
60<br />
50<br />
60<br />
TULE LAKE<br />
1961–90 mean<br />
annual total,<br />
11.1 inches<br />
0<br />
O N D J F M A M J J A S<br />
CHEMULT<br />
1961–90 mean<br />
annual total,<br />
24.9 inches<br />
0<br />
O N D J F M A M J J A S<br />
50<br />
60<br />
5040<br />
122°00'<br />
20<br />
40<br />
20<br />
50<br />
20<br />
30<br />
40<br />
30<br />
30<br />
20<br />
MEAN MONTHLY PRECIPITATION,<br />
IN INCHES<br />
30<br />
Lower<br />
<strong>Klamath</strong><br />
Lake<br />
20<br />
40<br />
30<br />
12<br />
10<br />
8<br />
6<br />
4<br />
2<br />
20<br />
<strong>Klamath</strong><br />
Falls<br />
30<br />
20<br />
30<br />
121°30'<br />
!.<br />
Williamson River<br />
Sprague<br />
!.<br />
Tule<br />
Lake<br />
KLAMATH FALLS<br />
1961–90 mean<br />
annual total,<br />
13.5 inches<br />
0<br />
O N D J F M A M J J A S<br />
40<br />
20<br />
Bonanza<br />
Malin<br />
30<br />
Sycan<br />
140<br />
20<br />
River<br />
Lost River<br />
Clear<br />
Lake<br />
139<br />
River<br />
121°00'<br />
30<br />
North Fork<br />
South Fork<br />
0 10 20 30 40 50 MILES<br />
0 10 20 30 40 50 KILOMETERS<br />
20<br />
30<br />
MEAN MONTHLY PRECIPITATION,<br />
IN INCHES<br />
30<br />
!.<br />
OREGON<br />
CALIFORNIA<br />
12<br />
10<br />
8<br />
6<br />
4<br />
2<br />
30<br />
20<br />
20<br />
EXPLANATION<br />
SPRAGUE RIVER<br />
1961–90 mean<br />
annual total,<br />
16.2 inches<br />
0<br />
O N D J F M A M J J A S<br />
MEAN MONTHLY PRECIPITATION,<br />
IN INCHES<br />
12<br />
10<br />
8<br />
6<br />
4<br />
2<br />
ROUND GROVE<br />
1961–90 mean<br />
annual total,<br />
17.8 inches<br />
0<br />
O N D J F M A M J J A S<br />
Line <strong>of</strong> equal precipitation—<br />
Interval 10 inches<br />
Precipitation station<br />
Figure 2. Distribution <strong>of</strong> precipitation in <strong>the</strong> upper <strong>Klamath</strong> <strong>Basin</strong>, <strong>Oregon</strong> <strong>and</strong> California, <strong>and</strong> mean monthly precipitation at<br />
selected precipitation measurement stations. (Data from <strong>Oregon</strong> State University PRISM Group, 2006; <strong>and</strong> Western Regional<br />
Climate Center, 2006.)<br />
OR19-0048_fig02
<strong>Ground</strong>-<strong>Water</strong> <strong>Hydrology</strong> <strong>of</strong> <strong>the</strong> <strong>Upper</strong> <strong>Klamath</strong> <strong>Basin</strong>, <strong>Oregon</strong> <strong>and</strong> California<br />
under cultivation. The only remnant <strong>of</strong> <strong>the</strong> lake is <strong>the</strong> Tule<br />
Lake Sump in <strong>the</strong> sou<strong>the</strong>rn <strong>and</strong> western parts <strong>of</strong> <strong>the</strong> basin<br />
that collect irrigation return flow. Since 1942, water from <strong>the</strong><br />
sump has been pumped via tunnel through Sheepy Ridge into<br />
<strong>the</strong> Lower <strong>Klamath</strong> Lake subbasin. The Lower <strong>Klamath</strong> Lake<br />
subbasin once held a large lake-marsh complex that covered<br />
approximately 88,000 acres, about 58,000 acres <strong>of</strong> which were<br />
marginal wetl<strong>and</strong>s with <strong>the</strong> remaining 30,000 acres open water<br />
(La Rue, 1922). Lower <strong>Klamath</strong> Lake was connected to <strong>the</strong><br />
<strong>Klamath</strong> River through a channel known as <strong>the</strong> <strong>Klamath</strong> Strait,<br />
<strong>and</strong> probably through <strong>the</strong> expansive wetl<strong>and</strong> that separated <strong>the</strong><br />
lake from <strong>the</strong> river elsewhere. In <strong>the</strong> early 1900s, a railroad<br />
dike was constructed across <strong>the</strong> northwestern margin <strong>of</strong> <strong>the</strong><br />
Lower <strong>Klamath</strong> Lake subbasin, cutting <strong>of</strong>f flow between<br />
<strong>the</strong> lake <strong>and</strong> river except at <strong>the</strong> <strong>Klamath</strong> Strait. In 1917, <strong>the</strong><br />
control structure at <strong>the</strong> <strong>Klamath</strong> Strait was closed, cutting<br />
<strong>of</strong>f flow to <strong>the</strong> lake. As a result, Lower <strong>Klamath</strong> Lake is now<br />
largely drained, with much <strong>of</strong> <strong>the</strong> former lake bed <strong>and</strong> fringe<br />
wetl<strong>and</strong>s under cultivation. Areas <strong>of</strong> open water remain in <strong>the</strong><br />
Lower <strong>Klamath</strong> Lake Wildlife Refuge in <strong>the</strong> sou<strong>the</strong>rn part <strong>of</strong><br />
<strong>the</strong> subbasin.<br />
Currently (2007), about 500,000 acres <strong>of</strong> agricultural l<strong>and</strong><br />
are irrigated in <strong>the</strong> upper <strong>Klamath</strong> <strong>Basin</strong>, roughly 190,000 <strong>of</strong><br />
which are included in <strong>the</strong> Bureau <strong>of</strong> Reclamation <strong>Klamath</strong><br />
Project (fig. 3) (Carlson <strong>and</strong> Todd, 2003; Natural Resources<br />
Conservation Service, 2004). This total does not include<br />
wildlife refuge areas within <strong>the</strong> Project.<br />
The upper <strong>Klamath</strong> <strong>Basin</strong> is mostly forested (Loy <strong>and</strong><br />
o<strong>the</strong>rs, 2001). Forest trees in upl<strong>and</strong> areas east <strong>of</strong> <strong>the</strong> Cascade<br />
Range are predominantly ponderosa pine, with areas <strong>of</strong> true fir<br />
<strong>and</strong> Douglas fir on Yamsay <strong>and</strong> Gearhart Mountains. Forests<br />
in <strong>the</strong> Cascade Range are composed primarily <strong>of</strong> mountain<br />
hemlock <strong>and</strong> red fir. Lower elevation upl<strong>and</strong>s are dominated<br />
by lodgepole pine. Lowl<strong>and</strong> forests consist largely <strong>of</strong> juniper<br />
<strong>and</strong> sagebrush with some juniper grassl<strong>and</strong>s. Stream valleys<br />
<strong>and</strong> <strong>the</strong> broad, sediment-filled structural basins generally<br />
have extensive marshes, such as Sycan Marsh <strong>and</strong> <strong>Klamath</strong><br />
Marsh, except at lower elevations, where <strong>the</strong> basins have been<br />
mostly converted to agricultural l<strong>and</strong> (for example, <strong>the</strong> Wood<br />
River Valley, <strong>and</strong> <strong>the</strong> Lower <strong>Klamath</strong> Lake <strong>and</strong> Tule Lake<br />
subbasins).<br />
The population <strong>of</strong> <strong>the</strong> upper <strong>Klamath</strong> <strong>Basin</strong> is<br />
approximately 70,000. <strong>Klamath</strong> County, most <strong>of</strong> which is in<br />
<strong>the</strong> upper <strong>Klamath</strong> <strong>Basin</strong>, had a population <strong>of</strong> 64,600 in 2003,<br />
most <strong>of</strong> which live in <strong>the</strong> <strong>Klamath</strong> Falls area (<strong>Oregon</strong> Blue<br />
Book, 2006). Few people live outside <strong>Klamath</strong> County in <strong>the</strong><br />
<strong>Oregon</strong> part <strong>of</strong> <strong>the</strong> basin. The population in <strong>the</strong> California part<br />
<strong>of</strong> <strong>the</strong> upper <strong>Klamath</strong> <strong>Basin</strong> is difficult to estimate. Population<br />
in <strong>the</strong> block groups from <strong>the</strong> 2000 census that include <strong>the</strong><br />
populated parts <strong>of</strong> Modoc <strong>and</strong> Siskiyou Counties in <strong>the</strong> basin<br />
is slightly more than 3,000. Some small settlements <strong>and</strong><br />
ranches may not be included in <strong>the</strong>se block groups.<br />
Principal sectors <strong>of</strong> <strong>the</strong> economy in <strong>the</strong> upper <strong>Klamath</strong><br />
<strong>Basin</strong>, in terms <strong>of</strong> output <strong>and</strong> employment, include forest<br />
products, agriculture, construction, retail, health care, <strong>and</strong><br />
services (Weber <strong>and</strong> Sorte, 2003). In <strong>the</strong> agricultural sector,<br />
principal crops include (in approximate order, with largest<br />
acreages first) alfalfa hay, irrigated pasture, grains, <strong>and</strong><br />
potatoes (Carlson <strong>and</strong> Todd, 2003; Siskiyou County, 2003).<br />
The proportions vary slightly between l<strong>and</strong> inside <strong>and</strong> outside<br />
<strong>the</strong> Bureau <strong>of</strong> Reclamation <strong>Klamath</strong> Project, <strong>and</strong> between l<strong>and</strong><br />
in <strong>Oregon</strong> <strong>and</strong> California. Project l<strong>and</strong>s in California tend to<br />
include more grains than alfalfa. Most agricultural l<strong>and</strong> in <strong>the</strong><br />
upper <strong>Klamath</strong> <strong>Basin</strong> (not including rangel<strong>and</strong>) is irrigated.<br />
A substantial part <strong>of</strong> <strong>the</strong> local economy, <strong>the</strong>refore, relies on<br />
irrigation water.<br />
Irrigation water comes from a variety <strong>of</strong> sources in <strong>the</strong><br />
upper <strong>Klamath</strong> <strong>Basin</strong>. Upstream <strong>of</strong> <strong>Upper</strong> <strong>Klamath</strong> Lake, in<br />
<strong>the</strong> Williamson, Sprague, <strong>and</strong> Wood River drainages, private<br />
(non-Project) irrigation water comes primarily from diversion<br />
<strong>of</strong> surface water from <strong>the</strong> main-stem streams or tributaries.<br />
A smaller amount <strong>of</strong> irrigation water is pumped from ground<br />
water, particularly in <strong>the</strong> Sprague River Valley <strong>and</strong> <strong>Klamath</strong><br />
Marsh areas. In <strong>the</strong> Langell <strong>and</strong> Yonna Valleys <strong>of</strong> <strong>the</strong> upper<br />
Lost River subbasin, irrigation water comes from Clear Lake<br />
<strong>and</strong> Gerber Reservoirs. Irrigators use ground water <strong>and</strong> some<br />
surface water in Swan Lake Valley. <strong>Ground</strong> water is used<br />
for irrigation in areas not served by irrigation districts <strong>and</strong> to<br />
supplement surface-water supplies throughout <strong>the</strong> area.<br />
South <strong>of</strong> <strong>Upper</strong> <strong>Klamath</strong> Lake, most irrigation water<br />
comes from <strong>the</strong> lake, which is <strong>the</strong> largest single source <strong>of</strong><br />
irrigation water in <strong>the</strong> upper <strong>Klamath</strong> <strong>Basin</strong>. This area is <strong>the</strong><br />
main part <strong>of</strong> <strong>the</strong> Bureau <strong>of</strong> Reclamation <strong>Klamath</strong> Project.<br />
<strong>Water</strong> is stored in <strong>and</strong> diverted from <strong>the</strong> lake to irrigate l<strong>and</strong><br />
south <strong>of</strong> <strong>Klamath</strong> Falls, including <strong>the</strong> <strong>Klamath</strong> Valley, Poe<br />
Valley (in <strong>the</strong> Lost River subbasin upstream <strong>of</strong> Olene Gap),<br />
<strong>and</strong> <strong>the</strong> Tule Lake subbasin. Irrigation return flow (water that<br />
originates in <strong>Upper</strong> <strong>Klamath</strong> Lake) that ends up in <strong>the</strong> Tule<br />
Lake Sump is pumped through Sheepy Ridge <strong>and</strong> used for<br />
irrigation <strong>and</strong> refuge use in <strong>the</strong> sou<strong>the</strong>rn part <strong>of</strong> <strong>the</strong> Lower<br />
<strong>Klamath</strong> Lake subbasin. <strong>Water</strong> diverted from <strong>the</strong> <strong>Klamath</strong><br />
River several miles downstream <strong>of</strong> <strong>the</strong> lake also is used for<br />
irrigation <strong>and</strong> refuges in <strong>the</strong> Lower <strong>Klamath</strong> Lake subbasin.<br />
Irrigation <strong>and</strong> refuge return flow in <strong>the</strong> Lower <strong>Klamath</strong> Lake<br />
subbasin is routed back up <strong>the</strong> <strong>Klamath</strong> Strait drain through a<br />
series <strong>of</strong> pumping stations to <strong>the</strong> <strong>Klamath</strong> River.<br />
A certain amount <strong>of</strong> ground water is used for irrigation<br />
on l<strong>and</strong> surrounding <strong>the</strong> <strong>Klamath</strong> Project upslope <strong>of</strong> <strong>the</strong> major<br />
canals. Principal areas <strong>of</strong> ground-water use surrounding <strong>the</strong><br />
Project area include <strong>the</strong> sou<strong>the</strong>rn end <strong>of</strong> <strong>the</strong> <strong>Klamath</strong> Hills,<br />
parts <strong>of</strong> <strong>the</strong> <strong>Klamath</strong> Valley, <strong>and</strong> <strong>the</strong> nor<strong>the</strong>rn <strong>and</strong> eastern<br />
margins <strong>of</strong> <strong>the</strong> Tule Lake subbasin (fig. 1). Some ground<br />
water traditionally has been used for supplemental irrigation<br />
in <strong>the</strong> Project area. Increased water dem<strong>and</strong> due to drought<br />
<strong>and</strong> requirements for a 100,000 acre-ft pilot water bank placed<br />
on Reclamation by <strong>the</strong> National Oceanic <strong>and</strong> Atmospheric<br />
Administration (NOAA) Fisheries 2002 biological opinion<br />
(National Marine Fisheries Service, 2002) have resulted in a<br />
marked increase in ground-water pumping in <strong>and</strong> around <strong>the</strong><br />
<strong>Klamath</strong> Project since 2001.
Introduction<br />
<br />
122°00' 45' 30' 121°15'<br />
Modoc<br />
Point<br />
Sprague<br />
Sprague<br />
River<br />
River<br />
Beatty<br />
Bly Ridge<br />
42°15'<br />
<strong>Upper</strong><br />
<strong>Klamath</strong><br />
Bly<br />
Mt<br />
Lake<br />
Swan Lake Valley<br />
Yainax<br />
Butte<br />
<strong>Klamath</strong> Falls<br />
Dairy<br />
42°00'<br />
Lake<br />
Ewauna<br />
Keno<br />
Keno<br />
Dam<br />
<strong>Klamath</strong><br />
Strait<br />
Worden<br />
KLAMATH<br />
RIVER<br />
Midl<strong>and</strong><br />
Altamont<br />
Olene<br />
Henley<br />
<strong>Klamath</strong> Hills<br />
<strong>Klamath</strong> Valley<br />
Lost River<br />
Diversion<br />
Channel<br />
Merrill<br />
Lost<br />
Malin<br />
River<br />
Bonanza<br />
Bryant Mountain<br />
Lorella<br />
Miller Cr<br />
Langell<br />
Valley<br />
OREGON<br />
CALIFORNIA<br />
Dorris<br />
Butte<br />
Valley<br />
Lower<br />
<strong>Klamath</strong><br />
Lake<br />
Sheepy Ridge<br />
Lost<br />
River<br />
Tule<br />
Lake<br />
Sump<br />
Tulelake<br />
Clear<br />
Lake<br />
Res<br />
41°45'<br />
EXPLANATION<br />
Irrigated area within <strong>the</strong><br />
<strong>Klamath</strong> Project<br />
0 5 10 15 MILES<br />
0 5 10 KILOMETERS<br />
See table <strong>of</strong> contents for mapping sources<br />
Figure 3.<br />
Irrigated areas in <strong>the</strong> Bureau <strong>of</strong> Reclamation <strong>Klamath</strong> Project, <strong>Oregon</strong> <strong>and</strong> California.<br />
OR19-0048_fig03
<strong>Ground</strong>-<strong>Water</strong> <strong>Hydrology</strong> <strong>of</strong> <strong>the</strong> <strong>Upper</strong> <strong>Klamath</strong> <strong>Basin</strong>, <strong>Oregon</strong> <strong>and</strong> California<br />
Purpose <strong>and</strong> Scope<br />
This report summarizes <strong>the</strong> present underst<strong>and</strong>ing <strong>of</strong><br />
regional ground-water flow in <strong>the</strong> upper <strong>Klamath</strong> <strong>Basin</strong><br />
resulting from <strong>the</strong> USGS–OWRD cooperative study. The<br />
report provides a description <strong>of</strong> <strong>the</strong> ground-water hydrology<br />
for resource managers, water users, <strong>and</strong> those with a general<br />
interest. It is also intended to provide sufficient quantitative<br />
information useful to hydrologists working in <strong>the</strong> basin, <strong>and</strong> to<br />
provide background for subsequent reports <strong>and</strong> investigations.<br />
The report is regional in scope. Thus, data <strong>and</strong> analysis<br />
presented herein are intended to provide an underst<strong>and</strong>ing <strong>of</strong><br />
<strong>the</strong> ground-water hydrology at a regional scale. Although <strong>the</strong><br />
information <strong>and</strong> interpretations are useful for underst<strong>and</strong>ing<br />
<strong>the</strong> hydrologic setting <strong>of</strong> smaller areas, <strong>the</strong> ground-water<br />
hydrology <strong>of</strong> local areas is generally not discussed in detail.<br />
The report covers many key aspects <strong>of</strong> <strong>the</strong> regional<br />
ground-water system. A summary <strong>of</strong> <strong>the</strong> geologic framework<br />
<strong>of</strong> <strong>the</strong> regional ground-water system is presented that is<br />
based on existing geologic mapping, field reconnaissance,<br />
radiometric age dates, <strong>and</strong> interpretation <strong>of</strong> lithologic data<br />
from more than 1,000 wells. A regional ground-water<br />
budget (including recharge <strong>and</strong> discharge), calculated<br />
from precipitation data, streamflow data, measured <strong>and</strong><br />
estimated ground-water discharge to streams, <strong>and</strong> estimated<br />
evapotranspiration, also is provided. The distribution <strong>of</strong><br />
hydraulic head, which controls ground-water flow directions,<br />
was estimated from water-level measurements in more than<br />
1,000 wells, altitudes <strong>of</strong> gaining stream reaches, <strong>and</strong> altitudes<br />
<strong>of</strong> hundreds <strong>of</strong> springs mapped on USGS quadrangle maps.<br />
The response <strong>of</strong> <strong>the</strong> flow system to climate variations <strong>and</strong><br />
pumping stresses was determined by using time-series waterlevel<br />
measurements from wells throughout <strong>the</strong> basin, with<br />
frequencies ranging from hours to months <strong>and</strong> periods ranging<br />
from years to decades, <strong>and</strong> from streamflow data.<br />
Geologic Framework<br />
Geologic Controls on <strong>Ground</strong>-<strong>Water</strong> Flow<br />
The principal geologic factors that influence ground<br />
water are <strong>the</strong> porosity <strong>and</strong> permeability <strong>of</strong> <strong>the</strong> rock or<br />
sediment through which it flows. Porosity, in general terms,<br />
is <strong>the</strong> proportion <strong>of</strong> a rock or deposit that consists <strong>of</strong> open<br />
space. In a gravel deposit, this would be <strong>the</strong> proportion <strong>of</strong> <strong>the</strong><br />
volume <strong>of</strong> <strong>the</strong> deposit represented by <strong>the</strong> space between <strong>the</strong><br />
individual pebbles <strong>and</strong> cobbles. Permeability is a term used<br />
to describe <strong>the</strong> ease with which a fluid can move through<br />
a material such as rock or sedimentary deposits. Deposits<br />
with large interconnected open spaces, such as gravel, <strong>of</strong>fer<br />
little resistance to ground-water flow <strong>and</strong> are, <strong>the</strong>refore,<br />
usually highly permeable. Rocks with few, very small, or<br />
poorly connected open spaces <strong>of</strong>fer considerable resistance to<br />
ground-water flow <strong>and</strong>, <strong>the</strong>refore, have low permeability. The<br />
hydraulic characteristics <strong>of</strong> geologic materials vary between<br />
<strong>and</strong> within rock types. For example, in sedimentary deposits<br />
<strong>the</strong> permeability is a function <strong>of</strong> grain size <strong>and</strong> <strong>the</strong> range <strong>of</strong><br />
grain sizes (<strong>the</strong> degree <strong>of</strong> sorting). Coarse, well-sorted gravel<br />
has much higher permeability than well-sorted s<strong>and</strong>. A wellsorted<br />
s<strong>and</strong> or gravel has a higher permeability than a deposit<br />
that is poorly sorted <strong>and</strong> has <strong>the</strong> open spaces between pebbles<br />
or s<strong>and</strong> grains filled with silt or clay. Clay-rich deposits<br />
generally have very low permeability. The permeability <strong>of</strong><br />
lava flows also can vary markedly depending on <strong>the</strong> degree <strong>of</strong><br />
fracturing. The highly fractured, rubbly zones at <strong>the</strong> tops <strong>and</strong><br />
bottoms <strong>of</strong> lava flows <strong>and</strong> in interflow zones are <strong>of</strong>ten highly<br />
permeable, whereas <strong>the</strong> dense interior parts <strong>of</strong> lava flows<br />
can have very low permeability. Wea<strong>the</strong>ring <strong>and</strong> secondary<br />
mineralization, which <strong>of</strong>ten are a function <strong>of</strong> <strong>the</strong> age <strong>of</strong><br />
<strong>the</strong> rock, can strongly influence permeability. Sedimentary<br />
deposits or lava flows in which <strong>the</strong> original open spaces<br />
have been filled with secondary minerals can have very low<br />
permeability.<br />
Geologic properties that influence <strong>the</strong> movement <strong>of</strong><br />
ground water within a flow system also can define <strong>the</strong><br />
boundaries <strong>of</strong> <strong>the</strong> system. Geologic terranes consisting <strong>of</strong><br />
predominantly low-permeability materials can form <strong>the</strong><br />
boundaries <strong>of</strong> a regional flow system.<br />
General Geology<br />
The upper <strong>Klamath</strong> <strong>Basin</strong> has been a region <strong>of</strong> volcanic<br />
activity for at least 35 million yr (years) (Sherrod <strong>and</strong> Smith,<br />
2000), resulting in complex assemblages <strong>of</strong> volcanic vents<br />
<strong>and</strong> lava flows, pyroclastic deposits, <strong>and</strong> volcanically derived<br />
sedimentary deposits. Volcanic <strong>and</strong> tectonic processes have<br />
created many <strong>of</strong> <strong>the</strong> present-day l<strong>and</strong>forms in <strong>the</strong> basin.<br />
Glaciation <strong>and</strong> stream processes have subsequently modified<br />
<strong>the</strong> l<strong>and</strong>scape in many places.<br />
The upper <strong>Klamath</strong> <strong>Basin</strong> lies within two major geologic<br />
provinces, <strong>the</strong> Cascade Range <strong>and</strong> <strong>the</strong> <strong>Basin</strong> <strong>and</strong> Range<br />
Province (Orr <strong>and</strong> o<strong>the</strong>rs, 1992). The processes that have<br />
operated in <strong>the</strong>se provinces have overlapped <strong>and</strong> interacted<br />
in much <strong>of</strong> <strong>the</strong> upper <strong>Klamath</strong> <strong>Basin</strong>. The Cascade Range<br />
is a north-south trending zone <strong>of</strong> compositionally diverse<br />
volcanic eruptive centers <strong>and</strong> <strong>the</strong>ir deposits extending from<br />
nor<strong>the</strong>rn California to sou<strong>the</strong>rn British Columbia. The<br />
Cascade Range is subdivided between an older, highly eroded<br />
Western Cascades, <strong>and</strong> a younger, mostly constructional<br />
High Cascades. Prominent among <strong>the</strong> eruptive centers in <strong>the</strong><br />
High Cascades <strong>of</strong> <strong>the</strong> <strong>Klamath</strong> <strong>Basin</strong> are large composite<br />
<strong>and</strong> shield volcanoes such as Mount Mazama (Crater Lake),<br />
Mount McLoughlin, <strong>and</strong> Medicine Lake Volcano. The<br />
Cascade Range has been impinged on its eastern side by <strong>the</strong><br />
adjacent structurally dominated <strong>Basin</strong> <strong>and</strong> Range Province.<br />
The <strong>Basin</strong> <strong>and</strong> Range Province is a region <strong>of</strong> crustal extension<br />
characterized by subparallel, fault-bounded, down-dropped
Geologic Framework<br />
<br />
basins separated by fault-block ranges. Individual basins <strong>and</strong><br />
intervening ranges are typically 10–20 mi across. The <strong>Basin</strong><br />
<strong>and</strong> Range Province encompasses much <strong>of</strong> <strong>the</strong> interior <strong>of</strong><br />
<strong>the</strong> Western United States, extending from central <strong>Oregon</strong><br />
southward through Nevada <strong>and</strong> western Utah, into <strong>the</strong> sou<strong>the</strong>rn<br />
parts <strong>of</strong> California, Arizona, <strong>and</strong> New Mexico. Although <strong>the</strong><br />
<strong>Basin</strong> <strong>and</strong> Range Province is primarily structural, faulting has<br />
been accompanied by widespread volcanism.<br />
The oldest rocks in <strong>the</strong> upper <strong>Klamath</strong> <strong>Basin</strong> study area<br />
are part <strong>of</strong> <strong>the</strong> Western Cascades subprovince <strong>and</strong> consist<br />
primarily <strong>of</strong> lava flows, <strong>and</strong>esitic mudflows, tuffaceous<br />
sedimentary rocks, <strong>and</strong> vent deposits. The Western Cascade<br />
rocks range in age from 20 to 33 million years (my) <strong>and</strong> are<br />
as much as 20,000 ft thick (Hammond, 1983; Vance, 1984).<br />
Rocks <strong>of</strong> <strong>the</strong> Western Cascades overlie pre-Tertiary rocks <strong>of</strong><br />
<strong>the</strong> <strong>Klamath</strong> Mountains Province, just west <strong>of</strong> <strong>the</strong> study area.<br />
Western Cascades rocks have very low permeability because<br />
<strong>the</strong> tuffaceous materials are mostly devitrified (changed to<br />
clays <strong>and</strong> o<strong>the</strong>r minerals), <strong>and</strong> lava flows are wea<strong>the</strong>red <strong>and</strong><br />
contain abundant secondary minerals. Because <strong>of</strong> <strong>the</strong> low<br />
permeability, ground water does not easily move through<br />
<strong>the</strong> Western Cascades rocks, <strong>and</strong> <strong>the</strong> unit acts as a barrier to<br />
regional ground-water flow. The Western Cascades constitute<br />
part <strong>of</strong> <strong>the</strong> western boundary <strong>of</strong> <strong>the</strong> regional ground-water<br />
flow system. Western Cascade rocks dip toward <strong>the</strong> east <strong>and</strong><br />
underlie <strong>the</strong> High Cascade deposits, <strong>and</strong> define <strong>the</strong> lower<br />
boundary <strong>of</strong> <strong>the</strong> regional flow system throughout that part <strong>of</strong><br />
<strong>the</strong> study area.<br />
The High Cascade subprovince ranges in age from late<br />
Miocene (7 my) to Recent; however, most rocks are Pliocene<br />
(5 my) to Recent in age (Mertzman, 2000). Deposits within<br />
<strong>the</strong> High Cascade subprovince in <strong>the</strong> study area mostly form<br />
constructional features <strong>and</strong> consist <strong>of</strong> volcanic vents <strong>and</strong> lava<br />
flows with relatively minor interbedded volcaniclastic <strong>and</strong><br />
sedimentary deposits. An area <strong>of</strong> numerous late Miocene<br />
to Pliocene cinder cones extends from southwest <strong>of</strong> Butte<br />
Valley to northwest <strong>of</strong> Mt. Mazama (Crater Lake). Quaternary<br />
volcanic deposits are associated with a few volcanic centers<br />
concentrated in two general areas in <strong>the</strong> upper <strong>Klamath</strong><br />
<strong>Basin</strong>: from Lake <strong>of</strong> <strong>the</strong> Woods north to Crater Lake <strong>and</strong><br />
from Mt. Shasta (south <strong>of</strong> <strong>the</strong> study area) east to Medicine<br />
Lake Volcano. The High Cascades rocks are relatively thin in<br />
sou<strong>the</strong>rn <strong>Oregon</strong> <strong>and</strong> nor<strong>the</strong>rn California, typically measured<br />
in hundreds <strong>of</strong> feet thick, ra<strong>the</strong>r than thous<strong>and</strong>s (Stan<br />
Mertzman, Franklin <strong>and</strong> Marshall College, written commun.,<br />
2003). High Cascade rocks unconformably overlie Western<br />
Cascade rocks <strong>and</strong> are very permeable, relative to <strong>the</strong> older<br />
rocks.<br />
<strong>Basin</strong> <strong>and</strong> Range Province deposits in <strong>the</strong> study area<br />
range in age from middle Miocene (13 my) to Recent. The<br />
oldest rocks are middle to late Miocene in age, ranging from<br />
13 to 8 my. These rocks are exposed just south <strong>of</strong> <strong>the</strong> study<br />
area in <strong>the</strong> Pit River <strong>Basin</strong> <strong>and</strong> are equivalent to <strong>the</strong> upper<br />
Cedarville Series <strong>of</strong> Russell (1928). In <strong>the</strong> study area, those<br />
rocks probably underlie <strong>the</strong> Pliocene age lavas south <strong>of</strong> Clear<br />
Lake Reservoir. The older rocks in <strong>the</strong> Pit River <strong>Basin</strong> <strong>and</strong><br />
bounding <strong>the</strong> eastern part <strong>of</strong> <strong>the</strong> study area are mostly silicic<br />
domes, flows, <strong>and</strong> pyroclastic deposits, which generally have<br />
low permeability (California Department <strong>of</strong> <strong>Water</strong> Resources,<br />
1963) <strong>and</strong> typically are faulted <strong>and</strong> tilted.<br />
Late Miocene to Pliocene volcanic rocks <strong>of</strong> <strong>the</strong> <strong>Basin</strong> <strong>and</strong><br />
Range Province are <strong>the</strong> major water bearing rocks in <strong>the</strong> upper<br />
<strong>Klamath</strong> <strong>Basin</strong> study area. These units consist <strong>of</strong> volcanic<br />
vent deposits <strong>and</strong> flow rocks throughout <strong>the</strong> area east <strong>of</strong><br />
<strong>Upper</strong> <strong>Klamath</strong> Lake <strong>and</strong> Lower <strong>Klamath</strong> Lake, <strong>and</strong> probably<br />
underlie most <strong>of</strong> <strong>the</strong> valley- <strong>and</strong> basin-fill deposits in <strong>the</strong> study<br />
area. Late Miocene to Pliocene rocks also form upl<strong>and</strong>s along<br />
<strong>the</strong> eastern boundary <strong>of</strong> <strong>the</strong> study area, <strong>and</strong> form <strong>the</strong> plateau<br />
that extends from <strong>the</strong> Langell Valley south to <strong>the</strong> Pit River.<br />
The rocks are predominately basalt <strong>and</strong> basaltic <strong>and</strong>esite in<br />
composition, but silicic vents <strong>and</strong> lava flows occur locally,<br />
notably in <strong>the</strong> vicinity <strong>of</strong> Beatty, <strong>Oregon</strong>.<br />
Tuff cones <strong>and</strong> tuff rings are <strong>the</strong> predominant volcanic<br />
vent form in <strong>the</strong> Sprague River subbasin between Chiloquin<br />
<strong>and</strong> Sprague River, <strong>Oregon</strong>. Tuff cones <strong>and</strong> rings form when<br />
rising magma comes in contact with water, resulting in<br />
explosive fragmentation <strong>of</strong> <strong>the</strong> volcanic material. The late<br />
Miocene to Pliocene rocks typically exhibit high to very<br />
high permeability. However, <strong>the</strong> permeability locally may<br />
be markedly reduced by secondary mineralization from<br />
hydro<strong>the</strong>rmal alteration.<br />
The volcanic rocks <strong>of</strong> <strong>the</strong> <strong>Basin</strong> <strong>and</strong> Range Province are<br />
interbedded with, <strong>and</strong> locally overlain by, late Miocene to<br />
Pliocene sedimentary rocks. The sedimentary rocks consist <strong>of</strong><br />
tuffaceous s<strong>and</strong>stone, ashy diatomite, mudstone, siltstone, <strong>and</strong><br />
some conglomerates. These units are exposed both in downdropped<br />
basins <strong>and</strong> in up-thrown mountain blocks, indicating<br />
that <strong>the</strong> deposits in part represent an earlier generation <strong>of</strong><br />
sediment-filled basins have been subsequently faulted <strong>and</strong><br />
uplifted. These sedimentary deposits are typically poor water<br />
producers, <strong>and</strong> <strong>of</strong>ten serve as confining layers for underlying<br />
volcanic aquifers.<br />
The youngest stratigraphic unit in <strong>the</strong> upper <strong>Klamath</strong><br />
<strong>Basin</strong> consists <strong>of</strong> late Pliocene to Recent sedimentary deposits.<br />
Those deposits include alluvium along modern flood plains,<br />
basin-fill deposits within active grabens, l<strong>and</strong>slide deposits,<br />
<strong>and</strong> glacial drift <strong>and</strong> outwash. Very thick accumulations<br />
<strong>of</strong> silt, s<strong>and</strong>, clay, <strong>and</strong> diatomite underlie <strong>the</strong> westernmost<br />
basins, such as <strong>the</strong> <strong>Upper</strong> <strong>Klamath</strong> Lake, Lower <strong>Klamath</strong><br />
Lake, Butte Valley, <strong>and</strong> Tule Lake subbasins. For example,<br />
up to 1,740 ft <strong>of</strong> basin-fill sediment underlies <strong>the</strong> town <strong>of</strong><br />
Tulelake, California. Sediment near <strong>the</strong> base <strong>of</strong> <strong>the</strong> deposit at<br />
Tulelake has been assigned an age <strong>of</strong> 3.3 my on <strong>the</strong> basis <strong>of</strong><br />
radiometric ages <strong>of</strong> interbedded tephra, paleomagnetic data,<br />
<strong>and</strong> estimates <strong>of</strong> sedimentation rates (Adam <strong>and</strong> o<strong>the</strong>rs, 1990).<br />
Gravity data suggest that <strong>the</strong> sediment-fill thickness may<br />
exceed 6,000 ft in <strong>the</strong> Lower <strong>Klamath</strong> Lake subbasin <strong>and</strong> may<br />
be in <strong>the</strong> range <strong>of</strong> 1,300 to 4,000 ft in <strong>the</strong> <strong>Upper</strong> <strong>Klamath</strong> Lake<br />
subbasin (Sammel <strong>and</strong> Peterson, 1976; Veen, 1981; Northwest<br />
Geophysical Associates Inc., 2002).
10 <strong>Ground</strong>-<strong>Water</strong> <strong>Hydrology</strong> <strong>of</strong> <strong>the</strong> <strong>Upper</strong> <strong>Klamath</strong> <strong>Basin</strong>, <strong>Oregon</strong> <strong>and</strong> California<br />
Hydrogeologic Units<br />
Hundreds <strong>of</strong> distinct <strong>and</strong> mappable geologic units have<br />
been identified by geologists in <strong>the</strong> upper <strong>Klamath</strong> <strong>Basin</strong>.<br />
Many <strong>of</strong> <strong>the</strong>se geologic units have very similar hydrologic<br />
characteristics. For purposes <strong>of</strong> <strong>the</strong> description <strong>and</strong> analysis<br />
<strong>of</strong> regional ground-water flow, geologic units are typically<br />
combined into a smaller number <strong>of</strong> hydrogeologic units.<br />
Hydrogeologic units consist <strong>of</strong> groupings <strong>of</strong> geologic units<br />
that contain rock types <strong>of</strong> similar hydrologic characteristics<br />
<strong>and</strong> are distinct from o<strong>the</strong>r units. The geology <strong>of</strong> <strong>the</strong> upper<br />
<strong>Klamath</strong> <strong>Basin</strong> is herein generalized into eight hydrogeologic<br />
units (fig. 4 <strong>and</strong> table 1). Pre-Tertiary rocks are not exposed in<br />
outcrops or penetrated by wells in <strong>the</strong> study area <strong>and</strong> are not<br />
discussed.<br />
Early to mid-Tertiary volcanics <strong>and</strong> sediments (Tovs),<br />
<strong>the</strong> oldest hydrogeologic unit in <strong>the</strong> study area, comprises<br />
Miocene <strong>and</strong> older lava <strong>and</strong> volcaniclastic rocks <strong>of</strong> <strong>the</strong><br />
Western Cascade subprovince along <strong>the</strong> western margin <strong>of</strong><br />
<strong>the</strong> study area, as well as older volcanic deposits beneath late<br />
Tertiary lavas along <strong>the</strong> eastern margin. The unit also includes<br />
older rocks exposed in <strong>the</strong> Pit River <strong>Basin</strong> sou<strong>the</strong>ast <strong>of</strong> <strong>the</strong><br />
study area. The permeability <strong>of</strong> this unit is generally low<br />
due to wea<strong>the</strong>ring, hydro<strong>the</strong>rmal alteration, <strong>and</strong> secondary<br />
mineralization. This unit is herein considered a boundary to<br />
<strong>the</strong> regional ground-water system <strong>of</strong> <strong>the</strong> upper <strong>Klamath</strong> <strong>Basin</strong>.<br />
Late Tertiary volcaniclastic deposits (Tvpt) include<br />
palagonitized basaltic ash <strong>and</strong> lapilli deposits associated with<br />
eruptive centers. The hydrologic characteristics <strong>of</strong> this unit<br />
are not well known, but springs emerge from basal contact<br />
with unit Ts. This unit is most prominent in <strong>the</strong> Sprague River<br />
Valley.<br />
Late Tertiary sedimentary rocks (Ts) consist<br />
predominately <strong>of</strong> fine-grained continental sedimentary<br />
deposits that include bedded diatomite, mudstone, siltstone,<br />
<strong>and</strong> s<strong>and</strong>stone. This unit has generally low permeability.<br />
These deposits occur throughout <strong>the</strong> central part <strong>of</strong> <strong>the</strong> upper<br />
<strong>Klamath</strong> <strong>Basin</strong>. They are exposed in upl<strong>and</strong>s in interior parts<br />
<strong>of</strong> <strong>the</strong> basin <strong>and</strong> penetrated by wells in <strong>the</strong> river valleys.<br />
Lithologic logs <strong>of</strong> wells in <strong>the</strong> Sprague River Valley indicate<br />
that <strong>the</strong> thickness <strong>of</strong> <strong>the</strong>se sedimentary deposits <strong>the</strong>re locally<br />
exceeds 1,500 ft.<br />
Late Tertiary volcanic rocks (Tv) consist predominately<br />
<strong>of</strong> basaltic <strong>and</strong> <strong>and</strong>esitic lava flows <strong>and</strong> vent deposits, but<br />
<strong>the</strong> unit includes local silicic domes <strong>and</strong> flows. This unit is<br />
locally affected by hydro<strong>the</strong>rmal alteration <strong>and</strong> secondary<br />
mineralization. This is <strong>the</strong> most geographically extensive<br />
hydrogeologic unit, occurring throughout most <strong>of</strong> <strong>the</strong> upper<br />
<strong>Klamath</strong> <strong>Basin</strong>. The unit has moderate to high permeability<br />
<strong>and</strong> is by far <strong>the</strong> most widely developed aquifer unit in <strong>the</strong><br />
study area.<br />
Quaternary to late Tertiary sedimentary rocks (QTs)<br />
consist <strong>of</strong> medium- to coarse-grained unconsolidated to<br />
moderately indurated sedimentary deposits. The hydraulic<br />
characteristics <strong>of</strong> this unit are not well known, but lithologic<br />
descriptions on maps suggest that it is moderately permeable<br />
at some locations. This unit occurs locally in <strong>the</strong> western<br />
Wood River Valley, south <strong>of</strong> <strong>Klamath</strong> Falls, <strong>and</strong> in <strong>the</strong><br />
uppermost Williamson River subbasin.<br />
Quaternary volcanics (Qv) consist primarily <strong>of</strong> basaltic<br />
<strong>and</strong> <strong>and</strong>esitic lavas <strong>and</strong> vent deposits occurring in <strong>the</strong> Cascade<br />
Range <strong>and</strong> around Medicine Lake Volcano. These materials<br />
are generally highly permeable.<br />
Quaternary volcaniclastic deposits (Qvp) consist<br />
primarily <strong>of</strong> pyroclastic flows <strong>and</strong> air-fall material (pumice<br />
ash <strong>and</strong> lapilli) deposited during <strong>the</strong> climactic eruption <strong>of</strong> Mt.<br />
Mazama that formed <strong>the</strong> caldera encompassing Crater Lake.<br />
This unit is most extensive in <strong>the</strong> Cascade Range around<br />
Crater Lake <strong>and</strong> in <strong>the</strong> upper Williamson River subbasin.<br />
As mapped (fig. 4), <strong>the</strong> unit also includes debris avalanche<br />
deposits in <strong>the</strong> Shasta River Valley outside <strong>of</strong> <strong>the</strong> study area.<br />
Minor Quaternary pyroclastic deposits occur on Medicine<br />
Lake Volcano <strong>and</strong> in Butte Valley. Air-fall deposits are highly<br />
permeable.<br />
Quaternary sediments (Qs) include <strong>the</strong> alluvial deposits<br />
in principal stream valleys, glacial deposits in <strong>the</strong> Cascade<br />
Range, <strong>and</strong> basin-filling sediments in <strong>the</strong> major lake basins.<br />
The basin-filling deposits are generally fine grained <strong>and</strong> have<br />
low permeability. Coarse facies occur at some locations within<br />
<strong>the</strong> basin-filling deposits.<br />
Qs<br />
Qvp<br />
Qv<br />
QTs<br />
Ts<br />
Tvpt<br />
Tv<br />
Tovs<br />
pT<br />
EXPLANATION FOR FIGURE 4<br />
Hydrogeologic unit present at l<strong>and</strong> surface<br />
Quaternary sedimentary deposits<br />
Quaternary volcaniclastic deposits<br />
Quaternary volcanic rocks<br />
Quaternary to late Tertiary sedimentary rocks<br />
Late Tertiary sedimentary rocks<br />
Late Tertiary volcaniclastic rocks<br />
Late Tertiary volcanic rocks<br />
Older Tertiary volcanic <strong>and</strong> sedimentary rocks<br />
Pre-Tertiary rocks<br />
Geologic fault, dashed where inferred,<br />
dotted where concealed<br />
NOTE: Geology generalized from:<br />
Gay <strong>and</strong> Aune, 1958;<br />
Walker, 1963;<br />
Smith <strong>and</strong> o<strong>the</strong>rs, 1982;<br />
Wagner <strong>and</strong> Saucedo, 1987;<br />
Sherrod, 1991;<br />
MacLeod <strong>and</strong> Sherrod, 1992;<br />
Sherrod <strong>and</strong> Pickthorn, 1992, <strong>and</strong><br />
Sherrod <strong>and</strong> Smith, 2000.
Creek<br />
Creek<br />
Geologic Framework 11<br />
43°15'<br />
43°00'<br />
122°30' 15'<br />
138<br />
DOUGLAS<br />
Diamond<br />
Lake<br />
230<br />
Crater Lake<br />
Crater<br />
Lake<br />
Annie<br />
122°00'<br />
Scott<br />
Creek<br />
S<strong>and</strong><br />
Creek<br />
Sun<br />
138<br />
97<br />
Lenz<br />
45'<br />
Chemult<br />
Big<br />
Springs<br />
Creek<br />
Silver<br />
Jack<br />
Lake<br />
Creek<br />
30'<br />
<strong>Klamath</strong>Rocky<br />
Marsh Ford<br />
Williamson<br />
Road<br />
Sheep<br />
Creek<br />
Long<br />
15'<br />
Creek<br />
Silver<br />
Lake<br />
121°00'<br />
LAKE<br />
Sycan<br />
Marsh<br />
<strong>Upper</strong><br />
<strong>Klamath</strong><br />
<strong>Basin</strong><br />
31<br />
Summer<br />
Lake<br />
OREGON<br />
Winter Ridge<br />
CALIFORNIA<br />
120°<br />
45'<br />
Summer Lake<br />
45'<br />
30'<br />
62<br />
JACKSON<br />
Butte<br />
Falls<br />
Prospect<br />
Mt<br />
McLoughlin<br />
Sevenmile<br />
Rocky<br />
Point<br />
Creek<br />
Creek<br />
Wood<br />
River<br />
Creek<br />
<strong>Upper</strong><br />
Fort<br />
<strong>Klamath</strong><br />
Spring<br />
Creek<br />
Larkin<br />
Creek<br />
<strong>Klamath</strong><br />
Agency<br />
62<br />
Agency<br />
Lake<br />
<strong>Klamath</strong><br />
Kirk<br />
Chiloquin<br />
Chiloquin Narrows<br />
Modoc<br />
Point<br />
KLAMATH<br />
Sprague<br />
Trout Cr<br />
River<br />
Taylor<br />
Butte<br />
Sprague<br />
River<br />
River<br />
Whisky<br />
Creek<br />
Sycan<br />
Torrent<br />
Spring<br />
River<br />
Beatty<br />
Brown<br />
Creek<br />
Fivemile<br />
Creek<br />
Meryl<br />
N<br />
Bly<br />
Creek<br />
S Fork<br />
River<br />
Sprague<br />
River<br />
Sprague<br />
Gearhart Mountain<br />
15'<br />
42°00'<br />
66<br />
Camp Cr<br />
Scotch Cr<br />
Dry Cr<br />
Mill Cr<br />
Jenny<br />
Cr<br />
Fall<br />
Cr<br />
<strong>Klamath</strong><br />
Iron<br />
Gate<br />
Res<br />
Pinehurst<br />
Bogus<br />
Copco<br />
Lake<br />
Spencer<br />
Edge Cr<br />
Shovel<br />
Cr<br />
Creek<br />
River<br />
Lake<br />
<strong>of</strong> <strong>the</strong><br />
Woods<br />
John C. Boyle<br />
Reservoir<br />
140<br />
Keno<br />
<strong>Klamath</strong><br />
Strait<br />
Dorris<br />
Butte<br />
Valley<br />
Lake<br />
66<br />
Dairy<br />
<strong>Klamath</strong> Falls<br />
Lake Ewauna<br />
Lower<br />
<strong>Klamath</strong><br />
Lake<br />
Poe Valley<br />
Lost River<br />
Diversion<br />
Channel<br />
Merrill<br />
Olene<br />
Lost<br />
River<br />
Lost<br />
Tule<br />
Lake<br />
Sump<br />
70<br />
Malin<br />
River<br />
Tulelake<br />
Bonanza<br />
Lorella<br />
Langell<br />
Valley<br />
Miller Cr<br />
Clear<br />
Lake<br />
Res<br />
Gerber<br />
Reservoir<br />
Willow<br />
Boles<br />
Cr<br />
140<br />
Coleman Rim<br />
Cr<br />
45'<br />
Shasta River<br />
Little<br />
Shasta<br />
River<br />
97<br />
Butte<br />
SISKIYOU<br />
Medicine<br />
Lake<br />
Volcano<br />
MODOC<br />
139<br />
41°30'<br />
5<br />
Whitney<br />
Creek<br />
Scale 1:1,000,000<br />
5 0 5 10 15 20 MILES<br />
5 0 5 10 15 20 KILOMETERS<br />
299<br />
See table <strong>of</strong> contents for mapping sources<br />
Figure 4.<br />
Hydrogeologic units <strong>of</strong> <strong>the</strong> upper <strong>Klamath</strong> <strong>Basin</strong>, <strong>Oregon</strong> <strong>and</strong> California.<br />
OR19-0048_fig04a
12 <strong>Ground</strong>-<strong>Water</strong> <strong>Hydrology</strong> <strong>of</strong> <strong>the</strong> <strong>Upper</strong> <strong>Klamath</strong> <strong>Basin</strong>, <strong>Oregon</strong> <strong>and</strong> California<br />
Table 1.<br />
Generalized hydrogeologic units in <strong>the</strong> upper <strong>Klamath</strong> <strong>Basin</strong>, <strong>Oregon</strong> <strong>and</strong> California.<br />
Hydrogeologic unit Map symbol Lithologic <strong>and</strong> hydrologic characteristics<br />
Quaternary<br />
sedimentary<br />
deposits<br />
Quaternary<br />
volcaniclastic<br />
deposits<br />
Quaternary volcanic<br />
rocks<br />
Quaternary to<br />
late Tertiary<br />
sedimentary rocks<br />
Late Tertiary<br />
sedimentary rocks<br />
Late Tertiary<br />
volcaniclastic<br />
rocks<br />
Late Tertiary<br />
volcanic rocks<br />
Older Tertiary<br />
volcanic <strong>and</strong><br />
sedimentary rocks<br />
Qs<br />
Qvp<br />
Qv<br />
QTs<br />
Ts<br />
Tvpt<br />
Tv<br />
Tovs<br />
Fine- to coarse-grained sediments deposited in stream valleys <strong>and</strong> major lake basins. Permeable coarsegrained<br />
deposits occur in stream valleys <strong>and</strong> locally in <strong>the</strong> lake basins. The lake basin deposits are,<br />
however, predominantly fine grained <strong>and</strong> have low permeability.<br />
Pyroclastic flows <strong>and</strong> air fall material (pumice, ash, <strong>and</strong> lapilli) deposited during <strong>the</strong> climactic eruption<br />
<strong>of</strong> Mt. Mazama that formed Crater Lake, <strong>and</strong> debris avalanche deposits <strong>of</strong> <strong>the</strong> Shasta River Valley. Air<br />
fall deposits are highly permeable. Pyroclastic flows <strong>and</strong> debris deposits may have low permeability.<br />
Basaltic <strong>and</strong> <strong>and</strong>esitic lavas <strong>and</strong> vent deposits occurring in <strong>the</strong> Cascade Range <strong>and</strong> around Medicine Lake<br />
Volcano. These materials are generally highly permeable, but may not be saturated at high elevations.<br />
Fine- to coarse-grained unconsolidated to moderately indurated sedimentary deposits. The hydraulic<br />
characteristics <strong>of</strong> this unit are not well known but lithologic descriptions on maps suggest it may be<br />
moderately permeable at some locations. This unit has very limited distribution.<br />
Predominately fine-grained continental sedimentary deposits including bedded diatomite, mudstone,<br />
siltstone, <strong>and</strong> s<strong>and</strong>stone. This unit has generally low permeability but contains permeable strata at<br />
some locations.<br />
Palagonitized basaltic ash <strong>and</strong> lapilli deposits associated with eruptive centers. The hydrologic<br />
characteristics <strong>of</strong> this unit are not well known, but springs are known to emerge from basal contact<br />
with unit Ts. This unit is most prominent in <strong>the</strong> Sprague River valley.<br />
Predominantly basaltic <strong>and</strong> <strong>and</strong>esitic lava flows <strong>and</strong> vent deposits with lesser amounts <strong>of</strong> silicic domes<br />
<strong>and</strong> flows. This unit has moderate to high permeability <strong>and</strong> is by far <strong>the</strong> most widely developed aquifer<br />
unit in <strong>the</strong> study area. Permeability is locally diminished by hydro<strong>the</strong>rmal alteration <strong>and</strong> secondary<br />
mineralization.<br />
Miocene <strong>and</strong> older volcanic <strong>and</strong> volcaniclastic deposits. The permeability <strong>of</strong> this unit is generally low<br />
due to wea<strong>the</strong>ring, hydro<strong>the</strong>rmal alteration, <strong>and</strong> secondary mineralization. This unit is generally<br />
considered a boundary to <strong>the</strong> regional ground-water system <strong>of</strong> <strong>the</strong> upper <strong>Klamath</strong> <strong>Basin</strong>.<br />
Effects <strong>of</strong> Geologic Structure<br />
Geologic structures, principally faults <strong>and</strong> fault zones,<br />
can influence ground-water flow. Fault zones can act as ei<strong>the</strong>r<br />
barriers to or conduits for ground-water flow, depending on<br />
<strong>the</strong> material in <strong>and</strong> between <strong>the</strong> individual fault planes. Faults<br />
most commonly affect ground-water flow by juxtaposing rocks<br />
<strong>of</strong> contrasting permeability or by affecting <strong>the</strong> patterns <strong>of</strong><br />
deposition. Structural basins caused by normal faulting, called<br />
grabens, can act as depositional centers for large thicknesses<br />
<strong>of</strong> sediment or lava that may influence regional ground-water<br />
flow. Faults do not always influence ground-water flow; <strong>the</strong>re<br />
are regions in <strong>the</strong> upper <strong>Klamath</strong> <strong>Basin</strong> where ground-water<br />
flow appears unaffected by <strong>the</strong> presence <strong>of</strong> faults.<br />
The area <strong>of</strong> <strong>the</strong> upper <strong>Klamath</strong> <strong>Basin</strong> lying east <strong>of</strong><br />
<strong>the</strong> Cascade Range is a composite graben that forms <strong>the</strong><br />
westernmost structural trough <strong>of</strong> <strong>the</strong> <strong>Basin</strong> <strong>and</strong> Range<br />
physiographic province (Sherrod <strong>and</strong> Pickthorn, 1992). The<br />
predominant fault direction is north-northwest, as shown in<br />
figure 4. According to Sherrod <strong>and</strong> Pickthorn (1992), <strong>of</strong>fset<br />
across <strong>the</strong> faults range from less than 300 ft in <strong>the</strong> central<br />
<strong>and</strong> eastern parts <strong>of</strong> <strong>the</strong> graben to about 6,000 ft on faults<br />
southwest <strong>of</strong> <strong>Klamath</strong> Falls.<br />
Hydraulic Characteristics <strong>of</strong> Regional<br />
Hydrogeologic Units<br />
Geologic materials possess certain hydraulic<br />
characteristics that control <strong>the</strong> movement <strong>and</strong> storage <strong>of</strong><br />
ground water. This section describes <strong>the</strong> basic parameters<br />
used to characterize aquifer hydraulic properties <strong>and</strong> presents<br />
estimates or ranges <strong>of</strong> values <strong>of</strong> those terms for some <strong>of</strong><br />
<strong>the</strong> major geologic units in <strong>the</strong> upper <strong>Klamath</strong> <strong>Basin</strong>. A<br />
more thorough discussion <strong>of</strong> <strong>the</strong> terms used to describe <strong>the</strong><br />
hydraulic characteristics <strong>of</strong> aquifers <strong>and</strong> aquifer materials can<br />
be found in any basic ground-water hydrology text such as<br />
Freeze <strong>and</strong> Cherry (1979), Fetter (1980), or Heath (1983).<br />
The term “permeability” was introduced previously as<br />
a measure <strong>of</strong> <strong>the</strong> ease with which fluid can move through a<br />
particular rock type or deposit. Permeability is an intrinsic<br />
property <strong>of</strong> <strong>the</strong> rock type, <strong>and</strong> is independent <strong>of</strong> <strong>the</strong> fluid<br />
properties. In ground-water studies, <strong>the</strong> term “hydraulic<br />
conductivity” is used more commonly than “permeability” in<br />
quantitative discussions. The hydraulic conductivity includes<br />
both <strong>the</strong> properties <strong>of</strong> <strong>the</strong> rock (<strong>the</strong> intrinsic permeability)<br />
<strong>and</strong> <strong>the</strong> properties <strong>of</strong> <strong>the</strong> water, such as viscosity <strong>and</strong> density.
Geologic Framework 13<br />
Hydraulic conductivity is generally defined as <strong>the</strong> volume <strong>of</strong><br />
water per unit time that will pass through a unit area <strong>of</strong> an<br />
aquifer material in response to a unit hydraulic head gradient.<br />
Hydraulic conductivity has <strong>the</strong> units <strong>of</strong> volume per unit time<br />
(such as cubic feet per day) per unit area (such as square feet),<br />
which simplifies by division to length per unit time (such<br />
as feet per day). Hydraulic conductivity values for aquifer<br />
materials commonly span several orders <strong>of</strong> magnitude from<br />
less than 0.1 ft/d for fine s<strong>and</strong> <strong>and</strong> silt to over 1,000 ft/d for<br />
well-sorted s<strong>and</strong> <strong>and</strong> gravel.<br />
When discussing aquifers instead <strong>of</strong> rock types,<br />
<strong>the</strong> hydraulic conductivity is multiplied by <strong>the</strong> aquifer<br />
thickness resulting in a parameter known as “transmissivity.”<br />
Transmissivity is defined as <strong>the</strong> volume <strong>of</strong> water per unit time<br />
that will flow through a unit width <strong>of</strong> an aquifer perpendicular<br />
to <strong>the</strong> flow direction in response to a unit hydraulic head<br />
gradient. Transmissivity has units <strong>of</strong> volume per unit time<br />
(such as cubic feet per day) per unit aquifer width (such as<br />
feet), which simplifies to length squared per unit time (such as<br />
feet squared per day [ft 2 /d]).<br />
Storage characteristics <strong>of</strong> an aquifer are described by<br />
a parameter known as <strong>the</strong> “storage coefficient.” The storage<br />
coefficient is defined as <strong>the</strong> volume <strong>of</strong> water an aquifer<br />
releases from, or takes into, storage per unit area <strong>of</strong> aquifer per<br />
unit change in head. The volume <strong>of</strong> water has units <strong>of</strong> length<br />
cubed (such as cubic feet), <strong>the</strong> area has units <strong>of</strong> length squared<br />
(such as square feet), <strong>and</strong> <strong>the</strong> head change has units <strong>of</strong> length<br />
(such as feet). Thus, <strong>the</strong> storage coefficient is dimensionless.<br />
Storage coefficients typically span several orders <strong>of</strong> magnitude<br />
from 10 -4 for aquifers with overlying confining units, to 0.1<br />
for unconfined aquifers. Storage coefficients commonly fall<br />
between <strong>the</strong>se two end members because aquifers <strong>of</strong>ten have<br />
varying degrees <strong>of</strong> confinement. Note that characterizing<br />
an aquifer as “confined” does not imply that it is not<br />
hydraulically connected to o<strong>the</strong>r aquifers or to surface water.<br />
The terms “confined” <strong>and</strong> “unconfined” describe <strong>the</strong> physics<br />
<strong>of</strong> <strong>the</strong> aquifer response to pumping at a particular location.<br />
The hydraulic characteristics <strong>of</strong> subsurface materials<br />
are typically determined by conducting aquifer tests. An<br />
aquifer test consists <strong>of</strong> pumping a well at a constant rate <strong>and</strong><br />
measuring <strong>the</strong> change in water level (<strong>the</strong> drawdown) with time<br />
in <strong>the</strong> pumping well <strong>and</strong> nearby non-pumping wells. The data<br />
collected allow generation <strong>of</strong> a curve showing <strong>the</strong> drawdown<br />
as a function <strong>of</strong> time. Similar data are collected after <strong>the</strong><br />
pumping is stopped, allowing generation <strong>of</strong> a curve showing<br />
<strong>the</strong> water-level recovery as a function <strong>of</strong> time. Analysis <strong>of</strong><br />
<strong>the</strong> drawdown <strong>and</strong> recovery curves in <strong>the</strong> pumped well <strong>and</strong><br />
observation wells provides estimates <strong>of</strong> <strong>the</strong> transmissivity<br />
<strong>and</strong> storage coefficient <strong>of</strong> <strong>the</strong> aquifer. Aquifer characteristics<br />
also can be estimated from certain well-yield tests called<br />
“specific-capacity tests,” sometimes conducted by drillers.<br />
Data from specific capacity tests that include a pumping rate,<br />
test duration, drawdown at <strong>the</strong> end <strong>of</strong> <strong>the</strong> test, <strong>and</strong> <strong>the</strong> well<br />
diameter can be used to estimate aquifer transmissivity.<br />
Aquifer Tests<br />
The results <strong>of</strong> 32 aquifer tests conducted in <strong>the</strong> upper<br />
<strong>Klamath</strong> <strong>Basin</strong> are summarized in table 2. The tests were<br />
conducted by <strong>the</strong> OWRD, <strong>the</strong> California Department <strong>of</strong> <strong>Water</strong><br />
Resources (CDWR), private consultants, <strong>and</strong> <strong>the</strong> USGS.<br />
Pumping periods for <strong>the</strong> tests ranged from 12 hr (hours)<br />
to 169 days, with most lasting 24 to 72 hr. All tests were<br />
conducted on wells with large yields ranging from about<br />
1,000 to 10,000 gal/min. Most tests are <strong>of</strong> wells that produce<br />
from Tertiary volcanic deposits (unit Tv on fig. 4) because it<br />
is <strong>the</strong> most productive <strong>and</strong> widespread water bearing unit. A<br />
smaller number <strong>of</strong> tests were <strong>of</strong> wells producing from Tertiary<br />
sedimentary deposits (unit Ts on fig. 4) or a mixture <strong>of</strong> Ts <strong>and</strong><br />
Tv. It should be noted that <strong>the</strong> Tertiary sediments are very fine<br />
grained over most <strong>of</strong> <strong>the</strong> basin, <strong>and</strong> that wells producing large<br />
yields from that unit occur only in specific locations.<br />
Data <strong>and</strong> details <strong>of</strong> <strong>the</strong> analyses for most <strong>of</strong> <strong>the</strong> tests<br />
are available from sources listed in table 2. Reanalysis <strong>of</strong> <strong>the</strong><br />
aquifer tests listed in table 2 was beyond <strong>the</strong> scope <strong>of</strong> this<br />
study. For <strong>the</strong> most part, <strong>the</strong> results presented are directly from<br />
<strong>the</strong> source documents, except that values have been rounded<br />
to two significant figures. In some cases, as noted in table 2,<br />
results from certain observation wells or certain analyses that<br />
were considered problematic were not included. For example,<br />
anomalous results from observation wells that were open to<br />
different water-bearing zones or constructed differently from<br />
<strong>the</strong> pumped well were excluded. Results from pumped wells<br />
were excluded where well loss (excessive drawdown due to<br />
well inefficiency) appeared to affect <strong>the</strong> results.<br />
Most aquifer tests show evidence <strong>of</strong> boundaries,<br />
complicated aquifer geometry, or possible double-porosity<br />
conditions where flow occurs in fractures <strong>and</strong> in <strong>the</strong> blocks<br />
between fractures. Many tests in Butte Valley <strong>and</strong> <strong>the</strong> Tule<br />
Lake, Lower <strong>Klamath</strong> Lake, Sprague River, <strong>and</strong> upper Lost<br />
River subbasins showed inflections in drawdown curves,<br />
suggesting <strong>the</strong> presence <strong>of</strong> no-flow boundaries. These no-flow<br />
boundaries were in some cases associated with faults. Such<br />
boundaries indicate that <strong>the</strong> Tertiary volcanic aquifer system<br />
is, at least locally, somewhat compartmentalized, with some<br />
resistance to flow between individual subregions. Some tests<br />
showed evidence <strong>of</strong> recharge boundaries. Recharge boundaries<br />
usually indicate that <strong>the</strong> cone <strong>of</strong> depression has exp<strong>and</strong>ed<br />
to an extent where it has intersected a source <strong>of</strong> recharge,<br />
for example a stream or canal. Given <strong>the</strong> stratigraphy <strong>of</strong> <strong>the</strong><br />
areas tested, <strong>the</strong> pumping more likely was inducing flow<br />
from <strong>the</strong> overlying low-permeability sediments. Tests that<br />
showed evidence <strong>of</strong> recharge boundaries or leaking confining<br />
layers occurred in <strong>the</strong> Lower <strong>Klamath</strong> Lake <strong>and</strong> Lost River<br />
subbasins. Inflections in drawdown curves can also be caused<br />
by double porosity conditions (Moench, 1984; Weeks, 2005).
14 <strong>Ground</strong>-<strong>Water</strong> <strong>Hydrology</strong> <strong>of</strong> <strong>the</strong> <strong>Upper</strong> <strong>Klamath</strong> <strong>Basin</strong>, <strong>Oregon</strong> <strong>and</strong> California<br />
Table 2. Summary <strong>of</strong> selected aquifer tests, upper <strong>Klamath</strong> <strong>Basin</strong>, <strong>Oregon</strong> <strong>and</strong> California.<br />
[SWL, datum <strong>and</strong> date not always available. Static level listed to provide information on saturated thickness open to well. Open interval, may be a composite <strong>of</strong> multiple open intervals. Aquifer unit, Aquifer<br />
unit descriptions in figure 4. Observation wells, includes only number <strong>of</strong> observation wells used in analysis. Transmissivity, Reported values rounded to two significant figures. Abbreviations: SWL, static<br />
water level; gal/min, gallons per minute; gpd/ft, gallons per day per foot; ft 2 /d, feet squared per day; (?), aquifer unit unclear; >, greater than; NA, not available]<br />
Well or test name Well ID Location Area Depth SWL (feet) Open interval Aquifer unit<br />
Discharge<br />
(gal/min)<br />
Test length<br />
(hours)<br />
Drawdown<br />
(feet)<br />
Hill KLAM 2021 36S/11E-35DCC Sprague River subbasin 384 37.16 120–384 Ts 2,378 24 65.06<br />
Vieira KLAM 1962 36S/11E-14DBC Sprague River subbasin 361 -1.22 100.5–361 Tv/Ts 1,455 79 21.95<br />
OIT KLAM 10390 38S/9E-20BAD <strong>Klamath</strong> Falls 1,675 238.6 946–1,675 Ts/Tv(?) 900 48 3.5<br />
City <strong>of</strong> <strong>Klamath</strong> Falls KLAM 12050 38S/9E-28DCB <strong>Klamath</strong> Falls 900 64 190–900 Ts 720 499 10<br />
Angel KLAM 12380 38S/11.5E-2DCB Yonna Valley 583 69.63 31–583 Tv 1,700 24 5<br />
Bonanza KLAM 13427 39S/11E-20AAD Bonanza 567 66.19 20–567 Tv 938 12 55.13<br />
Wright KLAM 13578 39S/12E-31ADD Bonanza 292 15 20–292 Tv 1,430 40 NA<br />
Liston KLAM 13583 39S/12E-32CDB Bonanza 245 43.72 39–245 Tv 940 41 NA<br />
Babson KLAM 51920 39S/12E-10ACA Bonanza >2,056 21 500–>2,056 Tv 6,800 722 274<br />
S. Langell Valley KLAM 10495 40S/13E-35DAA Langell Valley 287 8.47 269–287 Tv 2,034 24 8.32<br />
Lorella KLAM 10175 39S/12E-35AAB Lorella 465 98 171–465 Tv 1,404 24 NA<br />
Poe Valley KLAM 10292 39S/11.5E-26DBA South Poe Valley 292 44.28 39–292 Tv 3,338 24 38.45<br />
Malin KLAM 14821 40S/12E-28DCB Malin 647 202.85 19–647 Tv/Ts 975 12 13.3<br />
Silbernagel/Dark KLAM 10454 40S/12E-32BCB North <strong>of</strong> Malin 629 140 41–629 Tv 1,416 70.5 >16<br />
McVay KLAM 51062 40S/12E-32DCB North <strong>of</strong> Malin 455 142 19–455 Tv 1,290 4,056 17<br />
CDFG 7A CDWR 421225 47N/2W-27BAA Butte Valley 601 21.41 160–610 Tv 2,800 244.5 16<br />
USFWS 12-A Prod. NA 47N/3E17DDD Lower <strong>Klamath</strong> Lake 1,254 28.1 400–1,254 Ts 3,000 48 190.7<br />
USFWS 9-A NA 47N/3E-16BDC Lower <strong>Klamath</strong> Lake 600 23.1 410–600 Tv 6,200 48 23.4<br />
USFWS 9-C NA 47N/3E-16ABA Lower <strong>Klamath</strong> Lake 802 28.7 516–802 Tv/Ts 7,300 26 27.4<br />
USFWS Otey Isl<strong>and</strong> NA 48N/1E-23B Lower <strong>Klamath</strong> Lake 334 26.3 142–334 Tb 6,000 36 17.6<br />
USFWS Otey Isl<strong>and</strong> NA 48N/1E-23B Lower <strong>Klamath</strong> Lake 625 5.3 142–625 Tv 4,000 72 23<br />
USFWS Stearns NA 48N/3E-20BAD Lower <strong>Klamath</strong> Lake 1,478 72.4 300–1,478 Tv 2,500 72 127<br />
TID-1 CDWR 751108 48N/4E-30F02 Tule Lake subbasin 740 19.91 260–700 Tv 9,000 50 11.37<br />
TID-2 CDWR 751109 48N/4E-18J01 Tule Lake subbasin 1,550 34.22 1,260–1,540 Tv 10,500 21 67.65<br />
TID-3 CDWR 751110 48N/4E-16M01 Tule Lake subbasin 1,710 42.17 1,153–1,681 Tv 8,000 33 98.52<br />
TID-4 CDWR 751111 48N/4E-15K01 Tule Lake subbasin 1,440 27.77 1,212–1,433 Tv 9,500 48 82.52<br />
TID-5 CDWR 751112 48N/4E-13K01 Tule Lake subbasin 1,570 29.64 935.2–1,557 Tv 10,500 74 96.94<br />
TID-6 CDWR 751113 48N/5E-16P01 Tule Lake subbasin 2,600 33.85 823–2,358 Tv 4,000 59 92.74<br />
TID-7 CDWR 751114 48N/5E-14R01 Tule Lake subbasin 2,030 50.92 814.3–2,020 Tv 5,000 52 264.59<br />
TID-8 CDWR 751115 48N/5E-26D01 Tule Lake subbasin 1,810 32.32 1,250–1,802 Tv 3,935 27 264.59<br />
TID-9 CDWR 751116 48N/5E-36D01 Tule Lake subbasin 2,060 34.66 1,061–2,023 Tv 6,600 16 173.57<br />
TID-14 CDWR 751117 46N/5E-22D01 Tule Lake subbasin 571 21.4 114–554 Tv 9,500 48 24.43
Geologic Framework 15<br />
Table 2. Summary <strong>of</strong> selected aquifer tests, upper <strong>Klamath</strong> <strong>Basin</strong>, <strong>Oregon</strong> <strong>and</strong> California—Continued.<br />
[SWL, datum <strong>and</strong> date not always available. Static level listed to provide information on saturated thickness open to well. Open interval, may be a composite <strong>of</strong> multiple open intervals. Aquifer unit, Aquifer<br />
unit descriptions in figure 4. Observation wells, includes only number <strong>of</strong> observation wells used in analysis. Transmissivity, Reported values rounded to two significant figures. Abbreviations: SWL, static<br />
water level; gal/min, gallons per minute; gpd/ft, gallons per day per foot; ft 2 /d, feet squared per day; (?), aquifer unit unclear; >, greater than; NA, not available]<br />
Well or test name Well ID<br />
Observation<br />
wells<br />
Transmissivity<br />
(gpd/ft)<br />
Transmissivity (ft 2 /d) Storativity Remarks Source<br />
Hill KLAM 2021 1 190,000–530,000 25,000–71,000 0.002–0.0057 Almy, 1977<br />
Vieira KLAM 1962 5 180,000–560,000 24,000–75,000 0.00026–0.0033 Forcella, 1982<br />
OIT KLAM 10390 5 100,000–280,000 13,000–37,000 0.015–0.00034 1 William E. Nork, Inc, 1992<br />
City <strong>of</strong> <strong>Klamath</strong> Falls KLAM 12050 15 28,000 3,800 0.002 2 Benson <strong>and</strong> o<strong>the</strong>rs, 1984a, 1984b<br />
Angel KLAM 12380 0 2,000,000 270,000 NA Leonard <strong>and</strong> Harris, 1974<br />
Bonanza KLAM 13427 1 140,000–180,000 19,000–24,000 0.000 CH2M Hill, 1992<br />
Wright KLAM 13578 3 130,000 17,000 NA CH2M Hill, 1994<br />
Liston KLAM 13583 1 20,000–91,000 2,700–12,000 NA CH2M Hill, 1994<br />
Babson KLAM 51920 0 480,000–620,000 64,000–83,000 NA CH2M Hill, 2002<br />
S. Langell Valley KLAM 10495 2 4,500,000 600,000 0.000 Grondin, 2004<br />
Lorella KLAM 10175 1 370,000 50,000 0.000 Grondin, 2004<br />
Poe Valley KLAM 10292 1 1,100,000 150,000 0.000 Grondin, 2004<br />
Malin KLAM 14821 0 190,000 25,000 NA CH2M Hill, 1992<br />
Silbernagel/Dark KLAM 10454 2 120,000–200,000 16,000–27,000 0.0003–0.01 Gates, 2001<br />
McVay KLAM 51062 4 200,000 27,000 0.001 Zwart <strong>and</strong> Gates, 2002<br />
CDFG 7A CDWR 421225 7 2,200,000–4,600,000 300,000–610,000 0.001–0.002 California Department <strong>of</strong> <strong>Water</strong><br />
Resources, 1998<br />
USFWS 12-A Prod. NA 1 2,200,000–2,600,000 300,000–350,000 0.00005–0.0001 3 Golder Associates, Inc., 2002<br />
USFWS 9-A NA 1 180,000–440,000 24,000–59,000 0.04 4 Golder Associates, Inc., 2002<br />
USFWS 9-C NA 1 820,000 110,000 0.000 5 Golder Associates, Inc., 2002<br />
USFWS Otey Isl<strong>and</strong> NA 0 3,100,000 420,000 NA 6 Golder Associates, Inc., 2002<br />
USFWS Otey Isl<strong>and</strong> NA 1 3,700,000 500,000 NA WESCORP, 2003<br />
USFWS Stearns NA 0 58,000 7,700 NA 7 WESCORP, 2003<br />
TID-1 CDWR 751108 1 650,000–1,200,000 87,000–160,000 0.15 Eaves <strong>and</strong> o<strong>the</strong>rs, 2002<br />
TID-2 CDWR 751109 1 1,300,000–3,100,000 170,000–410,000 0.001 Eaves <strong>and</strong> o<strong>the</strong>rs, 2002<br />
TID-3 CDWR 751110 0 2,300,000 310,000 NA Eaves <strong>and</strong> o<strong>the</strong>rs, 2002<br />
TID-4 CDWR 751111 0 1,100,000 150,000 NA Eaves <strong>and</strong> o<strong>the</strong>rs, 2002<br />
TID-5 CDWR 751112 1 2,000,000 270,000 0.002 Eaves <strong>and</strong> o<strong>the</strong>rs, 2002<br />
TID-6 CDWR 751113 2 120,000–190,000 16,000–25,000 0.00006–0.00012 Eaves <strong>and</strong> o<strong>the</strong>rs, 2002<br />
TID-7 CDWR 751114 0 51,000 6,800 NA Eaves <strong>and</strong> o<strong>the</strong>rs, 2002<br />
TID-8 CDWR 751115 2 1,700,000–1,900,000 230,000–250,000 0.00001–0.00052 8 Eaves <strong>and</strong> o<strong>the</strong>rs, 2002<br />
TID-9 CDWR 751116 1 700,000–2,900,000 94,000–390,000 0.000 9 Eaves <strong>and</strong> o<strong>the</strong>rs, 2002<br />
TID-14 CDWR 751117 0 2,600,000 350,000 NA Eaves <strong>and</strong> o<strong>the</strong>rs, 2002<br />
Remarks:<br />
1. Results <strong>of</strong> one observation well not included because <strong>of</strong> possible effects <strong>of</strong> upper <strong>Klamath</strong> Lake.<br />
2. 15 observation wells explicitly discussed in report, additional wells used in anaysis, 52 wells were monitored.<br />
Transmissivity value assumes 1,000-foot aquifer thickness. Geo<strong>the</strong>rmal aquifer.<br />
3. Results from one observation well (9A) not included here because <strong>of</strong> differences in well construction <strong>and</strong> depth.<br />
4. Results from one observation well (9C) not included here because <strong>of</strong> differences in well construction <strong>and</strong> depth.<br />
5. Only results from one observation well (9C) included here.<br />
6. Only results <strong>of</strong> drawdown analysis included here.<br />
7. Only results from production well included here.<br />
8. Only results from observation wells presented here.<br />
9. Large range may result from inefficiency <strong>of</strong> production well.
16 <strong>Ground</strong>-<strong>Water</strong> <strong>Hydrology</strong> <strong>of</strong> <strong>the</strong> <strong>Upper</strong> <strong>Klamath</strong> <strong>Basin</strong>, <strong>Oregon</strong> <strong>and</strong> California<br />
Aquifer tests show that <strong>the</strong> transmissivity <strong>of</strong> <strong>the</strong> Tertiary<br />
volcanics (predominantly basaltic lavas) varies widely,<br />
from 2,700 to 610,000 ft 2 /d, with most (<strong>the</strong> middle 50<br />
percent) ranging from 24,000 to 270,000 ft 2 /d. The average<br />
transmissivity is about 170,000 ft 2 /d <strong>and</strong> <strong>the</strong> median is about<br />
90,000 ft 2 /d. Reported storage coefficients from aquifer tests<br />
in <strong>the</strong> Tertiary volcanics range from 0.00001 to 0.15. The 0.15<br />
figure is anomalous <strong>and</strong> likely due to a partially penetrating<br />
observation well <strong>and</strong> leakage from <strong>the</strong> confining layer. The<br />
middle 50 percent <strong>of</strong> <strong>the</strong> calculated storage coefficients in <strong>the</strong><br />
Tertiary volcanics range from 0.00025 to 0.001. The average<br />
value is 0.0012 <strong>and</strong> <strong>the</strong> median is about 0.0005.<br />
Although <strong>the</strong> number <strong>of</strong> aquifer tests in Tertiary<br />
sediments (or mixtures <strong>of</strong> <strong>the</strong> sediments <strong>and</strong> Tertiary lavas)<br />
is small (n=6, not including <strong>the</strong> geo<strong>the</strong>rmal aquifer test), <strong>the</strong>y<br />
provided information on <strong>the</strong> hydraulic characteristics <strong>of</strong> <strong>the</strong><br />
coarse-grained facies <strong>of</strong> unit Ts. Transmissivity values range<br />
from 13,000 to 350,000 ft 2 /d, with most in <strong>the</strong> 25,000 to<br />
75,000 ft 2 /d range. The average value is about 100,000 ft 2 /d<br />
<strong>and</strong> <strong>the</strong> median is 54,000 ft 2 /d. Storage coefficients range<br />
from 0.0005 to 0.015 with most ranging from about 0.0002 to<br />
0.003. Note that most Tertiary sedimentary rock in <strong>the</strong> basin<br />
consists <strong>of</strong> fine-grained lake deposits <strong>and</strong> has much lower<br />
transmissivity than determined from <strong>the</strong> tests discussed here.<br />
In <strong>the</strong> early 1980s, <strong>the</strong> USGS conducted an aquifer test <strong>of</strong><br />
<strong>the</strong> geo<strong>the</strong>rmal aquifer in <strong>Klamath</strong> Falls in collaboration with<br />
<strong>the</strong> Lawrence Berkeley Laboratory <strong>and</strong> <strong>the</strong> City <strong>of</strong> <strong>Klamath</strong><br />
Falls (Benson <strong>and</strong> o<strong>the</strong>rs, 1984a, b). The test consisted <strong>of</strong> four<br />
phases: a 1-week pre-test phase during which background<br />
water levels were monitored; a 21-day pumping phase during<br />
which a geo<strong>the</strong>rmal well (38S/09E-28DCB, KLAM 12050;<br />
table 2) was pumped at about 720 gal/min <strong>and</strong> <strong>the</strong> water<br />
discharged to an irrigation canal; a 30 day injection phase<br />
during which pumping continued (at about 660–695 gal/min)<br />
<strong>and</strong> <strong>the</strong> water injected into a second well (38S/09E-28DDD,<br />
KLAM 11940); <strong>and</strong> a 1-week recovery phase. Benson <strong>and</strong><br />
o<strong>the</strong>rs (1984a) analyzed <strong>the</strong> data from <strong>the</strong> test <strong>and</strong> calculated<br />
a permeability-thickness value (analagous to a transmissivity)<br />
<strong>of</strong> about 1.4 X 10 6 millidarcy-feet. This converts to a<br />
transmissivity <strong>of</strong> about 3,800 ft 2 /d. Analysis <strong>of</strong> <strong>the</strong> test<br />
indicated a storage coefficient <strong>of</strong> about 0.002.<br />
Results <strong>of</strong> <strong>the</strong> geo<strong>the</strong>rmal aquifer test are generally<br />
consistent with <strong>the</strong> o<strong>the</strong>r aquifer tests in table 2. The<br />
transmissivity value is at <strong>the</strong> lower end <strong>of</strong> <strong>the</strong> range <strong>of</strong> o<strong>the</strong>r<br />
tests, but this is not unexpected as <strong>the</strong> aquifer system pumped<br />
consists <strong>of</strong> interlayered lava <strong>and</strong> fine-grained sedimentary rock<br />
(unit Ts). A notable finding <strong>of</strong> this test is <strong>the</strong> apparent lack <strong>of</strong><br />
boundaries encountered in an area crossed by several major<br />
basin-bounding faults. This is not, however, inconsistent with<br />
o<strong>the</strong>r hydrologic data that suggest ground water moves freely<br />
across similar faults at many locations.<br />
Well-Yield Tests<br />
Ano<strong>the</strong>r source <strong>of</strong> information on subsurface hydraulic<br />
characteristics are <strong>the</strong> well-yield tests conducted by drillers<br />
<strong>and</strong> reported on <strong>the</strong> well logs submitted on completion<br />
<strong>of</strong> all new wells. Well-yield tests typically consist <strong>of</strong> a<br />
single drawdown measurement taken after a well has been<br />
pumped at a specified rate for a specified length <strong>of</strong> time,<br />
typically 1 hr. Well-yield tests allow determination <strong>of</strong> a<br />
well’s specific capacity, which can be used to estimate<br />
transmissivity as described previously. Specific capacity<br />
is only a semiquantitative measure <strong>of</strong> well performance in<br />
that it can vary with pumping rate. Specific-capacity values<br />
can be used to calculate only rough estimates <strong>of</strong> <strong>the</strong> aquifer<br />
transmissivity <strong>and</strong> cannot be used to quantitatively derive<br />
aquifer storage characteristics. Although transmissivity values<br />
calculated from specific capacity tests are only approximate,<br />
<strong>the</strong>y can be used to evaluate <strong>the</strong> relative differences in<br />
hydraulic characteristics between different geographic areas<br />
<strong>and</strong> different hydrogeologic units if data are available from a<br />
sufficient number <strong>of</strong> wells.<br />
Specific-capacity data were analyzed from wells that<br />
were field inventoried for this study. Of <strong>the</strong> over 1,000 wells<br />
inventoried, only about 288 had sufficient information for<br />
analysis on <strong>the</strong>ir State water well reports. Transmissivity<br />
values were estimated from specific-capacity data using <strong>the</strong><br />
Theis nonequilibrium equation (Theis, 1935). The wells<br />
analyzed were sorted by hydrogeologic units for comparison.<br />
Most wells analyzed produced from one <strong>of</strong> three units:<br />
Quaternary sedimentary deposits (Qs) (n = 41), Tertiary<br />
sedimentary rocks (Ts) (n = 48), <strong>and</strong> late Tertiary volcanic<br />
deposits (Tv) (n = 173). O<strong>the</strong>r units had too few tests for<br />
statistically meaningful comparisons. The cumulative<br />
frequencies <strong>of</strong> transmissivity estimates for <strong>the</strong> three major<br />
units are shown in figure 5. Wells producing from Quaternary<br />
sedimentary deposits <strong>and</strong> Tertiary sedimentary deposits<br />
have similar transmissivity distributions, with <strong>the</strong> former<br />
having slightly larger values. The median transmissivity<br />
for both units is about 200 ft 2 /d. The frequency distribution<br />
<strong>of</strong> transmissivities for <strong>the</strong> late Tertiary volcanic deposits is<br />
distinct from <strong>the</strong> o<strong>the</strong>r units, with values generally larger<br />
by more than an order <strong>of</strong> magnitude (fig. 5). The median<br />
transmissivity <strong>of</strong> Tertiary volcanic deposits is about<br />
5,800 ft 2 /d.<br />
The median transmissivity for late Tertiary volcanic<br />
deposits determined from specific-capacity tests (6,300 ft 2 /d)<br />
is lower than that calculated from aquifer tests (about<br />
90,000 ft 2 /d). This is not unexpected for <strong>the</strong> following reasons:<br />
First, transmissivity values determined from single-well tests<br />
can be biased downward by excess drawdown in <strong>the</strong> pumped<br />
well due to well inefficiency (see Driscoll, 1986, p. 244).
<strong>Ground</strong>-<strong>Water</strong> <strong>Hydrology</strong> 17<br />
100<br />
90<br />
80<br />
Qs, n = 41<br />
Ts, n = 48<br />
Tv, n = 173<br />
70<br />
PERCENTILE<br />
60<br />
50<br />
40<br />
30<br />
20<br />
10<br />
0<br />
0.1 1 10 100 1,000 10,000 100,000 1,000,000<br />
TRANSMISSIVITY, IN FEET SQUARED PER DAY<br />
Figure 5. Cumulative distribution <strong>of</strong> transmissivity values estimated from specific-capacity tests for wells producing<br />
from Quaternary sediment, Tertiary sedimentary rock, <strong>and</strong> Tertiary volcanic rock in <strong>the</strong> upper <strong>Klamath</strong> <strong>Basin</strong>, <strong>Oregon</strong><br />
<strong>and</strong> California.<br />
Aquifer tests with observation wells are not affected by this<br />
phenomenon. Second, <strong>the</strong> large number <strong>of</strong> specific-capacity<br />
tests (173) represent a more or less r<strong>and</strong>om sampling <strong>of</strong><br />
wells (<strong>and</strong> varying characteristics) in <strong>the</strong> unit. Aquifer tests,<br />
in contrast, are not r<strong>and</strong>om but tend to be conducted most<br />
commonly on high yielding wells for specific purposes.<br />
Regardless, transmissivity values calculated from both aquifer<br />
tests <strong>and</strong> specific-capacity tests are useful for underst<strong>and</strong>ing<br />
<strong>the</strong> hydraulic characteristics <strong>of</strong> hydrogeologic units <strong>and</strong> <strong>the</strong><br />
differences between units.<br />
<strong>Ground</strong>-<strong>Water</strong> <strong>Hydrology</strong><br />
<strong>Ground</strong> water moves from areas where it enters <strong>the</strong><br />
ground, known as “recharge areas,” to areas where it leaves<br />
<strong>the</strong> ground, known as “discharge areas.” On a regional scale,<br />
recharge areas are typically high-elevation regions with large<br />
amounts <strong>of</strong> precipitation compared to surrounding areas.<br />
<strong>Ground</strong> water moves from recharge areas toward low-elevation<br />
areas in response to gravity. In low-elevation areas, ground<br />
water typically discharges to streams, lakes, or wetl<strong>and</strong>s <strong>and</strong><br />
<strong>the</strong>n is returned to <strong>the</strong> atmosphere through evapotranspiration<br />
or leaves <strong>the</strong> basin as streamflow. <strong>Ground</strong> water can be<br />
removed anywhere along its flow path by wells.<br />
<strong>Ground</strong> water moves in response to differences in<br />
hydraulic head, from areas <strong>of</strong> high head to areas <strong>of</strong> low<br />
head. In unconfined aquifers—those without overlying lowpermeability<br />
strata—hydraulic head can be thought <strong>of</strong> as <strong>the</strong><br />
elevation <strong>of</strong> <strong>the</strong> water table. In confined aquifers, hydraulic<br />
head can be thought <strong>of</strong> as <strong>the</strong> elevation <strong>of</strong> <strong>the</strong> aquifer plus <strong>the</strong><br />
pressure <strong>of</strong> <strong>the</strong> confined ground water. Maps <strong>of</strong> hydraulic head<br />
are useful for identifying recharge <strong>and</strong> discharge areas, <strong>and</strong><br />
for indicating <strong>the</strong> direction <strong>of</strong> ground-water flow. Although<br />
<strong>the</strong> regional scale movement <strong>of</strong> ground water largely follows<br />
topography, <strong>the</strong> actual flow paths that <strong>the</strong> ground water<br />
follows <strong>and</strong> <strong>the</strong> rate <strong>of</strong> ground-water movement is controlled<br />
by <strong>the</strong> permeability <strong>of</strong> <strong>the</strong> geologic materials through which<br />
it flows. The rate <strong>of</strong> ground-water movement is proportional<br />
to <strong>the</strong> hydraulic head gradient <strong>and</strong> <strong>the</strong> permeability <strong>of</strong> <strong>the</strong><br />
geologic materials.<br />
<strong>Ground</strong>-water systems are dynamic, with rates <strong>of</strong><br />
recharge <strong>and</strong> discharge <strong>and</strong> hydraulic head varying in<br />
response to external stresses. The largest external influence on<br />
ground-water systems is climate. Drought cycles cause large<br />
fluctuations in recharge, ground-water levels, <strong>and</strong> discharge to<br />
springs <strong>and</strong> streams. Human-caused stresses, such as pumping<br />
<strong>and</strong> artifical recharge from canal leakage <strong>and</strong> deep percolation<br />
<strong>of</strong> irrigation water, also affect <strong>the</strong> ground-water system.<br />
OR19-0048_fig05
18 <strong>Ground</strong>-<strong>Water</strong> <strong>Hydrology</strong> <strong>of</strong> <strong>the</strong> <strong>Upper</strong> <strong>Klamath</strong> <strong>Basin</strong>, <strong>Oregon</strong> <strong>and</strong> California<br />
Hydrologic Budget<br />
The hydrologic budget is <strong>the</strong> accounting <strong>of</strong> water moving<br />
into <strong>and</strong> out <strong>of</strong> a hydrologic system such as <strong>the</strong> upper <strong>Klamath</strong><br />
<strong>Basin</strong>. A general hydrologic-budget equation is:<br />
PRECIP + SW in<br />
+ GW in<br />
= ET + SW out<br />
+ GW out<br />
+ ∆S, (1)<br />
Where<br />
PRECIP is precipitation,<br />
SW in<br />
is <strong>the</strong> inflow <strong>of</strong> surface water,<br />
GW in<br />
is <strong>the</strong> subsurface inflow <strong>of</strong> ground water,<br />
ET is total evapotranspiration,<br />
SW out<br />
is <strong>the</strong> out flow <strong>of</strong> surface water,<br />
GW out<br />
is <strong>the</strong> subsurface outflow <strong>of</strong> ground water, <strong>and</strong><br />
∆S is <strong>the</strong> change in water stored in <strong>the</strong> surface- <strong>and</strong><br />
ground-water systems.<br />
These individual terms may have multiple components.<br />
For example, ET includes <strong>the</strong> evapotranspiration from forests,<br />
wetl<strong>and</strong>s, <strong>and</strong> agricultural crops. In <strong>the</strong> upper <strong>Klamath</strong> <strong>Basin</strong>,<br />
<strong>the</strong> largest terms are PRECIP, ET, <strong>and</strong> SW out<br />
. There is no<br />
evidence <strong>of</strong> subsurface ground-water flow into <strong>the</strong> basin<br />
(GW in<br />
). <strong>Ground</strong>-water flow out (GW out<br />
) toward <strong>the</strong> south is<br />
probable, but <strong>the</strong> amount is likely to be miniscule compared<br />
to o<strong>the</strong>r terms in <strong>the</strong> equation. The storage term (∆S) includes<br />
both surface storage in reservoirs <strong>and</strong> subsurface storage<br />
<strong>of</strong> ground water in aquifers. When dealing with long-term,<br />
multiyear averages, changes in surface water storage are<br />
commonly negligible.<br />
Long-term changes in ground-water storage are manifest<br />
as year-to-year changes in <strong>the</strong> water-table elevation. Longterm<br />
observation well data indicate that a slight, climaterelated<br />
decline has taken place in water levels in wells in <strong>the</strong><br />
<strong>Klamath</strong> <strong>Basin</strong> since <strong>the</strong> 1950s. The magnitude <strong>of</strong> <strong>the</strong> decline<br />
varies spatially, but ranges from zero to about 10 ft over 50<br />
years. Larger declines have been measured near pumping<br />
centers, but are generally geographically restricted. The<br />
amount <strong>of</strong> water represented by <strong>the</strong> annual change in groundwater<br />
storage is small compared to <strong>the</strong> overall hydrologic<br />
budget. For example, assuming <strong>the</strong> change in storage occurred<br />
in <strong>the</strong> shallow, unconfined parts <strong>of</strong> <strong>the</strong> system <strong>and</strong> using<br />
a storage coefficient <strong>of</strong> 0.05 (a reasonable number for an<br />
unconfined volcanic aquifer), a decline <strong>of</strong> 5 ft in 50 years<br />
averaged over <strong>the</strong> entire 8,000 mi 2 upper <strong>Klamath</strong> <strong>Basin</strong><br />
equates to an annual change in storage <strong>of</strong> about 26,000 acre-ft.<br />
Some components <strong>of</strong> a hydrologic budget, such as<br />
streamflow, can be measured directly. O<strong>the</strong>r components,<br />
such as evapotranspiration, are impractical or impossible to<br />
measure directly at useful scales <strong>and</strong> must be estimated or<br />
inferred from o<strong>the</strong>r measurements. This section presents a very<br />
general discussion <strong>of</strong> <strong>the</strong> hydrologic budget <strong>of</strong> <strong>the</strong> entire upper<br />
<strong>Klamath</strong> <strong>Basin</strong> (summarized in table 3) to provide a context<br />
for a more detailed discussion <strong>of</strong> <strong>the</strong> hydrologic budget <strong>of</strong> <strong>the</strong><br />
ground-water system. All figures presented in this section have<br />
associated uncertainty.<br />
Data from <strong>the</strong> <strong>Oregon</strong> Climate Center PRISM Group<br />
(http://www.ocs.oregonstate.edu/prism/index.phtml, accessed<br />
September 20, 2006) indicates that precipitation in <strong>the</strong> upper<br />
<strong>Klamath</strong> <strong>Basin</strong> averages about 10 million acre-ft/yr (1971–<br />
2000 average). Of that amount, only about 1.5 million acreft/yr<br />
flows out <strong>of</strong> <strong>the</strong> basin past Iron Gate Dam (1961–2000<br />
average; 1971–2000 average is 1.6 million acre-ft/yr). Most <strong>of</strong><br />
<strong>the</strong> remaining 8.5 million acre-ft/yr returns to <strong>the</strong> atmosphere<br />
through evapotranspiration at <strong>the</strong> location where <strong>the</strong><br />
precipitation falls. Some <strong>of</strong> <strong>the</strong> 8.5 million acre-ft/yr, however,<br />
returns to <strong>the</strong> atmosphere elsewhere in <strong>the</strong> basin after it has<br />
moved through <strong>the</strong> hydrologic system. An example <strong>of</strong> <strong>the</strong><br />
latter case would be water diverted from streams or pumped<br />
from ground water that returns to <strong>the</strong> atmosphere through<br />
evapotranspiration from irrigated fields (this type <strong>of</strong> loss is<br />
<strong>of</strong>ten termed “consumptive use”). A small amount <strong>of</strong> water is<br />
exported from <strong>the</strong> basin. La Marche (2001) estimated water<br />
exports to <strong>the</strong> Rogue River <strong>Basin</strong> to average 0.027 million<br />
acre-ft/yr between 1960 <strong>and</strong> 1996<br />
Burt <strong>and</strong> Freeman (2003) estimated that<br />
evapotranspiration from agricultural fields in <strong>the</strong> <strong>Klamath</strong><br />
Project in 1999 <strong>and</strong> 2000 averaged 0.48 million acre-ft/yr<br />
(<strong>the</strong> 2001 estimates are not included here because <strong>of</strong> <strong>the</strong><br />
cut <strong>of</strong>f <strong>of</strong> irrigation water that year). Estimates by Cooper<br />
(2004) suggest that average annual agricultural consumptive<br />
use in <strong>the</strong> principal agricultural areas outside <strong>of</strong> <strong>the</strong> <strong>Klamath</strong><br />
Project in <strong>Oregon</strong> (including <strong>the</strong> Williamson, Sprague, <strong>and</strong><br />
Wood River subbasins) totals about 0.2 million acre-ft/yr.<br />
Consumptive use by ground-water irrigated agriculture outside<br />
<strong>of</strong> <strong>the</strong> <strong>Klamath</strong> Project in California (including areas in <strong>the</strong><br />
Tule Lake <strong>and</strong> Butte Valley subbasins) is estimated to be about<br />
0.072 million acre-ft/yr on <strong>the</strong> basis <strong>of</strong> data from <strong>the</strong> CDWR<br />
2000 l<strong>and</strong> use survey. Areas irrigated with surface water in<br />
California outside <strong>of</strong> <strong>the</strong> Project are small in comparison to<br />
ground-water irrigated areas <strong>and</strong> are not included in this total.<br />
There is also significant evapotranspiration from wetl<strong>and</strong>s<br />
<strong>and</strong> open water in <strong>the</strong> upper <strong>Klamath</strong> <strong>Basin</strong>. Hubbard (1970)<br />
estimated that evapotranspiration from open water <strong>and</strong> <strong>the</strong><br />
fringe wetl<strong>and</strong>s <strong>of</strong> <strong>Upper</strong> <strong>Klamath</strong> Lake averaged 0.29 million<br />
acre-ft/yr from 1965 to 1967. Risley <strong>and</strong> Gannett (2006)<br />
estimated that evapotranspiration from <strong>the</strong> Tule Lake <strong>and</strong><br />
Lower <strong>Klamath</strong> Lake refuges totaled about 0.22 million acreft/yr<br />
from 2003 to 2005. Average evapotranspiration in <strong>the</strong><br />
<strong>Klamath</strong> Marsh area was estimated to be about 0.17 million<br />
acre-ft/yr using <strong>the</strong> method <strong>of</strong> Priestly <strong>and</strong> Taylor (1972) (Tim<br />
Mayer, U.S. Fish <strong>and</strong> Wildlife Service, written commun.,<br />
2005). Burt <strong>and</strong> Freeman (2003) estimated evapotranspiration<br />
from o<strong>the</strong>r surfaces in <strong>the</strong> Project area, including open water<br />
outside <strong>of</strong> refuges, urban areas, <strong>and</strong> undeveloped l<strong>and</strong> to<br />
average about 0.082 million acre-ft/yr in 1999 <strong>and</strong> 2000.
<strong>Ground</strong>-<strong>Water</strong> <strong>Hydrology</strong> 19<br />
The source documents listed above all discuss uncertainty <strong>of</strong><br />
<strong>the</strong> evapotranspiration estimates in general terms. Bert <strong>and</strong><br />
Freeman (2003), however, provide a quantitative uncertainty<br />
assessment, <strong>and</strong> assign confidence intervals <strong>of</strong> plus or minus<br />
14 to 20 percent for <strong>the</strong> estimates discussed here. Although<br />
<strong>the</strong> above list <strong>of</strong> evapotranspiration losses, which totals 1.5<br />
million acre-ft/yr, is not exhaustive, it includes <strong>the</strong> bulk <strong>of</strong><br />
consumptive uses in <strong>the</strong> nonupl<strong>and</strong> parts <strong>of</strong> <strong>the</strong> basin. When<br />
this number is added to <strong>the</strong> streamflow out <strong>of</strong> <strong>the</strong> basin, about<br />
7 million acre-ft/yr <strong>of</strong> precipitation (about 70 percent <strong>of</strong> <strong>the</strong><br />
total precipitation) still leaves <strong>the</strong> basin through o<strong>the</strong>r avenues,<br />
principally as evapotranspiration to <strong>the</strong> atmosphere in upl<strong>and</strong><br />
areas.<br />
A substantial proportion <strong>of</strong> <strong>the</strong> roughly 3 million<br />
acre-ft/yr that leaves <strong>the</strong> basin through streamflow or<br />
evapotranspiration in nonupl<strong>and</strong> areas moves through <strong>the</strong><br />
regional ground-water system. Equation 1 describes flow into<br />
<strong>and</strong> out <strong>of</strong> <strong>the</strong> entire upper <strong>Klamath</strong> <strong>Basin</strong>. Most flow into <strong>and</strong><br />
out <strong>of</strong> <strong>the</strong> regional ground-water system occurs entirely within<br />
<strong>the</strong> basin. The hydrologic budget <strong>of</strong> <strong>the</strong> regional ground-water<br />
system can be described by <strong>the</strong> equation:<br />
RECH + GW in<br />
= GW dis<br />
+ GW out<br />
+ ∆S, (2)<br />
where<br />
RECH is ground-water recharge, <strong>and</strong><br />
GW dis<br />
is ground-water discharge.<br />
The largest terms in equation 2 are RECH <strong>and</strong> GW dis<br />
.<br />
Recharge (RECH) includes infiltration <strong>of</strong> precipitation,<br />
leakage from streams <strong>and</strong> canals, <strong>and</strong> deep percolation <strong>of</strong><br />
irrigation water. <strong>Ground</strong>-water discharge (GW dis<br />
) includes<br />
natural discharge <strong>of</strong> ground water to springs <strong>and</strong> streams,<br />
water consumed by plants with <strong>the</strong>ir roots extending to <strong>the</strong><br />
water table, <strong>and</strong> by pumping <strong>of</strong> wells. A schematic depiction<br />
<strong>of</strong> a ground-water flow system is shown in figure 6.<br />
Table 3.<br />
Estimates <strong>of</strong> major hydrologic budget elements <strong>of</strong> <strong>the</strong> upper <strong>Klamath</strong> <strong>Basin</strong>, <strong>Oregon</strong> <strong>and</strong> California.<br />
[ET, evapotranspiration; values in million acre feet per year; PRISM, Parameter-elevation Regressions on Independent Slopes Model (<strong>Oregon</strong> State University,<br />
PRISM Group, 2006); CDWR, California Department <strong>of</strong> <strong>Water</strong> Resources; USFWS, U.S. Fish <strong>and</strong> Wildlife Service; USGS, U.S. Geological Survey]<br />
Budget element Value Source <strong>and</strong> remarks<br />
Inflow<br />
Precipitation 10 1971–2000 average from PRISM<br />
Subsurface inflow unknown Assumed to be negligible<br />
Total inflow 10<br />
Outflow<br />
Subsurface outflow unknown Assumed to be negligible<br />
Surface outflow at Iron Gate Dam 1.5 1961–2004 annual average (USGS gage data)<br />
Net diversions to o<strong>the</strong>r basins .03 1960–1996 annual average from LaMarche (2001). Does not<br />
include diversion to City <strong>of</strong> Yreka from Fall Creek<br />
ET from agricultural l<strong>and</strong>s<br />
Bureau <strong>of</strong> Reclamation <strong>Klamath</strong> .48 1999 <strong>and</strong> 2000 average (Burt <strong>and</strong> Freeman, 2003)<br />
Non-Project l<strong>and</strong> in <strong>Oregon</strong> .20 Cooper (2004)<br />
Non-Project l<strong>and</strong> in California .07 Estimated from CDWR 2000 l<strong>and</strong>-use survey<br />
ET from major wetl<strong>and</strong>s<br />
Tule Lake <strong>and</strong> <strong>Klamath</strong> Refuge (not including open water) .22 2003–05 average (Risley <strong>and</strong> Gannett, 2006)<br />
<strong>Upper</strong> <strong>Klamath</strong> Lake fringe wetl<strong>and</strong>s .29 1965–67 average (Hubbard, 1970)<br />
<strong>Klamath</strong> Marsh .17 Estimated using <strong>the</strong> method <strong>of</strong> Priestly <strong>and</strong> Taylor (1972) (Tim<br />
Mayer, U.S. Fish <strong>and</strong> Wildlife Service, written commun.,<br />
2005)<br />
ET from nonagricultural areas within <strong>the</strong> <strong>Klamath</strong> Project .08 1999 <strong>and</strong> 2000 average (Burt <strong>and</strong> Freeman, 2003)<br />
Subtotal outflow 3.0<br />
Estimated ET from nonagricultural <strong>and</strong> upl<strong>and</strong> areas outside 7.0 Total inflow minus outflow subtotal<br />
<strong>the</strong> Project<br />
Total outflow 10
20 <strong>Ground</strong>-<strong>Water</strong> <strong>Hydrology</strong> <strong>of</strong> <strong>the</strong> <strong>Upper</strong> <strong>Klamath</strong> <strong>Basin</strong>, <strong>Oregon</strong> <strong>and</strong> California<br />
Recharge<br />
from<br />
precipitation<br />
<strong>Water</strong> table<br />
Discharge to stream<br />
(local flow system)<br />
Discharge to spring<br />
Discharge to subirrigation in<br />
areas <strong>of</strong> shallow ground water<br />
Discharge to wells<br />
Recharge from precipitation<br />
<strong>and</strong> deep percolation <strong>of</strong><br />
irrigation water<br />
Discharge to drains<br />
Recharge from<br />
canal leakage<br />
Recharge from<br />
precipitation<br />
Discharge to stream<br />
(regional flow system)<br />
Recharge from precipitation<br />
Intermediate<br />
flow system<br />
Local<br />
flow system<br />
Spring<br />
<strong>Basin</strong> filling sedments<br />
(Low permeability with<br />
some moderate permeability layers)<br />
Shallow local<br />
flow system<br />
<strong>Water</strong> table<br />
Fault<br />
Subsurface flow<br />
from adjacent basins (Recharge)<br />
Regional flow system<br />
Lava with moderate to high permeability<br />
Fault<br />
Fault<br />
Subsurface flow<br />
to adjacent basins<br />
(Discharge)<br />
NOT TO SCALE<br />
RECHARGE = DISCHARGE ± CHANGE IN AQUIFER STORAGE<br />
Figure 6. Schematic representation <strong>of</strong> sources <strong>of</strong> ground-water recharge, flow paths, <strong>and</strong> mechanisms <strong>of</strong> ground-water discharge in<br />
<strong>the</strong> upper <strong>Klamath</strong> <strong>Basin</strong>, <strong>Oregon</strong> <strong>and</strong> California.<br />
<strong>Ground</strong>-<strong>Water</strong> Recharge<br />
<strong>Ground</strong> water originates as precipitation. Recharge is<br />
generally greatest in upl<strong>and</strong> areas where <strong>the</strong> largest amount <strong>of</strong><br />
precipitation occurs. The principal recharge areas in <strong>the</strong> upper<br />
<strong>Klamath</strong> <strong>Basin</strong> are <strong>the</strong> Cascade Range <strong>and</strong> upl<strong>and</strong>s within <strong>and</strong><br />
on <strong>the</strong> eastern margin <strong>of</strong> <strong>the</strong> basin. Only a fraction <strong>of</strong> <strong>the</strong> water<br />
that falls as precipitation, however, makes it to <strong>the</strong> groundwater<br />
system. Most ei<strong>the</strong>r is returned to <strong>the</strong> atmosphere<br />
through evaporation from vegetative surfaces <strong>and</strong> transpiration<br />
by plants, or runs <strong>of</strong>f. In areas where soils <strong>and</strong> underlying<br />
bedrock have low permeability, infiltrating precipitation tends<br />
to flow to streams. Such areas typically have well developed<br />
stream networks. In areas where soils <strong>and</strong> underlying bedrock<br />
are highly permeable, for example <strong>the</strong> young volcanic<br />
l<strong>and</strong>scapes <strong>of</strong> <strong>the</strong> Cascade Range, water infiltrates more easily<br />
to <strong>the</strong> ground-water system. Young volcanic areas <strong>of</strong>ten have<br />
poorly developed stream networks as a result. <strong>Water</strong> that<br />
OR19-0048_fig06.ai<br />
percolates through <strong>the</strong> soil to a depth beneath <strong>the</strong> root zone<br />
potentially can become ground water.<br />
Although direct infiltration <strong>of</strong> precipitation is <strong>the</strong><br />
principal source <strong>of</strong> recharge in <strong>the</strong> upper <strong>Klamath</strong> <strong>Basin</strong>, <strong>the</strong>re<br />
are o<strong>the</strong>r sources. Stream leakage can be a source <strong>of</strong> groundwater<br />
recharge in areas where <strong>the</strong> elevation <strong>of</strong> <strong>the</strong> stream is<br />
higher than <strong>the</strong> water table <strong>and</strong> <strong>the</strong> streambed is permeable.<br />
For example, streams that enter <strong>the</strong> <strong>Klamath</strong> Marsh area<br />
from <strong>the</strong> Cascade Range in <strong>the</strong> nor<strong>the</strong>rn part <strong>of</strong> <strong>the</strong> study<br />
area generally lose much or all <strong>of</strong> <strong>the</strong>ir flow into <strong>the</strong> highly<br />
permeable soil as <strong>the</strong>y flow onto <strong>the</strong> pumice plain. No major<br />
streams in <strong>the</strong> upper <strong>Klamath</strong> <strong>Basin</strong>, however, are known to<br />
lose regionally significant water in this manner, <strong>and</strong> stream<br />
leakage probably is not a substantial source <strong>of</strong> recharge on a<br />
regional scale in <strong>the</strong> basin.<br />
Irrigation activities also can result in artificial groundwater<br />
recharge. Irrigation canals typically lose some<br />
water to <strong>the</strong> shallow parts <strong>of</strong> <strong>the</strong> ground-water system.<br />
No measurements <strong>of</strong> canal leakage rates in <strong>the</strong> upper<br />
<strong>Klamath</strong> <strong>Basin</strong> were available or made during this study,<br />
but measurements exist for o<strong>the</strong>r areas. Canal leakage rates
<strong>Ground</strong>-<strong>Water</strong> <strong>Hydrology</strong> 21<br />
determined from ponding studies range from less than 1<br />
to greater than 20 (ft 3 /s)/mi in <strong>the</strong> upper Deschutes <strong>Basin</strong>,<br />
directly to <strong>the</strong> north <strong>of</strong> <strong>the</strong> <strong>Klamath</strong> <strong>Basin</strong> (Gannett <strong>and</strong> o<strong>the</strong>rs,<br />
2001). The large rates are from unlined canals in fractured<br />
lava. Rates in areas underlain by sedimentary deposits<br />
commonly range from less than 1 to 3 (ft 3 /s)/mi. Canal leakage<br />
rates in <strong>the</strong> Methow Valley <strong>of</strong> Washington range from 1.0<br />
to 10.7 (ft 3 /s)/mi, <strong>and</strong> average 1.8 (ft 3 /s)/mi (Konrad, 2003).<br />
Canal bed materials <strong>the</strong>re include glaci<strong>of</strong>luvial deposits,<br />
colluvium, clay, <strong>and</strong> bedrock. In addition to canal leakage,<br />
water applied to fields can percolate beneath <strong>the</strong> root zone<br />
<strong>and</strong> into <strong>the</strong> shallow parts <strong>of</strong> <strong>the</strong> ground-water system. The<br />
amount <strong>of</strong> deep percolation <strong>of</strong> irrigation water depends on<br />
<strong>the</strong> irrigation method. Gannett <strong>and</strong> o<strong>the</strong>rs (2001) estimated<br />
ground-water recharge from deep percolation <strong>of</strong> irrigation<br />
water in <strong>the</strong> upper Deschutes <strong>Basin</strong> to be about 49,000 acreft/yr,<br />
or about 11 percent <strong>of</strong> <strong>the</strong> estimated water deliveries.<br />
Studies in <strong>the</strong> Amargosa Desert in Nevada resulted in<br />
estimates <strong>of</strong> deep percolation ranging from 8 to 16 percent<br />
<strong>of</strong> applied water (Stonestrom <strong>and</strong> o<strong>the</strong>rs, 2003). No data are<br />
available to determine <strong>the</strong> amount <strong>of</strong> ground-water recharge<br />
from canal leakage <strong>and</strong> deep percolation <strong>of</strong> irrigation water<br />
in <strong>the</strong> upper <strong>Klamath</strong> <strong>Basin</strong>. However, ground-water recharge<br />
from irrigation activities is indicated because <strong>the</strong> water table<br />
in <strong>the</strong> shallow aquifers in <strong>the</strong> Project area rises during <strong>the</strong><br />
irrigation season, <strong>and</strong> 2001 measurements showed <strong>the</strong> shallow<br />
water table declined when irrigation was severely curtailed in<br />
<strong>the</strong> Project area. Moreover, some deep irrigation wells also<br />
respond when canals <strong>of</strong> <strong>the</strong> <strong>Klamath</strong> Project start flowing<br />
in <strong>the</strong> spring (Bill Ehorn, California Department <strong>of</strong> <strong>Water</strong><br />
Resources, written commun., 2002), indicating some recharge<br />
takes place, at least locally, to <strong>the</strong> deeper parts <strong>of</strong> <strong>the</strong> groundwater<br />
system from irrigation-related activities. Most irrigation<br />
in <strong>the</strong> upper <strong>Klamath</strong> <strong>Basin</strong> occurs in alluvial stream valleys<br />
<strong>and</strong> lake basins, <strong>and</strong> <strong>the</strong>se areas are commonly crisscrossed<br />
by drains. Much <strong>of</strong> <strong>the</strong> water recharged to <strong>the</strong> shallow parts <strong>of</strong><br />
ground-water system by irrigation activities likely discharges<br />
to <strong>the</strong> drain system (or streams) after traveling underground<br />
only a short distance (probably less than thous<strong>and</strong>s <strong>of</strong> feet).<br />
Data are insufficient to estimate net regional ground-water<br />
recharge from irrigation activities in <strong>the</strong> upper <strong>Klamath</strong><br />
<strong>Basin</strong>; however, <strong>the</strong> low permeability <strong>of</strong> <strong>the</strong> lake sediments<br />
that underlie most <strong>of</strong> <strong>the</strong> <strong>Klamath</strong> Project area suggests that<br />
ground-water movement from <strong>the</strong> water table in <strong>the</strong> Project<br />
area to <strong>the</strong> deeper, regional ground-water system is somewhat<br />
restricted <strong>and</strong> that canal leakage <strong>and</strong> deep percolation <strong>of</strong><br />
irrigation water probably are not a significant source <strong>of</strong><br />
recharge to <strong>the</strong> regional ground-water system.<br />
<strong>Ground</strong>-water recharge cannot be directly measured<br />
at a regional scale. Regional ground-water recharge can be<br />
estimated, however, by measuring ground-water discharge,<br />
which can be measured or estimated with reasonable accuracy.<br />
Equation 2 shows that ground-water recharge to a system is<br />
equal to <strong>the</strong> discharge plus or minus any changes in storage.<br />
The long-term change in ground-water storage in <strong>the</strong> upper<br />
<strong>Klamath</strong> <strong>Basin</strong> (as indicated by long-term water level data)<br />
is negligible compared to <strong>the</strong> annual ground-water budget,<br />
allowing recharge to be estimated by measuring or estimating<br />
components <strong>of</strong> discharge.<br />
The principal avenues <strong>of</strong> ground-water discharge<br />
in <strong>the</strong> upper <strong>Klamath</strong> <strong>Basin</strong> are discharge to streams,<br />
evapotranspiration by plants with roots that penetrate to <strong>the</strong><br />
water table (in a process known as “subirrigation”), <strong>and</strong><br />
pumping. <strong>Ground</strong>-water discharge to streams is estimated to<br />
average about 1.8 million acre-ft/yr, or about 2,400 ft 3 /s.<br />
<strong>Ground</strong>-water pumping in 2000, prior to <strong>the</strong> rapid<br />
increase starting in 2001, is estimated to have been about 0.15<br />
acre-ft/yr. <strong>Ground</strong>-water discharge through subirrigation in<br />
areas where <strong>the</strong> water table is close to l<strong>and</strong> surface is difficult<br />
to estimate because it <strong>of</strong>ten occurs in wetl<strong>and</strong>s where water<br />
comes from both ground- <strong>and</strong> surface-water sources. Total<br />
evapotranspiration from <strong>Upper</strong> <strong>Klamath</strong> Lake <strong>and</strong> surrounding<br />
wetl<strong>and</strong>s, <strong>the</strong> Tule Lake <strong>and</strong> Lower <strong>Klamath</strong> Lake Refuge<br />
wetl<strong>and</strong>s, <strong>and</strong> <strong>Klamath</strong> Marsh is estimated to be roughly 0.7<br />
million acre-ft/yr (table 3), a large amount <strong>of</strong> this, however, is<br />
supplied by surface water. Therefore, ground-water discharge<br />
through subirrigation is likely small compared to discharge to<br />
streams.<br />
Given that regional-scale long-term changes in groundwater<br />
storage are small, average recharge to <strong>the</strong> regional<br />
ground-water system is assumed to be approximately equal<br />
to <strong>the</strong> estimated ground-water discharge to streams <strong>and</strong> wells<br />
<strong>of</strong> about 2 million acre-ft/yr (rounded up to reflect some<br />
evapotranspiration directly from <strong>the</strong> water table). This figure<br />
does not include recharge from irrigation activities in <strong>the</strong><br />
Project or subsurface discharge to or recharge from adjacent<br />
basins.<br />
<strong>Ground</strong>-water recharge from precipitation, <strong>the</strong>refore,<br />
is about 20 percent <strong>of</strong> <strong>the</strong> total precipitation basinwide. The<br />
exact percentage, however, varies spatially <strong>and</strong> temporally.<br />
Gannett <strong>and</strong> o<strong>the</strong>rs (2001), working with a water-balance<br />
model developed by Boyd (1996), noted that ground-water<br />
recharge in <strong>the</strong> upper Deschutes <strong>Basin</strong> ranges from 5 to 70<br />
percent depending on location. In <strong>the</strong> Cascade Range, where<br />
<strong>the</strong>re is a large amount <strong>of</strong> precipitation, which far exceeds<br />
potential evapotranspiration, a large percentage enters <strong>the</strong><br />
ground-water system. In contrast, only a small fraction <strong>of</strong> <strong>the</strong><br />
precipitation recharges ground water in <strong>the</strong> very dry interior<br />
parts <strong>of</strong> <strong>the</strong> basin, where precipitation is a fraction <strong>of</strong> <strong>the</strong><br />
potential evapotranspiration. Temporally, recharge varies<br />
seasonally <strong>and</strong> from year to year. Recharge from precipitation<br />
in mountainous areas, like <strong>the</strong> Cascade Range, occurs during<br />
spring snowmelt. Recharge from irrigation occurs during <strong>the</strong><br />
irrigation season. The timing <strong>of</strong> recharge pulses from <strong>the</strong>se<br />
sources can be seen in water level data from wells (discussed<br />
later). Recharge will vary from year to year depending on<br />
<strong>the</strong> annual precipitation. Estimated basinwide recharge in <strong>the</strong><br />
upper Deschutes <strong>Basin</strong> ranged from less than 3 in/yr during<br />
<strong>the</strong> drought years <strong>of</strong> 1977 <strong>and</strong> 1994 to more than 20 in/yr in<br />
1982 (Gannett <strong>and</strong> o<strong>the</strong>rs, 2001).
22 <strong>Ground</strong>-<strong>Water</strong> <strong>Hydrology</strong> <strong>of</strong> <strong>the</strong> <strong>Upper</strong> <strong>Klamath</strong> <strong>Basin</strong>, <strong>Oregon</strong> <strong>and</strong> California<br />
<strong>Ground</strong>-<strong>Water</strong> Discharge to Streams<br />
<strong>Water</strong> flows to streams through a variety <strong>of</strong> mechanisms.<br />
For convenience, streamflow is <strong>of</strong>ten broken into three<br />
components: surface run<strong>of</strong>f, interflow, <strong>and</strong> baseflow. The<br />
surface run<strong>of</strong>f component reaches <strong>the</strong> stream through<br />
overl<strong>and</strong> flow or flow in <strong>the</strong> top <strong>of</strong> <strong>the</strong> soil pr<strong>of</strong>ile. Such<br />
flow is typically rapid, <strong>and</strong> is responsible for <strong>the</strong> rapid rise in<br />
streamflow during <strong>and</strong> immediately after storms or snowmelt.<br />
Interflow, also termed subsurface run<strong>of</strong>f, reaches <strong>the</strong> stream<br />
through flow in unsaturated or temporarily saturated zones<br />
in <strong>the</strong> upper soil layers. Baseflow generally is considered to<br />
be fed by ground-water discharge. Baseflow can originate<br />
from a variety <strong>of</strong> scales <strong>of</strong> ground-water flow, ranging from<br />
short, local flow paths to long <strong>and</strong> deep regional flow paths.<br />
Baseflow generally is <strong>the</strong> source <strong>of</strong> water in streams in <strong>the</strong> late<br />
summer <strong>and</strong> fall, when little or no precipitation or remaining<br />
snow are available to provide surface run<strong>of</strong>f or interflow.<br />
The flow in some streams in <strong>the</strong> upper <strong>Klamath</strong> <strong>Basin</strong><br />
consists entirely <strong>of</strong> ground-water discharge. Such streams<br />
are characterized by consistent year-round flow with little<br />
seasonal variability. An example <strong>of</strong> a typical ground-water-fed<br />
stream is <strong>the</strong> Wood River at Fort <strong>Klamath</strong> (USGS streamgaging<br />
station number 11504000), which during <strong>the</strong> period <strong>of</strong><br />
record from 1913 to 1936 had a mean annual flow <strong>of</strong> 215 ft 3 /s<br />
<strong>and</strong> a st<strong>and</strong>ard deviation <strong>of</strong> daily mean flows <strong>of</strong> only 58 ft 3 /s.<br />
The mean September flow <strong>of</strong> <strong>the</strong> Wood River was 199 ft 3 /s, or<br />
about 93 percent <strong>of</strong> <strong>the</strong> mean annual flow. O<strong>the</strong>r streams, in<br />
contrast, have a relatively small component <strong>of</strong> ground-water<br />
discharge <strong>and</strong> consist predominantly <strong>of</strong> surface run<strong>of</strong>f. Such<br />
streams have large seasonal variability, with high flows during<br />
<strong>and</strong> immediately after rainfall or snowmelt followed by low<br />
or no flow during <strong>the</strong> dry periods <strong>of</strong> <strong>the</strong> year. Stream gaging<br />
data from <strong>the</strong> Sycan River below Snake Creek near Beatty<br />
(station 11499100) provide an example <strong>of</strong> a stream with a<br />
large component <strong>of</strong> surface run<strong>of</strong>f. During <strong>the</strong> period <strong>of</strong> record<br />
from 1973 to 2003 <strong>the</strong> Sycan River at this location had a mean<br />
annual flow <strong>of</strong> 152 ft 3 /s <strong>and</strong> a st<strong>and</strong>ard deviation <strong>of</strong> daily mean<br />
flows <strong>of</strong> 282 ft 3 /s. The mean September flow <strong>of</strong> <strong>the</strong> Sycan<br />
River here is only 23 ft 3 /s, or about 15 percent <strong>of</strong> <strong>the</strong> mean<br />
annual flow. Most streams in <strong>the</strong> <strong>Klamath</strong> <strong>Basin</strong> exhibit all<br />
three components <strong>of</strong> discharge throughout <strong>the</strong> year. Identifying<br />
<strong>the</strong> amount <strong>of</strong> streamflow supplied by ground-water discharge<br />
is problematic during times <strong>of</strong> <strong>the</strong> year when <strong>the</strong>re is<br />
substantial contribution from overl<strong>and</strong> flow <strong>and</strong> interflow.<br />
However, in <strong>the</strong> late summer <strong>and</strong> fall, when <strong>the</strong>re is scant<br />
precipitation <strong>and</strong> snow has melted, streamflow is composed<br />
largely <strong>of</strong> ground-water discharge. Exceptions to this<br />
generalization include streams receiving substantial irrigation<br />
return flow or water from reservoir releases. Where <strong>the</strong>se<br />
exceptions do not occur, or can be accounted for, streamflow<br />
during <strong>the</strong> fall months (September–November) when<br />
precipitation, run<strong>of</strong>f, <strong>and</strong> interflow are nearly absent provides<br />
a good estimate <strong>of</strong> baseflow or ground-water discharge.<br />
The location <strong>and</strong> quantity <strong>of</strong> ground-water discharge<br />
entering <strong>the</strong> stream network was estimated at numerous<br />
locations throughout <strong>the</strong> upper <strong>Klamath</strong> <strong>Basin</strong> (table 6, at<br />
back <strong>of</strong> report). Estimates are, for <strong>the</strong> most part, based on<br />
measurements <strong>of</strong> actual spring discharge or streamflow during<br />
late summer <strong>and</strong> fall. For some spring-dominated streams<br />
(Spring Creek, for example), streamflow over <strong>the</strong> entire year<br />
could have been used to determine ground-water discharge.<br />
However, to maintain consistency in <strong>the</strong> analysis, data from<br />
<strong>the</strong> fall months were used exclusively where possible. Some<br />
<strong>of</strong> <strong>the</strong> ground-water discharge estimates were based on <strong>the</strong><br />
OWRD natural streamflow analysis for <strong>the</strong> <strong>Klamath</strong> <strong>Basin</strong><br />
(Cooper, 2004). These estimates represent <strong>the</strong> median or<br />
typical flow for a particular month over a 30-year base period,<br />
from 1958 to 1997. For this study, <strong>the</strong> work was supplemented<br />
by additional analysis, streamflow measurements, <strong>and</strong><br />
fieldwork performed from 1997 to 2005. When possible, <strong>the</strong><br />
estimate represents <strong>the</strong> typical ground-water discharge for <strong>the</strong><br />
fall over a base period from 1958 to 1987. Selection <strong>of</strong> this<br />
base period is detailed in Cooper (2002). However, sometimes<br />
<strong>the</strong> available data at a location was insufficient to generate an<br />
estimate that represented <strong>the</strong> base period. In those cases, <strong>the</strong><br />
estimate may not reflect <strong>the</strong> long-term average conditions. The<br />
data sources <strong>and</strong> techniques used to estimate ground-water<br />
discharge are listed for each reach in table 6.<br />
Estimates <strong>of</strong> ground-water discharge have inherent<br />
uncertainty. One source <strong>of</strong> uncertainty is <strong>the</strong> streamflow<br />
measurements on which <strong>the</strong>y are based. For example, records<br />
from stream gages are rated “excellent” when 95 percent <strong>of</strong><br />
<strong>the</strong> daily discharge values are within 5 percent <strong>of</strong> <strong>the</strong> true<br />
value, “good” when 95 percent <strong>of</strong> <strong>the</strong> daily discharge values<br />
are within 10 percent <strong>of</strong> <strong>the</strong> true value, <strong>and</strong> “fair” when 95<br />
percent <strong>of</strong> <strong>the</strong> daily discharge values are within 15 percent <strong>of</strong><br />
<strong>the</strong> true value. Some <strong>of</strong> <strong>the</strong> estimates in table 6 are based on<br />
regression models where estimates are derived by comparing<br />
streamgage data that span periods that are short or outside <strong>of</strong><br />
<strong>the</strong> base period, or miscellaneous measurements with longterm<br />
flow data from streams determined to be hydrologically<br />
representative <strong>of</strong> <strong>the</strong> stream in question. Regression models<br />
are ano<strong>the</strong>r source <strong>of</strong> uncertainty. A detailed description <strong>of</strong><br />
<strong>the</strong> regression analyses is available in Cooper (2004). Some<br />
ground-water discharge estimates in table 6 are based on<br />
single measurements or averages <strong>of</strong> multiple measurements<br />
<strong>and</strong> are not shifted to <strong>the</strong> base period. Consequently, <strong>the</strong>re is<br />
uncertainty as to <strong>the</strong> degree to which <strong>the</strong>y represent long-term<br />
average conditions. An assessment <strong>of</strong> <strong>the</strong> level <strong>of</strong> certainty<br />
<strong>of</strong> each estimate is included in table 6, <strong>and</strong> most figures are<br />
rounded to two significant figures. Rates <strong>of</strong> discharge at <strong>the</strong><br />
large spring complexes responsible for most <strong>of</strong> <strong>the</strong> groundwater<br />
discharge in <strong>the</strong> basin are generally well known <strong>and</strong><br />
have <strong>the</strong> least associated uncertainty. Although <strong>the</strong>re may be<br />
uncertainty in <strong>the</strong> estimates <strong>of</strong> long-term average ground water<br />
discharging at certain locations, <strong>the</strong> presence <strong>of</strong> discharge<br />
at <strong>the</strong> listed locations is well established, <strong>and</strong> <strong>the</strong> general<br />
distribution <strong>and</strong> magnitude <strong>of</strong> ground-water discharge in <strong>the</strong><br />
upper <strong>Klamath</strong> <strong>Basin</strong> is well understood.
<strong>Ground</strong>-<strong>Water</strong> <strong>Hydrology</strong> 23<br />
Geographic Distribution <strong>of</strong> <strong>Ground</strong>-<strong>Water</strong><br />
Discharge to Streams<br />
<strong>Ground</strong>-water discharge to major streams was estimated<br />
in five subregions. The subregions were based on <strong>the</strong> USGS<br />
4th field Hydrologic Unit Code (HUC) with fur<strong>the</strong>r analysis<br />
by smaller stream groupings in each subregion, based largely<br />
on 5th field HUCs. The five subregions are (1) Sprague River,<br />
(2) Williamson River, (3) <strong>Upper</strong> <strong>Klamath</strong> Lake, (4) Lost River,<br />
<strong>and</strong> (5) <strong>Klamath</strong> River.<br />
The values in table 6 represent <strong>the</strong> estimated long-term<br />
average ground-water discharge (gains) to all major streams<br />
in <strong>the</strong> stream system, <strong>and</strong> <strong>the</strong>refore reflect most <strong>of</strong> <strong>the</strong><br />
ground-water discharge to <strong>the</strong> streams. Average ground-water<br />
discharge into <strong>the</strong> stream network <strong>of</strong> <strong>the</strong> upper <strong>Klamath</strong> <strong>Basin</strong><br />
(above Iron Gate Dam) totals about 2,400 ft 3 /s (1.8 million<br />
acre-ft/yr). This estimate includes gains to <strong>the</strong> Lost River,<br />
which are at least 195 ft 3 /s, but may be higher due to unknown<br />
gains to <strong>the</strong> river below Lost River Diversion Channel.<br />
<strong>Ground</strong>-water discharge directly to Lower <strong>Klamath</strong> Lake <strong>and</strong><br />
<strong>the</strong> Tule Lake Sump was not estimated due to insufficient data.<br />
<strong>Ground</strong>-water discharge varies from subbasin to subbasin,<br />
reflecting precipitation patterns as well as geologic controls<br />
on ground-water movement (fig. 7). The largest groundwater<br />
discharge areas are in <strong>the</strong> Lower Williamson, Wood<br />
River, <strong>Upper</strong> <strong>Klamath</strong> Lake, <strong>and</strong> <strong>Klamath</strong> River subbasins.<br />
Besides <strong>Upper</strong> <strong>Klamath</strong> Lake <strong>and</strong> parts <strong>of</strong> <strong>the</strong> <strong>Klamath</strong> River<br />
subbasins, <strong>the</strong> specific locations <strong>of</strong> ground-water discharge are<br />
largely known <strong>and</strong> <strong>the</strong> quality <strong>of</strong> <strong>the</strong> estimates is considered<br />
good. Estimates <strong>of</strong> ground-water discharge to marshes have<br />
larger uncertainty due to difficulties with mass balances.<br />
Temporal Fluctuations in <strong>Ground</strong>-<strong>Water</strong><br />
Discharge to Streams<br />
<strong>Ground</strong>-water discharge to streams is not constant, but<br />
fluctuates with time in response to variations in recharge <strong>and</strong>,<br />
in some circumstances, ground-water pumping. In <strong>the</strong> upper<br />
<strong>Klamath</strong> <strong>Basin</strong>, varying recharge is <strong>the</strong> predominant cause<br />
<strong>of</strong> ground-water discharge fluctuations. Recharge varies in<br />
response to seasonal wea<strong>the</strong>r patterns (wet winters versus dry<br />
summers), as well as in response to decadal-scale drought<br />
cycles <strong>and</strong> longer-term climate trends. A graph <strong>of</strong> total annual<br />
precipitation at Crater Lake National Park (fig. 8) shows<br />
<strong>the</strong> year-to-year variations in precipitation <strong>and</strong> longer-term<br />
variations. A useful way to look at long-term climate cycles<br />
is a graph <strong>of</strong> <strong>the</strong> cumulative departure from average (fig. 8).<br />
<strong>Water</strong>-table fluctuations <strong>and</strong> variations in discharge <strong>of</strong>ten<br />
mimic this pattern. The precipitation at Crater Lake over <strong>the</strong><br />
past several decades exhibits <strong>the</strong> pattern observed at o<strong>the</strong>r<br />
precipitation stations throughout <strong>the</strong> region <strong>and</strong> in streamflow<br />
<strong>and</strong> ground-water levels as well. Most notable is <strong>the</strong> dry<br />
period in <strong>the</strong> 1930s <strong>and</strong> early 1940s followed by a wet period<br />
in <strong>the</strong> late 1940s <strong>and</strong> 1950s. The pattern from <strong>the</strong> 1960s to<br />
<strong>the</strong> present is characterized by decadal scale drought cycles<br />
superimposed on an apparent drying trend. Generally dry<br />
periods include 1966 to 1968, 1976 to 1981, 1987 to 1994, <strong>and</strong><br />
2000 to 2005.<br />
The timing <strong>and</strong> magnitude <strong>of</strong> ground-water discharge<br />
fluctuations can vary depending on <strong>the</strong> scale <strong>of</strong> <strong>the</strong> flow<br />
system involved. Small-scale systems with flow paths <strong>of</strong> less<br />
than a few miles <strong>and</strong> catchments <strong>of</strong> 1 to 10 mi 2 , for example<br />
<strong>the</strong> flow system feeding <strong>the</strong> springs at <strong>the</strong> head <strong>of</strong> Annie<br />
Creek near Crater Lake, fluctuate in response to present-year<br />
precipitation. Such features will have large discharge during<br />
wet years <strong>and</strong> small discharge during dry years. In contrast,<br />
large-scale flow systems with flow paths <strong>of</strong> tens <strong>of</strong> miles <strong>and</strong><br />
catchments <strong>of</strong> hundreds <strong>of</strong> square miles, such as <strong>the</strong> lowelevation<br />
regional spring complexes feeding <strong>the</strong> Wood River<br />
or Spring Creek, respond more to longer-term climate signals.<br />
Instead <strong>of</strong> reflecting <strong>the</strong> year-to-year precipitation like small<br />
springs, large-scale systems tend to integrate precipitation over<br />
several years <strong>and</strong> follow a pattern similar to <strong>the</strong> cumulative<br />
departure from average precipitation (fig. 8).<br />
Several techniques were used in this study to determine or<br />
evaluate variations in ground-water discharge. <strong>Ground</strong>-water<br />
discharge fluctuations were in some cases measured directly<br />
by gaging stations on streams that are solely spring fed. Such<br />
data are rare in <strong>the</strong> upper <strong>Klamath</strong> <strong>Basin</strong>. <strong>Ground</strong>-water<br />
discharge fluctuations were calculated in some areas where<br />
two or more gaging stations with overlapping records bracket<br />
a stream reach to which ground-water discharges. These types<br />
<strong>of</strong> data are available for several stream reaches in <strong>the</strong> upper<br />
<strong>Klamath</strong> <strong>Basin</strong>. The analyses in such situations, however,<br />
were complicated by ungaged diversions or tributary inflow.<br />
Information on ground-water discharge fluctuations also was<br />
provided by sets <strong>of</strong> miscellaneous streamflow measurements<br />
along reaches where ground water discharges. Many streams<br />
include surface run<strong>of</strong>f as well as a large component <strong>of</strong> groundwater<br />
discharge. Comparing late summer or fall flows (when<br />
streamflow is commonly composed largely <strong>of</strong> ground-water<br />
discharge) from year to year can provide useful information on<br />
temporal variations in ground-water discharge.<br />
<strong>Ground</strong>-<strong>Water</strong> Discharge to Streams by<br />
Subbasin<br />
Sprague River Subbasin—Geographic Distribution <strong>of</strong><br />
<strong>Ground</strong>-<strong>Water</strong> Discharge<br />
The Sprague River subbasin encompasses <strong>the</strong> entire<br />
drainage above its confluence with <strong>the</strong> Williamson River,<br />
including <strong>the</strong> Sycan River drainage basin (fig. 7). The<br />
subbasin includes many run<strong>of</strong>f-dominated streams in <strong>the</strong><br />
volcanic upper watersheds as wells as isolated springs <strong>and</strong><br />
ground-water-dominated streams in <strong>the</strong> sediment filled valleys<br />
in <strong>the</strong> lower reaches <strong>of</strong> tributaries <strong>and</strong> along <strong>the</strong> main stem.
Creek<br />
24 <strong>Ground</strong>-<strong>Water</strong> <strong>Hydrology</strong> <strong>of</strong> <strong>the</strong> <strong>Upper</strong> <strong>Klamath</strong> <strong>Basin</strong>, <strong>Oregon</strong> <strong>and</strong> California<br />
43°15'<br />
43°00'<br />
45'<br />
30'<br />
15'<br />
42°00'<br />
45'<br />
41°30'<br />
OR19-0048_fig07<br />
122°30' 15'<br />
Camp Cr<br />
Scotch Cr<br />
Dry Cr<br />
138<br />
D O U G L A S<br />
62<br />
Butte<br />
Falls<br />
66<br />
11516530<br />
Prospect<br />
85<br />
Shasta River<br />
5<br />
J A C K S O N<br />
Mt<br />
McLoughlin<br />
Mill Cr<br />
Jenny<br />
Cr<br />
Little<br />
84<br />
Fall<br />
Cr<br />
Copco<br />
Lake<br />
Iron 11512000<br />
Gate<br />
Res<br />
<strong>Klamath</strong><br />
Pinehurst<br />
Shasta<br />
Diamond<br />
Lake<br />
Whitney<br />
Creek<br />
230<br />
Crater Lake<br />
11503000<br />
83<br />
Lake<br />
<strong>of</strong> <strong>the</strong><br />
Woods<br />
Spencer<br />
Edge Cr<br />
River<br />
Crater<br />
Lake<br />
Creek<br />
River<br />
122°00'<br />
Sun<br />
Butte<br />
Creek<br />
Agency<br />
Lake<br />
138<br />
Keno<br />
11509500<br />
11510700 <strong>Klamath</strong><br />
Strait<br />
66<br />
97<br />
Lenz<br />
45'<br />
Chemult<br />
Silver<br />
Lake<br />
Fort 11493500<br />
52 Kirk<br />
<strong>Klamath</strong><br />
59<br />
11504000 Solomon<br />
Crane<br />
Butte<br />
Creek 62 51 47<br />
55 56<br />
Mares<br />
<strong>Klamath</strong>11494000<br />
Whitehorse<br />
Egg<br />
Spring<br />
Agency Spring<br />
11504100<br />
Cherry 58<br />
50 21<br />
11501000 McReady<br />
Creek<br />
62 Chiloquin Spring<br />
63<br />
20<br />
Narrows<br />
Pelican<br />
Chiloquin Kamkaun<br />
Spring<br />
Butte<br />
11502500<br />
Rocky<br />
Point<br />
Modoc<br />
<strong>Upper</strong> Point<br />
11505600<br />
<strong>Klamath</strong> 65<br />
(345 ft 3 /s<br />
net inflow)<br />
140 Lake<br />
Fourmile<br />
Cr<br />
64<br />
Spencer<br />
53<br />
Shovel Cr<br />
Annie<br />
Mount<br />
Thielsen<br />
Sevenmile<br />
Creek<br />
Scott<br />
Creek<br />
S<strong>and</strong><br />
Creek<br />
Cr<br />
Fourmile<br />
Creek<br />
Wood<br />
River<br />
Spring<br />
Creek<br />
11510000<br />
John C. Boyle Keno<br />
Reservoir Dam<br />
85<br />
82<br />
EXPLANATION<br />
Miller<br />
Creek<br />
Sink<br />
Creek<br />
Dorris<br />
Hot<br />
Creek<br />
Larkin<br />
Creek<br />
Cottonwood<br />
Creek<br />
Big<br />
Springs<br />
Creek<br />
Average annual rate <strong>of</strong> ground-water discharge to<br />
shaded stream reaches— In cubic feet per second<br />
per mile. See table 6 for reach number name.<br />
0.05-2.5<br />
2.5-5.0<br />
5.0-10.0<br />
10.0-25.0<br />
25.0-75.0<br />
75.0-200.0 97<br />
End point between adjacent reaches<br />
with <strong>the</strong> same shade color<br />
USGS streamflow gaging station with number<br />
11510700<br />
See table <strong>of</strong> contents for mapping sources<br />
45<br />
54<br />
81<br />
42<br />
43<br />
44<br />
41<br />
Jack<br />
Merrill<br />
Trout Cr<br />
Lower<br />
<strong>Klamath</strong><br />
Lake<br />
Willow<br />
Creek<br />
Creek<br />
40<br />
Wildhorse<br />
Ridge<br />
(50 ft/s<br />
net inflow)<br />
<strong>Klamath</strong> Valley<br />
<strong>Klamath</strong> Hills<br />
<strong>Klamath</strong><br />
Marsh<br />
Lost<br />
River<br />
30'<br />
Williamson<br />
Williamson<br />
Sprague<br />
River<br />
Tule<br />
Lake<br />
Sump<br />
River<br />
Road<br />
K L A M AT H<br />
Sprague<br />
Yonna Valley<br />
Sheepy Ridge<br />
S I S K I Y O U<br />
Sheep<br />
Creek<br />
River<br />
Taylor<br />
Butte<br />
Swan Lake Valley<br />
Dairy<br />
<strong>Klamath</strong> Falls<br />
Lake Ewauna The<br />
75Gap<br />
Olene<br />
Lost River 74<br />
Diversion<br />
Channel<br />
Stukel<br />
Mountain<br />
79<br />
Sheepy<br />
Creek<br />
80 78<br />
77<br />
38<br />
39<br />
11491400<br />
Poe Valley<br />
Jackson<br />
Creek<br />
Rocky<br />
Ford<br />
Wickiup<br />
Spring<br />
River<br />
Whisky<br />
Creek<br />
Bly<br />
Mt<br />
15'<br />
Medicine<br />
139<br />
Lake<br />
Volcano<br />
Scale 1:1,000,000<br />
5 0 5 10 15 20 MILES<br />
70<br />
Lost<br />
Malin<br />
River<br />
Tulelake<br />
Long<br />
Sycan<br />
Knot Tablel<strong>and</strong><br />
15<br />
73<br />
37<br />
32-35<br />
Brown<br />
Spring<br />
16<br />
72<br />
Bonanza<br />
Yamsay<br />
Mountain<br />
Study<br />
Torrent<br />
Spring<br />
70<br />
Spodue<br />
Mountain<br />
71<br />
28<br />
31<br />
5 0 5 10 15 20 KILOMETERS<br />
11499100<br />
Beatty<br />
Brown<br />
Creek<br />
14<br />
24<br />
Bryant Mountain<br />
Lorella<br />
Langell<br />
Valley<br />
Creek<br />
River<br />
11497000<br />
11<br />
Yainax<br />
Butte<br />
Miller Cr<br />
69<br />
Silver<br />
Lake<br />
Fivemile<br />
11497500<br />
area<br />
Sycan<br />
Marsh<br />
Creek<br />
Meryl<br />
Bly Ridge<br />
76<br />
67<br />
8<br />
Clear<br />
Lake<br />
Res<br />
66<br />
(40 ft 3 /s<br />
net inflow)<br />
121°00'<br />
Fork<br />
N<br />
11496500<br />
Bly<br />
Gerber<br />
Reservoir<br />
Willow<br />
<strong>Upper</strong><br />
<strong>Klamath</strong><br />
<strong>Basin</strong><br />
31<br />
Summer<br />
Lake<br />
boundary<br />
L A K E<br />
7<br />
Creek<br />
Fritz<br />
Creek<br />
10<br />
S Fork<br />
68<br />
(10 ft 3 /s<br />
net inflow)<br />
Willow<br />
M O D O C<br />
River<br />
6<br />
Sprague<br />
25<br />
3<br />
Deming<br />
Creek<br />
11495500<br />
Cr<br />
Cr<br />
OREGON<br />
Winter Ridge<br />
2<br />
5<br />
River<br />
Sprague<br />
1<br />
CALIFORNIA<br />
120°<br />
45'<br />
Summer Lake<br />
Barns Rim<br />
140<br />
OREGON<br />
Modoc Plateau<br />
Gearhart<br />
Mountain<br />
Brownsworth<br />
Creek<br />
Coleman Rim<br />
CALIFORNIA<br />
Figure 7. Principal areas <strong>of</strong> ground-water discharge to streams <strong>and</strong> major springs in <strong>the</strong> upper <strong>Klamath</strong> <strong>Basin</strong>, <strong>Oregon</strong> <strong>and</strong> California,<br />
<strong>and</strong> selected stream-gaging stations. Shading along main stem reaches represents ground-water discharge (in cubic feet per second per<br />
mile) averaged along <strong>the</strong> entire shaded reach. The actual location <strong>of</strong> ground-water discharge may be localized. Shading along headwater<br />
streams represents <strong>the</strong> ground-water discharge averaged over <strong>the</strong> shaded reach <strong>and</strong> includes ground-water discharge to tributaries. See<br />
table 6 for detailed descriptions <strong>of</strong> measurement locations.<br />
299<br />
Pit<br />
River
<strong>Ground</strong>-<strong>Water</strong> <strong>Hydrology</strong> 25<br />
TOTAL WATER-YEAR PRECIPITATION, IN INCHES<br />
120<br />
100<br />
80<br />
60<br />
40<br />
20<br />
Average annual<br />
precipitation<br />
66.7 inches<br />
Values estimated<br />
from o<strong>the</strong>r sites<br />
Total water-year precipitation at Crater Lake<br />
Cumulative departure from average precipitation (1932-2005)<br />
120<br />
100<br />
80<br />
60<br />
40<br />
20<br />
0<br />
-20<br />
CUMULATIVE DEPARTURE FROM AVERAGE, IN INCHES<br />
0<br />
1932 1940 1950 1960 1970 1980 1990 2000<br />
-40<br />
2005<br />
WATER YEAR<br />
Figure 8. Annual precipitation at Crater Lake National Park, <strong>Oregon</strong>, <strong>and</strong> <strong>the</strong> cumulative departure from average<br />
precipitation from 1932 to 2005. (Data from Western Regional Climate Center, 2006.)<br />
The Sprague River responds relatively quickly to precipitation<br />
<strong>and</strong> snowmelt events, with peaks commonly exceeding<br />
2,500 ft 3 /s in April or May at <strong>the</strong> gaging station near Chiloquin<br />
(station 11501000). Mean monthly discharge at this location<br />
averages 1,300 ft 3 /s during April <strong>and</strong> 300 ft 3 /s during October.<br />
Major hydrologic features <strong>of</strong> <strong>the</strong> subbasin include <strong>the</strong> North<br />
<strong>and</strong> South Forks <strong>of</strong> <strong>the</strong> Sprague River, <strong>the</strong> Sycan River <strong>and</strong><br />
Marsh, <strong>and</strong> Kamkaun Springs.<br />
The Sprague River originates along <strong>the</strong> flanks <strong>of</strong><br />
Gearheart Mountain <strong>and</strong> Coleman Rim in <strong>the</strong> highl<strong>and</strong>s along<br />
<strong>the</strong> central-eastern edge <strong>of</strong> <strong>the</strong> upper <strong>Klamath</strong> <strong>Basin</strong>. From<br />
<strong>the</strong>se highl<strong>and</strong>s, <strong>the</strong> North <strong>and</strong> South Forks gain water from<br />
numerous tributaries as <strong>the</strong>y flow down mountain canyons<br />
to <strong>the</strong> upper Sprague River Valley, above Beatty Gap. The<br />
hydrologic regimes <strong>of</strong> <strong>the</strong> North <strong>and</strong> South Forks have a<br />
pronounced run<strong>of</strong>f component <strong>and</strong> similar hydrographs near<br />
<strong>the</strong> upl<strong>and</strong>s, with peaks occurring during snowmelt in <strong>the</strong><br />
spring. However, above <strong>the</strong> Sprague River Valley, <strong>the</strong> North<br />
Fork gains significant ground water, whereas <strong>the</strong> South Fork<br />
does not.<br />
From <strong>the</strong> confluence <strong>of</strong> <strong>the</strong> North <strong>and</strong> South Forks, <strong>the</strong><br />
Sprague River me<strong>and</strong>ers downstream through <strong>the</strong> narrowing<br />
upper Sprague River Valley, until it passes through Beatty<br />
Gap into <strong>the</strong> lower valley. Gains due to ground-water inflow<br />
occur in <strong>the</strong> upper valley, which contains both drained <strong>and</strong><br />
un-drained wetl<strong>and</strong>s. More ground-water discharge occurs to<br />
a spring complex (locally known as Medicine Springs) just<br />
downstream <strong>of</strong> Beatty Gap. From here, <strong>the</strong> Sprague River<br />
me<strong>and</strong>ers through <strong>the</strong> lower Sprague River Valley for 75 mi, to<br />
its confluence with <strong>the</strong> Williamson River.<br />
OR19-0048_fig08<br />
Aside from <strong>the</strong> run<strong>of</strong>f-driven Sycan River, tributaries<br />
north <strong>of</strong> <strong>the</strong> river <strong>and</strong> downstream <strong>of</strong> Beatty Gap are limited to<br />
a few unnamed ephemeral creeks draining <strong>the</strong> Knot Tablel<strong>and</strong><br />
<strong>and</strong> a few small springs near <strong>the</strong> mouth <strong>of</strong> <strong>the</strong> Sycan River.<br />
South <strong>of</strong> <strong>the</strong> river are four perennial <strong>and</strong> several ephemeral<br />
creeks. Three <strong>of</strong> <strong>the</strong> perennial creeks (Spring, Brown, <strong>and</strong><br />
Whisky Creeks) are largely ground-water fed <strong>and</strong> lack a<br />
significant run<strong>of</strong>f component (fig. 7). (Note: The Spring Creek<br />
that is tributary to <strong>the</strong> Sprague River is too small to show at <strong>the</strong><br />
scale <strong>of</strong> figures in this report. It enters <strong>the</strong> Sprague River just<br />
east <strong>of</strong> Brown Creek. The o<strong>the</strong>r Spring Creek mentioned in<br />
this report is tributary to <strong>the</strong> Williamson River.) An additional,<br />
but smaller amount <strong>of</strong> ground water discharges to Trout Creek<br />
as well as a few small springs near <strong>the</strong> mouth <strong>of</strong> Whisky<br />
Creek. Two large, isolated spring complexes, Kamkaun-<br />
McReady <strong>and</strong> Whitehorse, far<strong>the</strong>r downstream, are <strong>the</strong> only<br />
o<strong>the</strong>r ground-water discharge areas in <strong>the</strong> lower valley.<br />
<strong>Ground</strong>-water discharge to <strong>the</strong> North <strong>and</strong> South Forks<br />
<strong>of</strong> <strong>the</strong> Sprague River (above <strong>the</strong> valley) was estimated using<br />
data from gaging stations with short periods <strong>of</strong> record <strong>and</strong><br />
miscellaneous measurements made from 1992 to 2002.<br />
The spatial distribution <strong>of</strong> gains is relatively well known<br />
in <strong>the</strong> reaches <strong>and</strong> main tributaries <strong>of</strong> <strong>the</strong> North <strong>and</strong> South<br />
Forks (fig 7). However, <strong>the</strong> locations <strong>of</strong> specific springs<br />
have not been identified in ei<strong>the</strong>r subbasin. Continuous <strong>and</strong><br />
miscellaneous streamflow measurements were analyzed using<br />
index regression techniques on <strong>the</strong> North <strong>and</strong> South Forks to<br />
improve underst<strong>and</strong>ing <strong>of</strong> <strong>the</strong> temporal variability <strong>of</strong> groundwater<br />
discharge. Gains to <strong>the</strong> South Fork above <strong>the</strong> valley are
26 <strong>Ground</strong>-<strong>Water</strong> <strong>Hydrology</strong> <strong>of</strong> <strong>the</strong> <strong>Upper</strong> <strong>Klamath</strong> <strong>Basin</strong>, <strong>Oregon</strong> <strong>and</strong> California<br />
about 24 ft 3 /s, with most ground-water discharge occurring<br />
above <strong>the</strong> confluence with Brownsworth Creek (table 6). On<br />
<strong>the</strong> basis <strong>of</strong> regional regression, Deming <strong>and</strong> Fritz Creeks are<br />
estimated to contribute an additional 5 ft 3 /s <strong>of</strong> ground-water<br />
discharge to <strong>the</strong> system. <strong>Ground</strong>-water discharge to <strong>the</strong> North<br />
Fork is about 92 ft 3 /s, with one-third <strong>of</strong> <strong>the</strong> flow originating<br />
from Fivemile <strong>and</strong> Meryl Creeks. There are no direct inputs to<br />
<strong>the</strong> lower 10 mi <strong>of</strong> <strong>the</strong> North Fork.<br />
The spatial distribution <strong>of</strong> ground-water discharge in<br />
<strong>the</strong> <strong>Upper</strong> Sprague River Valley (from <strong>the</strong> confluence <strong>of</strong> <strong>the</strong><br />
North <strong>and</strong> South Forks to Beatty Gap) is more uncertain.<br />
Although <strong>the</strong>re are no identified springs in <strong>the</strong> area, synoptic<br />
measurements show about 52 ft 3 /s <strong>of</strong> ground-water discharge<br />
along <strong>the</strong> 20-mi reach, including <strong>the</strong> main stem between<br />
Beatty Gap <strong>and</strong> <strong>the</strong> confluence <strong>of</strong> <strong>the</strong> North <strong>and</strong> South Forks,<br />
<strong>and</strong> <strong>the</strong> lower 11 mi <strong>of</strong> <strong>the</strong> South Fork (table 6).<br />
The Lower Sprague Valley is defined as <strong>the</strong> area between<br />
<strong>the</strong> mouth <strong>of</strong> <strong>the</strong> river <strong>and</strong> Beatty Gap. The locations <strong>of</strong> gains<br />
in this valley are well known from numerous sets <strong>of</strong> synoptic<br />
measurements. Gains total about 150 ft 3 /s. <strong>Ground</strong> water<br />
discharges directly to <strong>the</strong> river from <strong>the</strong> springs below Beatty<br />
Gap, Kamkaun, McReady, <strong>and</strong> White Horse Springs, as well<br />
as through tributaries at Whisky, Spring, <strong>and</strong> Brown Creeks.<br />
Even though ground-water discharge occurs at discrete<br />
locations, <strong>the</strong> locations can be lumped into two areas in <strong>the</strong><br />
lower valley: (1) <strong>the</strong> valley between Whisky Creek <strong>and</strong> Beatty<br />
Gap (75 ft 3 /s), <strong>and</strong> (2) <strong>the</strong> valley near Kamkaun, Whitehorse,<br />
<strong>and</strong> McReady Springs (73 ft 3 /s) (fig. 7 <strong>and</strong> table 6). The<br />
temporal <strong>and</strong> spatial distribution <strong>of</strong> ground-water discharge in<br />
this subbasin is well understood given <strong>the</strong> multiple synoptic<br />
measurements made when <strong>the</strong> streamflow recorded at<br />
Chiloquin (11501000) was near <strong>the</strong> long-term average flow.<br />
The Sycan River is <strong>the</strong> o<strong>the</strong>r main tributary to <strong>the</strong><br />
Sprague River, but it contributes relatively little baseflow<br />
(historically about 30 ft 3 /s) given its drainage area <strong>of</strong> 563 mi 2 .<br />
The Sycan River is a snowmelt-run<strong>of</strong>f dominated stream, with<br />
peak flows occurring during <strong>the</strong> spring freshet (March–June).<br />
Monthly mean flows at <strong>the</strong> gaging station near Beatty indicate<br />
spring run<strong>of</strong>f flows are significant (400 ft 3 /s), whereas fall<br />
baseflows are minimal. Most tributaries to <strong>the</strong> Sycan River<br />
are ephemeral, contributing flow only during snowmelt<br />
or precipitation events, with ground water being a minor<br />
contributor to streamflow.<br />
The Sycan River originates in <strong>the</strong> forested upl<strong>and</strong>s east<br />
<strong>of</strong> Sycan Marsh on <strong>the</strong> western side <strong>of</strong> Winter Ridge, <strong>and</strong> is<br />
<strong>the</strong> only perennial tributary to Sycan Marsh from <strong>the</strong> east.<br />
At this location, <strong>the</strong> river has <strong>the</strong> characteristics <strong>of</strong> a run<strong>of</strong>fdominated<br />
stream, with peak flows occurring during spring to<br />
early summer <strong>and</strong> comparatively small baseflows in <strong>the</strong> fall.<br />
Long Creek is <strong>the</strong> main tributary west <strong>of</strong> Sycan Marsh <strong>and</strong><br />
has lower peak flows, but a larger component <strong>of</strong> ground-water<br />
discharge than <strong>the</strong> Sycan River above <strong>the</strong> marsh, even though<br />
<strong>the</strong> watershed has about one-half <strong>the</strong> area. <strong>Ground</strong>-water<br />
discharge to <strong>the</strong> Sycan River <strong>and</strong> Long Creek above Sycan<br />
Marsh totals about 24 ft 3 /s.<br />
Preliminary hydrologic analysis <strong>of</strong> Sycan Marsh indicates<br />
that it is predominantly a surface-water dominated wetl<strong>and</strong>.<br />
However, some ground water discharges to <strong>the</strong> marsh from<br />
numerous springs associated with a fen at <strong>the</strong> nor<strong>the</strong>rn part <strong>of</strong><br />
<strong>the</strong> marsh. O<strong>the</strong>r than <strong>the</strong> Sycan River <strong>and</strong> Long Creek, most<br />
tributaries to <strong>the</strong> marsh are ephemeral, contributing flow only<br />
during snowmelt or precipitation events. Nested piezometers<br />
show a downward head gradient in most <strong>of</strong> <strong>the</strong> marsh,<br />
indicating that water moves from <strong>the</strong> surface downward (Leslie<br />
Bach, The Nature Conservancy, oral commun., 2005), which<br />
suggests that <strong>the</strong> marsh is an area <strong>of</strong> ground-water recharge.<br />
The relation between <strong>the</strong> ground-water system <strong>and</strong> Sycan<br />
Marsh was evaluated by means <strong>of</strong> a water balance. Surface<br />
inflows <strong>and</strong> outflows from gaging station data were adjusted<br />
to <strong>the</strong> base period <strong>and</strong> <strong>the</strong>n combined with precipitation <strong>and</strong><br />
marsh evapotranspiration estimates to derive <strong>the</strong> ground-water<br />
gains or losses. The water balance resulted in a slight loss (-10<br />
to -20 ft 3 /s), suggesting that <strong>the</strong> marsh may be a ground-water<br />
recharge area. This is consistent with <strong>the</strong> downward head<br />
gradient seen in piezometer nests. This water balance has a<br />
large uncertainty because <strong>of</strong> <strong>the</strong> evapotranspiration <strong>and</strong> soil<br />
moisture terms.<br />
The lower Sycan subbasin (area between <strong>the</strong> mouth <strong>and</strong><br />
Sycan Marsh) has relatively little ground-water discharge<br />
(21 ft 3 /s), which occurs at two locations. The first is an isolated<br />
spring, Torrent Spring (12 ft 3 /s), 10 mi downstream <strong>of</strong> Sycan<br />
Marsh. The second is from a number <strong>of</strong> springs, seeps, <strong>and</strong><br />
creeks along <strong>the</strong> lower 10 mi <strong>of</strong> <strong>the</strong> river (fig. 7 <strong>and</strong> table 6).<br />
Sprague River Subbasin—Temporal Variations in<br />
<strong>Ground</strong>-<strong>Water</strong> Discharge<br />
Quantifying <strong>the</strong> temporal variations in ground-water<br />
discharge in <strong>the</strong> Sprague River subbasin is difficult due to a<br />
lack <strong>of</strong> data. <strong>Ground</strong> water discharges to a variety <strong>of</strong> spring<br />
complexes <strong>and</strong> spring-fed streams in <strong>the</strong> basin. Present gaging<br />
stations in <strong>the</strong> Sprague River subbasin are not well suited<br />
to provide direct measurement <strong>of</strong> ground-water discharge<br />
variations because <strong>of</strong> <strong>the</strong> effects <strong>of</strong> diversion. However,<br />
some inferences can be made by evaluating late-season<br />
flows at gages on <strong>the</strong> main stem with long periods <strong>of</strong> record.<br />
Gaging stations at Beatty <strong>and</strong> near Chiloquin provide useful<br />
information. However, diversions, tributaries, <strong>and</strong> probable<br />
irrigation return flow affect measurements at <strong>the</strong>se locations.<br />
At Beatty, September mean discharge, <strong>the</strong> best proxy available<br />
for baseflow above that location, varied from about 80 ft 3 /s to<br />
about 180 ft 3 /s during <strong>the</strong> period <strong>of</strong> record from 1954 to 1991.<br />
September mean discharge near Chiloquin (fig. 9) ranged from<br />
less than 150 ft 3 /s to greater than 350 ft 3 /s. Like o<strong>the</strong>r streams,<br />
<strong>the</strong> variations in September mean stream discharge generally<br />
follow climate cycles, with <strong>the</strong> highest flows following multiple<br />
wet years <strong>and</strong> <strong>the</strong> lowest flows following multiple dry years.
<strong>Ground</strong>-<strong>Water</strong> <strong>Hydrology</strong> 27<br />
DISCHARGE, IN CUBIC FEET PER SECOND<br />
500<br />
450<br />
400<br />
350<br />
300<br />
250<br />
200<br />
150<br />
100<br />
50<br />
September mean discharge - Sprague River near Chiloquin<br />
Cumulative departure from average precipitation at Crater Lake (1932-2005)<br />
0<br />
1920 1930 1940 1950 1960 1970 1980 1990 2000<br />
150<br />
125<br />
100<br />
75<br />
50<br />
25<br />
0<br />
-25<br />
-50<br />
CUMULATIVE DEPARTURE FROM AVERAGE PRECIPITATION, IN INCHES<br />
Figure 9. September mean discharge <strong>of</strong> <strong>the</strong> Sprague River near Chiloquin, <strong>Oregon</strong> (USGS gaging station number<br />
11501000), <strong>and</strong> <strong>the</strong> cumulative departure from average precipitation at Crater Lake, <strong>Oregon</strong>.<br />
Williamson River Subbasin—Geographic Distribution <strong>of</strong><br />
<strong>Ground</strong>-<strong>Water</strong> Discharge<br />
The Williamson River originates from springs just east<br />
<strong>and</strong> south <strong>of</strong> Taylor Butte. From its source, <strong>the</strong> river flows<br />
almost due north through a wide, sediment-filled valley for 35<br />
mi before flowing west for 5 mi, where it historically spread<br />
over a delta into <strong>Klamath</strong> Marsh. The natural channel at <strong>the</strong><br />
entrance to <strong>the</strong> marsh no longer exists, however, because <strong>the</strong><br />
river has been diked <strong>and</strong> redirected. Most tributaries to <strong>the</strong><br />
upper Williamson River originate along <strong>the</strong> flanks <strong>of</strong> Yamsay<br />
Mountain <strong>and</strong> <strong>the</strong> ridge to <strong>the</strong> south <strong>and</strong> are ephemeral, with<br />
flows occurring during spring snowmelt. However, significant<br />
springs contribute water directly to <strong>the</strong> upper Williamson<br />
River, which, as a result, has robust baseflow in addition to a<br />
run<strong>of</strong>f signal in its hydrograph during spring (fig. 10). Data<br />
recorded below Sheep Creek (station 11491400) indicates that<br />
flows average about 90 ft 3 /s during spring <strong>and</strong> 57 ft 3 /s in fall<br />
(table 6).<br />
The spatial distribution <strong>of</strong> ground-water discharge to<br />
<strong>the</strong> <strong>Upper</strong> Williamson River has been largely identified<br />
from synoptic measurements (fig. 7 <strong>and</strong> table 6). <strong>Ground</strong><br />
water discharges directly into <strong>the</strong> <strong>Upper</strong> Williamson River<br />
at several large springs upstream from <strong>the</strong> gage below Sheep<br />
Creek (station 11491400) <strong>and</strong> averages 54 ft 3 /s, with Wickiup<br />
Spring (24 ft 3 /s) being <strong>the</strong> largest single contributor (table 6).<br />
An additional 26 ft 3 /s <strong>of</strong> gain occurs between Sheep Creek<br />
<strong>and</strong> <strong>the</strong> marsh. Total ground-water discharge in <strong>the</strong> area is<br />
OR19-0048_fig09<br />
about 80 ft 3 / s. The knowledge <strong>of</strong> <strong>the</strong> temporal variations in<br />
ground-water discharge to <strong>the</strong> <strong>Upper</strong> Williamson River is good<br />
upstream from <strong>the</strong> Sheep Creek gaging station owing to data<br />
from <strong>the</strong> long-term records at that site. However, between<br />
Sheep Creek <strong>and</strong> <strong>Klamath</strong> Marsh, no continuous streamflow<br />
record exists.<br />
The only o<strong>the</strong>r perennial tributary that reaches <strong>Klamath</strong><br />
Marsh is <strong>the</strong> spring-fed Big Springs Creek. However, even this<br />
creek may go dry during successive drought years (Newcomb<br />
<strong>and</strong> Hart, 1958). Surprisingly, Big Springs Creek shows a<br />
relatively flashy response to snowmelt <strong>and</strong> rainfall events<br />
that is atypical for spring-fed streams. Presumably, this rapid<br />
response is due to <strong>the</strong> ability <strong>of</strong> local rainfall <strong>and</strong> snowmelt to<br />
move easily through <strong>the</strong> very permeable pumice soils. <strong>Water</strong><br />
in most o<strong>the</strong>r perennial streams draining to <strong>the</strong> marsh from <strong>the</strong><br />
eastern side <strong>of</strong> <strong>the</strong> Cascades infiltrates into <strong>the</strong> pumice plain<br />
before reaching <strong>the</strong> marsh. <strong>Water</strong> in S<strong>and</strong> <strong>and</strong> Scott Creeks<br />
would reach <strong>the</strong> marsh, but it is diverted to irrigate pasture<br />
l<strong>and</strong>s on <strong>the</strong> western edge <strong>of</strong> <strong>the</strong> marsh.<br />
<strong>Ground</strong>-water discharge to Big Springs, S<strong>and</strong>, <strong>and</strong> Scott<br />
Creeks, <strong>and</strong> o<strong>the</strong>r tributaries west <strong>of</strong> <strong>Klamath</strong> Marsh, totals<br />
about 78 ft 3 /s. About 12 ft 3 /s <strong>of</strong> <strong>the</strong> total discharge is to Miller<br />
<strong>and</strong> Sink Creeks, which lose <strong>the</strong>ir flow through infiltration into<br />
<strong>the</strong> pumice plain before reaching <strong>the</strong> marsh. Discharge to <strong>the</strong>se<br />
streams was estimated from miscellaneous measurements<br />
<strong>and</strong> short-term gaging station data using index regression.<br />
All o<strong>the</strong>r tributaries are ei<strong>the</strong>r ephemeral, or infiltrate into <strong>the</strong><br />
pumice plain.
28 <strong>Ground</strong>-<strong>Water</strong> <strong>Hydrology</strong> <strong>of</strong> <strong>the</strong> <strong>Upper</strong> <strong>Klamath</strong> <strong>Basin</strong>, <strong>Oregon</strong> <strong>and</strong> California<br />
200<br />
400<br />
DISCHARGE, IN CUBIC FEET PER SECOND<br />
180<br />
160<br />
140<br />
120<br />
100<br />
80<br />
60<br />
40<br />
Monthly mean discharge<br />
20<br />
September mean discharge<br />
Cumulative departure from average precipitation at Crater Lake (1932-2005)<br />
0<br />
1970 1975 1980 1985 1990 1995 2000<br />
350<br />
300<br />
250<br />
200<br />
150<br />
100<br />
50<br />
0<br />
CUMULATIVE DEPARTURE FROM AVERAGE PRECIPITATION<br />
AT CRATER LAKE, IN INCHES<br />
Figure 10. Monthly mean discharge <strong>and</strong> September mean discharge <strong>of</strong> <strong>the</strong> Williamson River below Sheep Creek near<br />
Lenz, <strong>Oregon</strong> (USGS gaging station number 11491400), <strong>and</strong> <strong>the</strong> cumulative departure from average precipitation at<br />
Crater Lake, <strong>Oregon</strong>.<br />
A mass balance indicates that average net annual groundwater<br />
discharge directly to <strong>Klamath</strong> Marsh was approximately<br />
50 ft 3 /s between 1971 <strong>and</strong> 2000. This estimate is based<br />
on available gage data for tributary inputs, estimates for<br />
evapotranspiration, <strong>and</strong> direct precipitation on <strong>the</strong> marsh. The<br />
analysis assumes that <strong>the</strong> net change in water stored in <strong>the</strong><br />
marsh during <strong>the</strong> 30-year period was negligible. The spatial<br />
distribution <strong>of</strong> ground-water discharge directly to <strong>the</strong> marsh is<br />
unknown.<br />
The hydrograph <strong>of</strong> <strong>the</strong> Williamson River at <strong>the</strong> outlet <strong>of</strong><br />
<strong>Klamath</strong> Marsh near Kirk (station 11493500, not shown) has<br />
a run<strong>of</strong>f signal, presumably from ephemeral tributaries <strong>and</strong><br />
direct local run<strong>of</strong>f from <strong>the</strong> marsh. Flow <strong>of</strong> <strong>the</strong> Williamson<br />
River at <strong>the</strong> outlet <strong>of</strong> <strong>the</strong> marsh ceases during most summers<br />
due to <strong>the</strong> large amount <strong>of</strong> evapotranspiration in <strong>the</strong> marsh.<br />
South <strong>of</strong> <strong>the</strong> gaging station near Kirk (altitude 4,483 ft),<br />
<strong>the</strong> Williamson River descends into a narrow, steep canyon<br />
as it drops in elevation. Small seeps <strong>and</strong> springs appear in<br />
<strong>the</strong> canyon walls near an altitude <strong>of</strong> 4,220 ft. As <strong>the</strong> river<br />
exits <strong>the</strong> canyon, three spring-fed streams contribute most <strong>of</strong><br />
<strong>the</strong> baseflow to <strong>the</strong> Williamson River: Spring Creek, Larkin<br />
Creek, <strong>and</strong> Larkin Springs. Hydrographs <strong>of</strong> <strong>the</strong> Williamson<br />
River below <strong>the</strong>se streams <strong>and</strong> above <strong>the</strong> Sprague River show<br />
a system with a large component <strong>of</strong> ground-water discharge<br />
that responds relatively slowly to precipitation <strong>and</strong> snowmelt<br />
events <strong>and</strong> that has gradual accession <strong>and</strong> recession curves.<br />
OR19-0048_fig10<br />
Peak flows commonly exceed 1,000 ft 3 /s <strong>and</strong> usually occur in<br />
March. Low flows consistently range near 300 to 350 ft 3 /s <strong>and</strong><br />
occur during summer. Gains to <strong>the</strong> river due to ground-water<br />
discharge below <strong>Klamath</strong> Marsh occur at Spring Creek (300<br />
ft 3 /s), Larkin Creek (10 ft 3 /s), Larkin Springs (10 ft 3 /s), <strong>and</strong><br />
miscellaneous small springs (28 ft 3 /s) above Larkin Spring<br />
(table 6).<br />
Williamson River Subbasin—Temporal Variations in<br />
<strong>Ground</strong>-<strong>Water</strong> Discharge<br />
About 78 percent <strong>of</strong> <strong>the</strong> 67 ft 3 /s mean annual discharge<br />
<strong>of</strong> <strong>the</strong> uppermost Williamson River is composed <strong>of</strong> ground<br />
water. Information on fluctuations in ground-water discharge<br />
to <strong>the</strong> upper Williamson River comes largely from <strong>the</strong> gage<br />
downstream from Sheep Creek (station 11491400) operated<br />
since 1974. August–September flow <strong>of</strong> <strong>the</strong> upper Williamson<br />
River, which is mostly spring discharge, averages 52 ft 3 /s.<br />
Synoptic measurements in November 2002 showed 54 ft 3 /s<br />
ground-water discharge to <strong>the</strong> reach (table 6). A graph <strong>of</strong><br />
monthly mean flows <strong>of</strong> <strong>the</strong> Williamson River below Sheep<br />
Creek (fig. 10) shows that <strong>the</strong> base flow, as represented by<br />
September mean discharge, varies by a factor <strong>of</strong> nearly 2,<br />
from 37 to 70 ft 3 /s. Comparing September mean flows with<br />
precipitation at Crater Lake (fig. 10) shows that this variation<br />
correlates with climate cycles. A plot <strong>of</strong> September flow <strong>of</strong><br />
<strong>the</strong> Williamson River at Lenz <strong>and</strong> <strong>the</strong> cumulative departure<br />
from average precipitation at Crater Lake shows a positive<br />
linear relation with a correlation coefficient <strong>of</strong> 0.79 (fig. 11).
<strong>Ground</strong>-<strong>Water</strong> <strong>Hydrology</strong> 29<br />
SEPTEMBER MEAN DISCHARGE,<br />
IN CUBIC FEET PER SECOND<br />
75<br />
70<br />
65<br />
r = 0.79<br />
60<br />
55<br />
50<br />
45<br />
40<br />
35<br />
30<br />
-20 -10 0 10 20 30 40 50 60 70<br />
CUMULATIVE DEPARTURE FROM AVERAGE PRECIPITATION<br />
AT CRATER LAKE, IN INCHES<br />
Figure 11. Relation between <strong>the</strong> September mean<br />
discharge <strong>of</strong> <strong>the</strong> Williamson River below Sheep<br />
Creek near Lenz, <strong>Oregon</strong> (USGS gaging station<br />
number 11491400), <strong>and</strong> <strong>the</strong> cumulative departure<br />
from average precipitation at Crater Lake, <strong>Oregon</strong>.<br />
Part <strong>of</strong> <strong>the</strong> observed variation in September mean flow could<br />
be due to variations in surface-water diversions, which also<br />
are correlated with climate, as irrigation dem<strong>and</strong>s are less<br />
during wet periods <strong>and</strong> greater during dry periods. Given <strong>the</strong><br />
small irrigated area above <strong>the</strong> gage (about 3,000 acres), <strong>the</strong><br />
probable climate-driven variation in September diversions is<br />
small compared to <strong>the</strong> observed variations in streamflow. This<br />
indicates that most <strong>of</strong> <strong>the</strong> observed variation in September<br />
mean flow can be attributed to fluctuations in ground-water<br />
discharge.<br />
Newcomb <strong>and</strong> Hart (1958) showed that ground-water<br />
discharge to Big Springs Creek varies from zero to about 90<br />
ft 3 /s in response to drought cycles. Meinzer (1927) shows <strong>the</strong><br />
discharge <strong>of</strong> Big Springs Creek decreasing from 61 to 11.6<br />
ft 3 /s between 1914 <strong>and</strong> 1925 in a more or less linear manner in<br />
response to a general drying climate trend. La Marche (2002)<br />
noted that Big Springs Creek also shows seasonal fluctuations<br />
in response to annual snow melt. This suggests that Big<br />
Springs Creek is fed by a local, possibly perched, flow system.<br />
The area <strong>of</strong> <strong>the</strong> lower Williamson River, between <strong>the</strong> gage<br />
at Kirk <strong>and</strong> <strong>the</strong> confluence with <strong>the</strong> Sprague River, is one <strong>of</strong><br />
<strong>the</strong> major ground-water discharge areas in <strong>the</strong> upper <strong>Klamath</strong><br />
<strong>Basin</strong>. About 86 percent <strong>of</strong> <strong>the</strong> ground-water discharge in this<br />
area is to Spring Creek, a short tributary to <strong>the</strong> Williamson<br />
River that is fed entirely by springs. The remaining groundwater<br />
discharge is to Larkin Creek, Larkin Springs, <strong>and</strong> o<strong>the</strong>r<br />
nearby springs.<br />
Spring Creek is particularly important because it provides<br />
much <strong>of</strong> <strong>the</strong> flow to <strong>the</strong> Williamson River, an important source<br />
<strong>of</strong> water to <strong>Upper</strong> <strong>Klamath</strong> Lake, during summer. Many<br />
measurements <strong>of</strong> instantaneous streamflow have been made<br />
along Spring Creek during <strong>the</strong> past 100 years by <strong>the</strong> USGS<br />
<strong>and</strong> OWRD. Spring Creek flow varies with time <strong>and</strong> correlates<br />
with climate (fig. 12). The correlation coefficient between<br />
Spring Creek flow <strong>and</strong> <strong>the</strong> cumulative departure from average<br />
precipitation at Crater Lake between 1932 <strong>and</strong> 2002 is 0.72.<br />
Spring Creek is unaffected by surface-water diversions, <strong>and</strong><br />
ground-water pumpage in <strong>the</strong> area is not enough to cause <strong>the</strong><br />
observed discharge variations.<br />
A more continuous measure <strong>of</strong> <strong>the</strong> ground-water<br />
discharge variations in <strong>the</strong> area can be developed using data<br />
from streamflow gages on <strong>the</strong> Williamson River near Kirk<br />
(11493500), <strong>the</strong> Sprague River near Chiloquin (11501000),<br />
<strong>and</strong> <strong>the</strong> Williamson River below <strong>the</strong> Sprague River, near<br />
Chiloquin (11502500). If <strong>the</strong> streamflow at <strong>the</strong> former two<br />
gages is subtracted from <strong>the</strong> latter, <strong>the</strong> positive residual<br />
(indicating a gain in streamflow between <strong>the</strong> gages) is due<br />
primarily to ground-water discharge, most <strong>of</strong> which is from<br />
Spring Creek. The ground-water discharge in this area, on <strong>the</strong><br />
basis <strong>of</strong> September mean flows, averages about 306 ft 3 /s, <strong>and</strong><br />
ranges from about 250 to 400 ft 3 /s. The uncertainty <strong>of</strong> this<br />
estimate (on <strong>the</strong> basis <strong>of</strong> estimated gage error) is only about<br />
±30 ft 3 /s. This analysis is complicated by <strong>the</strong> fact that <strong>the</strong>re are<br />
ungaged diversions from <strong>the</strong> Sprague River below <strong>the</strong> gage at<br />
Chiloquin, most notably <strong>the</strong> Modoc Irrigation District canal.<br />
Diversion records for <strong>the</strong> Modoc Canal are available from<br />
1915 to 1924, as are miscellaneous discharge measurements<br />
throughout <strong>the</strong> 1980s. Measurements <strong>of</strong> September flow<br />
average about 25 ft 3 /s. Accounting for this ungaged diversion<br />
increases <strong>the</strong> average ground-water discharge in this area<br />
based on gage data to 331 ft 3 /s. This figure compares<br />
favorably with <strong>the</strong> 350 ft 3 /s estimate based on synoptic <strong>and</strong><br />
miscellaneous flow measurements. The temporal variations<br />
generally correspond to decadal precipitation cycles (fig. 12),<br />
<strong>and</strong> comparing <strong>the</strong> calculated September mean groundwater<br />
discharge <strong>and</strong> <strong>the</strong> cumulative departure from average<br />
precipitation at Crater Lake results in a correlation coefficient<br />
<strong>of</strong> about 0.68.<br />
<strong>Upper</strong> <strong>Klamath</strong> Lake Subbasin—Geographic Distribution<br />
<strong>of</strong> <strong>Ground</strong>-<strong>Water</strong> Discharge<br />
The <strong>Upper</strong> <strong>Klamath</strong> Lake subbasin encompasses 723<br />
mi 2 above <strong>the</strong> outlet <strong>of</strong> <strong>Upper</strong> <strong>Klamath</strong> Lake, excluding <strong>the</strong><br />
Williamson <strong>and</strong> Sprague drainages. The subbasin includes<br />
<strong>Upper</strong> <strong>Klamath</strong> Lake, <strong>the</strong> broad, flat Wood River valley to<br />
<strong>the</strong> north <strong>and</strong> <strong>the</strong> adjacent upl<strong>and</strong>s including <strong>the</strong> Cascade<br />
Range to <strong>the</strong> west, Mt. Mazama (<strong>the</strong> Crater Lake highl<strong>and</strong>s)<br />
to <strong>the</strong> north, <strong>and</strong> multiple fault-block mountains <strong>and</strong> <strong>the</strong><br />
Williamson River delta to <strong>the</strong> east. The upl<strong>and</strong>s on <strong>the</strong><br />
eastern side rise abruptly from <strong>the</strong> valley floor along northsouth<br />
trending faults. The Wood River Valley is filled with<br />
Quaternary sediment, much <strong>of</strong> which is fine-grained <strong>and</strong> has<br />
low permeability. Major hydrologic features include <strong>the</strong> Wood<br />
River, <strong>Upper</strong> <strong>Klamath</strong> <strong>and</strong> Agency Lakes, <strong>and</strong> Sevenmile<br />
Creek.<br />
OR19-0048_fig11
30 <strong>Ground</strong>-<strong>Water</strong> <strong>Hydrology</strong> <strong>of</strong> <strong>the</strong> <strong>Upper</strong> <strong>Klamath</strong> <strong>Basin</strong>, <strong>Oregon</strong> <strong>and</strong> California<br />
GROUND-WATER INFLOW, IN CUBIC FEET PER SECOND<br />
500<br />
450<br />
400<br />
350<br />
300<br />
250<br />
200<br />
150<br />
Spring Creek discharge measurements<br />
Calculated September mean inflow between Kirk <strong>and</strong> Chiloquin<br />
Cumulative departure from precipitation at Crater Lake 1913-2005—<br />
Dotted where estimated from <strong>Klamath</strong> Falls data.<br />
350<br />
300<br />
250<br />
200<br />
150<br />
100<br />
50<br />
0<br />
-50<br />
-100<br />
CUMULATIVE DEPARTURE FROM AVERAGE PRECIPITATION, IN INCHES<br />
100<br />
1910<br />
1920<br />
1930<br />
1940<br />
1950<br />
1960<br />
1970<br />
1980<br />
1990<br />
2000<br />
-150<br />
Figure 12. Discharge measurements <strong>of</strong> Spring Creek, estimated ground-water discharge to <strong>the</strong> lower Williamson<br />
River between Kirk <strong>and</strong> Chiloquin, <strong>and</strong> cumulative departure from average precipitation at Crater Lake, <strong>Oregon</strong>. (Spring<br />
Creek measurements from Hubbard <strong>and</strong> o<strong>the</strong>rs, 1993, 1994; U.S. Geological Survey, various dates; <strong>and</strong> USGS <strong>and</strong> OWRD<br />
unpub. data; ground-water discharge estimated as <strong>the</strong> difference between <strong>the</strong> flow <strong>of</strong> <strong>the</strong> Williamson River below<br />
<strong>the</strong> Sprague River [gaging station 11502500] <strong>and</strong> <strong>the</strong> sum <strong>of</strong> flows <strong>of</strong> <strong>the</strong> Williamson River near Kirk [11493500] <strong>and</strong> <strong>the</strong><br />
Sprague River near Chiloquin [11501000].)<br />
The general hydrology <strong>of</strong> <strong>the</strong> subbasin is dominated by<br />
ground-water discharge from spring complexes coincident<br />
with fault scarps at <strong>the</strong> western <strong>and</strong> eastern edges <strong>of</strong> <strong>the</strong> Wood<br />
River Valley <strong>and</strong> <strong>Upper</strong> <strong>Klamath</strong> Lake (fig. 7). About one-half<br />
<strong>of</strong> <strong>the</strong> ground-water discharge in <strong>the</strong> subbasin occurs to <strong>the</strong><br />
Wood River <strong>and</strong> its tributaries (table 6). Approximately onethird<br />
<strong>of</strong> <strong>the</strong> discharge occurs directly into <strong>Upper</strong> <strong>Klamath</strong> Lake<br />
at known <strong>and</strong> unknown locations. The remaining ground-water<br />
discharge occurs in <strong>the</strong> tributaries draining <strong>the</strong> eastern flank <strong>of</strong><br />
<strong>the</strong> Cascade Range.<br />
The Wood River receives <strong>the</strong> largest amount <strong>of</strong> ground<br />
water in <strong>the</strong> <strong>Upper</strong> <strong>Klamath</strong> Lake subbasin (490 ft 3 /s), with<br />
most <strong>of</strong> <strong>the</strong> discharge occurring at discrete spring complexes<br />
along <strong>the</strong> fault scarp on <strong>the</strong> eastern boundary <strong>of</strong> <strong>the</strong> valley<br />
(table 6). Two tributaries originating on <strong>the</strong> flanks <strong>of</strong> <strong>the</strong><br />
Crater Lake highl<strong>and</strong>, Annie <strong>and</strong> Sun Creeks, contribute<br />
roughly 14 percent <strong>of</strong> ground water discharged into <strong>the</strong> river.<br />
The estimates were derived from miscellaneous measurements<br />
taken in <strong>the</strong> Wood River subbasin, with subsequent regressions<br />
to index gages.<br />
<strong>Ground</strong> water discharges from <strong>the</strong> Cascade Range to<br />
tributaries along <strong>the</strong> western margin <strong>of</strong> <strong>the</strong> subbasin at a rate <strong>of</strong><br />
about 120 ft 3 /s (table 6). The majority <strong>of</strong> that flow originates<br />
from tributary springs in <strong>the</strong> valley along <strong>the</strong> western fault<br />
scarp OR19-0048_fig12 <strong>of</strong> <strong>the</strong> region. The creek with <strong>the</strong> largest watershed<br />
in this subarea, Fourmile Creek south <strong>of</strong> Pelican Butte,<br />
contributes only 2 ft 3 /s <strong>of</strong> baseflow to <strong>the</strong> region. Estimates<br />
were derived from short-term gaging station records <strong>and</strong><br />
regression to index stations elsewhere in <strong>the</strong> basin.<br />
<strong>Ground</strong>-water inflow to <strong>Upper</strong> <strong>Klamath</strong> Lake was<br />
estimated using a monthly water balance for <strong>the</strong> 1965 through<br />
1967 water years. Hubbard (1970) measured or calculated<br />
all tributary inflows <strong>and</strong> outflows from <strong>the</strong> lake, including<br />
streamflow, diversions, precipitation, evapotranspiration, <strong>and</strong><br />
agricultural return flows. Hubbard’s monthly estimates <strong>of</strong><br />
ground-water inflow to <strong>the</strong> lake <strong>of</strong> averaged about 350 ft 3 /s<br />
from 1965 to 1967 (<strong>the</strong> median value is about 330 ft 3 /s). This<br />
is about 15 percent <strong>of</strong> <strong>the</strong> 2,330 ft 3 /s average total inflow to<br />
<strong>the</strong> lake during that period. Hubbard’s estimated ground-water<br />
discharge to <strong>the</strong> lake compares favorably with estimates <strong>of</strong><br />
<strong>the</strong> difference between <strong>Upper</strong> <strong>Klamath</strong> Lake inflows <strong>and</strong><br />
outflows (such as, ground-water inflow) by o<strong>the</strong>rs such as<br />
Cooper (2004) that cover a much longer base period (30 years<br />
compared to 3 years). Hubbard’s estimate <strong>of</strong> average groundwater<br />
inflow was revised downward to about 320 ft 3 /s by <strong>the</strong><br />
Bureau <strong>of</strong> Reclamation (2005) using updated stage-capacity<br />
curves for <strong>the</strong> lake. Although many springs have been mapped<br />
around <strong>the</strong> margins <strong>of</strong> <strong>Upper</strong> <strong>Klamath</strong> Lake, <strong>the</strong>ir combined<br />
discharge is much less than <strong>the</strong> estimated ground-water inflow.<br />
Consequently, <strong>the</strong> spatial distribution <strong>of</strong> much <strong>of</strong> <strong>the</strong> groundwater<br />
inflow directly to <strong>the</strong> lake is unknown.
<strong>Ground</strong>-<strong>Water</strong> <strong>Hydrology</strong> 31<br />
<strong>Upper</strong> <strong>Klamath</strong> Lake Subbasin—Temporal Variations in<br />
<strong>Ground</strong>-<strong>Water</strong> Discharge<br />
Temporal variations in ground-water discharge to Annie<br />
Spring can be evaluated using data from <strong>the</strong> gaging station<br />
(11503000) that has been operated on Annie Creek just below<br />
<strong>the</strong> spring since 1977 (fig. 13). The discharge from Annie<br />
Spring is small, averaging about 3 ft 3 /s. It is included here to<br />
illustrate <strong>the</strong> behavior <strong>of</strong> smaller flow systems. Annie Spring<br />
shows temporal variations that are different from those <strong>of</strong> <strong>the</strong><br />
large-scale systems discussed previously. The lowest flows<br />
<strong>of</strong> large-scale spring systems are typically August through<br />
September. The lowest flows <strong>of</strong> Annie Creek, in contrast, are<br />
January through March. The likely cause is that Annie Spring<br />
is fed by ground water recently recharged <strong>and</strong> following very<br />
short flow paths, <strong>and</strong> consequently much <strong>of</strong> <strong>the</strong> water feeding<br />
<strong>the</strong> springs is frozen as snow during <strong>the</strong> winter months. The<br />
annual low flows <strong>of</strong> large-scale systems typically increase<br />
each year during periods <strong>of</strong> successive wetter-than-average<br />
years. This is less pronounced with Annie Creek. A graph <strong>of</strong><br />
monthly <strong>and</strong> January to March mean flows <strong>of</strong> Annie Spring<br />
(fig. 13) shows that it peaks before <strong>the</strong> cumulative departure<br />
from average precipitation curve. This is because <strong>of</strong> <strong>the</strong> lack<br />
<strong>of</strong> storage effects in <strong>the</strong> small flow system. Annie Spring <strong>and</strong><br />
similar small-scale flow systems in <strong>the</strong> upper <strong>Klamath</strong> <strong>Basin</strong><br />
have <strong>the</strong> characteristics <strong>of</strong> run<strong>of</strong>f-dominated streams.<br />
Gaging stations have been operated intermittently on<br />
<strong>the</strong> Wood River since 1913. However, data are not easily<br />
compared because <strong>the</strong> stations have been operated at different<br />
locations that are affected differently by tributary inflow,<br />
return flow, <strong>and</strong> diversion, <strong>and</strong> <strong>the</strong> periods <strong>of</strong> record are short,<br />
ranging from roughly 1 to 14 years. Although <strong>the</strong> gaging<br />
station data do not provide a continuous long-term record <strong>of</strong><br />
ground-water discharge, <strong>the</strong>y do provide useful information<br />
on <strong>the</strong> magnitude <strong>and</strong> timing <strong>of</strong> ground-water discharge<br />
fluctuations. A USGS gaging station at Fort <strong>Klamath</strong><br />
(11504000) operated intermittently from 1913 to 1936 shows<br />
a probable drought-related decrease in annual mean flow from<br />
approximately 310 to 140 ft 3 /s during its period <strong>of</strong> operation<br />
(fig. 14). Ano<strong>the</strong>r USGS gaging station operated 4 mi south<br />
<strong>of</strong> Fort <strong>Klamath</strong> (11504100) from 1965 to 1967 shows a<br />
climate-related decrease in annual mean flow from 350 to<br />
290 ft 3 /s during that period. A gaging station was operated in<br />
<strong>the</strong> early 1990s, <strong>and</strong> recently near <strong>the</strong> headwaters springs <strong>of</strong><br />
<strong>the</strong> Wood River (about 1 mile downstream at Dixon Road)<br />
by Graham Mat<strong>the</strong>ws <strong>and</strong> Associates (GMA). Variations<br />
in ground-water discharge to <strong>the</strong> Wood River headwater<br />
springs can be evaluated using <strong>the</strong> GMA data (provided by<br />
Graham Mat<strong>the</strong>ws, written commun., May 13, 2003) along<br />
with a multitude <strong>of</strong> miscellaneous instantaneous discharge<br />
measurements made over several decades by USGS <strong>and</strong><br />
OWRD (fig. 14). The measurements near <strong>the</strong> headwaters<br />
DISCHARGE, IN CUBIC FEET PER SECOND<br />
16<br />
14<br />
12<br />
10<br />
8<br />
6<br />
4<br />
2<br />
Monthly mean discharge<br />
January to March mean discharge<br />
Cumulative departure from average precipitation at Crater Lake (1932-2005)<br />
0<br />
1975 1980 1985 1990 1995 2000<br />
150<br />
100<br />
50<br />
0<br />
-50<br />
-100<br />
CUMULATIVE DEPARTURE FROM AVERAGE PRECIPITATION, IN INCHES<br />
Figure 13. Monthly mean discharge <strong>and</strong> January to March mean discharge <strong>of</strong> Annie Spring near Crater Lake,<br />
<strong>Oregon</strong> (USGS gaging station number 11503000), <strong>and</strong> <strong>the</strong> cumulative departure from average precipitation at Crater<br />
Lake.
32 <strong>Ground</strong>-<strong>Water</strong> <strong>Hydrology</strong> <strong>of</strong> <strong>the</strong> <strong>Upper</strong> <strong>Klamath</strong> <strong>Basin</strong>, <strong>Oregon</strong> <strong>and</strong> California<br />
450<br />
300<br />
DISCHARGE, IN CUBIC FEET PER SECOND<br />
400<br />
350<br />
300<br />
250<br />
200<br />
150<br />
100<br />
50<br />
0<br />
1910<br />
1915<br />
1920<br />
1925<br />
1930<br />
1935<br />
1940<br />
1945<br />
1950<br />
1955<br />
Syn<strong>the</strong>tic hydrograph <strong>of</strong> discharge at Dixon Road<br />
Monthly mean flow at Dixon Road (GMA gage)<br />
Instantaneous discharge measurements at Dixon Road<br />
Monthly mean flow at Weed Road (USGS Gage 11504100)<br />
Monthly mean flow at State Hwy 62 (USGS Gage 1504000)<br />
Cumulative departure from precipitation at Crater Lake 1913-2005—<br />
Dotted where estimated from <strong>Klamath</strong> Falls data.<br />
1960<br />
1965<br />
1970<br />
1975<br />
1980<br />
1985<br />
1990<br />
1995<br />
2000<br />
2005<br />
250<br />
200<br />
150<br />
100<br />
50<br />
0<br />
-50<br />
-100<br />
CUMULATIVE DEPARTURE FROM AVERAGE PRECIPITATION, IN INCHES<br />
Figure 14. Discharge <strong>of</strong> <strong>the</strong> Wood River as measured or estimated at various sites, <strong>and</strong> <strong>the</strong> cumulative departure<br />
from average precipitation at Crater Lake, <strong>Oregon</strong>. (Monthly mean flow near headwaters from Graham Mat<strong>the</strong>ws,<br />
GMA, written commun. May 13, 2003; flow measurements near headwaters from USGS, various dates, <strong>and</strong> OWRD<br />
unpub. data; estimated discharge at Dixon road derived from regression with Fall River in upper Deschutes <strong>Basin</strong><br />
[USGS gaging station 14057500], a similar size spring-fed stream.)<br />
springs are largely unaffected by tributary inflow <strong>and</strong><br />
diversions, <strong>and</strong> are not noticeably influenced by <strong>the</strong> presently<br />
small amount <strong>of</strong> ground-water pumping in <strong>the</strong> area. Variations<br />
in ground-water discharge to <strong>the</strong> Wood River headwater<br />
springs correlate well with <strong>the</strong> cumulative departure from<br />
average precipitation at Crater Lake (r = 0.75). Measurements<br />
show <strong>the</strong> discharge <strong>of</strong> Wood River near <strong>the</strong> headwaters springs<br />
increasing from 180 to 320 ft 3 /s during wet conditions in <strong>the</strong><br />
early 1980s, <strong>and</strong> <strong>the</strong>n decreasing from 320 to 160 ft 3 /s owing<br />
to drought in <strong>the</strong> late 1980s <strong>and</strong> early 1990s. This reduction in<br />
ground-water discharge to this single spring complex applied<br />
over 1 year equates to 114,000 acre-ft <strong>of</strong> water.<br />
A syn<strong>the</strong>tic hydrograph <strong>of</strong> <strong>the</strong> Wood River near <strong>the</strong><br />
headwaters springs can be created by using <strong>the</strong> relation<br />
between Wood River discharge measurements <strong>and</strong> concurrent<br />
daily mean flows from <strong>the</strong> gaging station on Fall River<br />
(14057500), a similar-scale spring-fed stream about 70 mi<br />
north in <strong>the</strong> Deschutes <strong>Basin</strong> (fig. 14). The relation can be<br />
modeled using a second order polynomial with an R 2 <strong>of</strong> 0.80.<br />
This syn<strong>the</strong>tic hydrograph provides a reasonable depiction<br />
<strong>of</strong> <strong>the</strong> continuous temporal variations in <strong>the</strong> discharge <strong>of</strong> <strong>the</strong><br />
Wood River headwaters springs.<br />
Temporal variations in ground-water discharge directly<br />
to <strong>Upper</strong> <strong>Klamath</strong> Lake have not been measured. Given <strong>the</strong><br />
magnitude <strong>of</strong> <strong>the</strong> inflow (320 to 350 ft 3 /s), temporal variations<br />
can be inferred from o<strong>the</strong>r springs in <strong>the</strong> area with comparable<br />
discharge rates <strong>and</strong> flow-path lengths (such as Wood River<br />
Springs).<br />
Lost River Subbasin—Geographic Distribution <strong>of</strong><br />
<strong>Ground</strong>-<strong>Water</strong> Discharge<br />
The Lost River subbasin occupies about 1,650 mi 2<br />
sou<strong>the</strong>ast <strong>of</strong> <strong>Upper</strong> <strong>Klamath</strong> Lake. In its natural state, <strong>the</strong><br />
Lost River subbasin had no outlet <strong>and</strong> it drained internally.<br />
<strong>Water</strong> occasionally flowed to <strong>the</strong> subbasin, however, from <strong>the</strong><br />
<strong>Klamath</strong> River during floods through a slough connecting <strong>the</strong><br />
two drainages south <strong>of</strong> <strong>Klamath</strong> Falls (La Rue, 1922). With<br />
<strong>the</strong> development <strong>of</strong> Reclamation’s <strong>Klamath</strong> Project <strong>and</strong> <strong>the</strong><br />
construction <strong>of</strong> <strong>the</strong> Lost River diversion dam <strong>and</strong> channel<br />
(fig. 3), controlled flow between <strong>the</strong> <strong>Klamath</strong> <strong>and</strong> Lost Rivers<br />
in both directions now occurs. Major hydrologic features in<br />
this subbasin include Clear Lake <strong>and</strong> Gerber Reservoirs in <strong>the</strong><br />
upl<strong>and</strong>s, <strong>the</strong> Lost River, <strong>and</strong> <strong>the</strong> Tule Lake Sump.<br />
OR19-0048_fig14
<strong>Ground</strong>-<strong>Water</strong> <strong>Hydrology</strong> 33<br />
The Lost River proper originates at <strong>the</strong> outlet <strong>of</strong> Clear<br />
Lake Reservoir in <strong>the</strong> sou<strong>the</strong>astern part <strong>of</strong> <strong>the</strong> basin. From<br />
<strong>the</strong>re <strong>the</strong> river flows northwest, dropping from <strong>the</strong> plateau<br />
containing Clear Lake into <strong>the</strong> Langell Valley where <strong>the</strong> river<br />
flows to <strong>the</strong> town <strong>of</strong> Bonanza. From <strong>the</strong>re it flows west into<br />
Poe Valley <strong>and</strong> subsequently through Olene Gap into <strong>the</strong><br />
<strong>Klamath</strong> Valley before turning sou<strong>the</strong>ast <strong>and</strong> terminating in <strong>the</strong><br />
Tule Lake Sump in California.<br />
The hydrology <strong>of</strong> <strong>the</strong> Lost River subbasin is run<strong>of</strong>f<br />
dominated above Clear Lake <strong>and</strong> Gerber Reservoirs. The<br />
drainage area <strong>of</strong> Clear Lake consists <strong>of</strong> a broad, low relief,<br />
volcanic plateau with a mean altitude <strong>of</strong> roughly 5,000 ft<br />
covering more than 750 mi 2 south <strong>and</strong> east <strong>of</strong> <strong>the</strong> lake. Only<br />
one perennial stream, Willow Creek, exists in <strong>the</strong> plateau.<br />
Values for monthly mean inflows to Clear Lake (calculated<br />
from a mass balance) show that high flows occur in March<br />
(500 ft 3 /s), whereas low flows occur in late summer (30 ft 3 /s).<br />
The l<strong>and</strong>s draining to Gerber Reservoir are more mountainous<br />
than those draining to Clear Lake, but are geologically similar.<br />
Mean monthly inflows to Gerber Reservoir are highest in<br />
March (280 ft 3 /s) <strong>and</strong> lowest during <strong>the</strong> late summer (4–5<br />
ft 3 /s). <strong>Water</strong> from Gerber Reservoir flows to <strong>the</strong> Lost River via<br />
Miller Creek.<br />
Several springs contribute flow to <strong>the</strong> Lost River<br />
subbasin in <strong>the</strong> sediment filled Langell, Yonna, <strong>and</strong> Poe<br />
valleys. Bonanza Spring, near <strong>the</strong> town <strong>of</strong> Bonanza, is a major<br />
contributor <strong>of</strong> baseflow to <strong>the</strong> river as are a series <strong>of</strong> springs<br />
adjacent to <strong>the</strong> river near Olene Gap.<br />
Little historical data are available with which to estimate<br />
ground-water discharge in most <strong>of</strong> <strong>the</strong> Lost River subbasin.<br />
For Clear Lake <strong>and</strong> Gerber Reservoirs, USGS streamgaging<br />
data collected prior to <strong>the</strong> construction <strong>of</strong> <strong>the</strong> reservoirs were<br />
used along with inflows reported by Reclamation (Bureau <strong>of</strong><br />
Reclamation, 1954, Appendix B) to estimate ground-water<br />
discharge during fall. The average discharge during <strong>the</strong> period<br />
<strong>of</strong> record was 40 ft 3 /s <strong>and</strong> 10 ft 3 /s, respectively for <strong>the</strong> two<br />
reservoirs. Limited data for <strong>the</strong> remaining area are available<br />
from gages operated intermittently in <strong>the</strong> early 1900s <strong>and</strong><br />
late 1990s on <strong>the</strong> Lost River. Sets <strong>of</strong> synoptic measurements<br />
(Leonard <strong>and</strong> Harris, 1974; Grondin 2004) were sufficient<br />
to determine <strong>the</strong> location <strong>of</strong> gains to <strong>the</strong> river below <strong>the</strong><br />
reservoirs. These measurements demonstrate that most<br />
ground-water discharge into <strong>the</strong> Lost River proper occurs at<br />
two locations: Bonanza Springs <strong>and</strong> <strong>the</strong> area just upstream <strong>of</strong><br />
Olene Gap. The overall gain to <strong>the</strong> river between Olene <strong>and</strong><br />
<strong>the</strong> two reservoirs is about 140 ft 3 /s, largely on <strong>the</strong> basis <strong>of</strong><br />
synoptic measurements. The temporal variability <strong>of</strong> groundwater<br />
inflow is poorly known owing to <strong>the</strong> short periods <strong>of</strong><br />
record. Below Olene Gap, data were insufficient to estimate<br />
ground-water discharge to <strong>the</strong> river. Likewise, data were<br />
insufficient to estimate direct ground-water discharge to <strong>the</strong><br />
Tule Lake Sump.<br />
Lost River Subbasin—Temporal Variations in<br />
<strong>Ground</strong>-<strong>Water</strong> Discharge<br />
Bonanza Springs is <strong>the</strong> only location in <strong>the</strong> Lost River<br />
subbasin where data are sufficient to evaluate temporal<br />
variations in ground-water discharge. These springs discharge<br />
from basalt to <strong>the</strong> Lost River. Twenty-one discharge<br />
measurements <strong>of</strong> <strong>the</strong> springs, made by USGS, OWRD, or<br />
Reclamation, are in <strong>the</strong> published <strong>and</strong> unpublished literature<br />
(fig 15). Discharge <strong>of</strong> <strong>the</strong> springs is in all cases determined<br />
by comparing <strong>the</strong> difference in streamflow <strong>of</strong> <strong>the</strong> Lost River<br />
upstream <strong>and</strong> downstream from <strong>the</strong> town <strong>of</strong> Bonanza. Many<br />
upstream measurements were made between 2 <strong>and</strong> 3 mi<br />
from Bonanza, <strong>and</strong> some were made at a bridge about 5 mi<br />
upstream. Downstream measurements all have been made<br />
about 3 mi downstream at Harpold Dam. Some determinations<br />
<strong>of</strong> spring flow account for all tributary inflows (including<br />
agricultural drains) <strong>and</strong> diversions between <strong>the</strong> upstream <strong>and</strong><br />
downstream measurement sites. O<strong>the</strong>r than Bonanza Springs,<br />
<strong>the</strong>se gains <strong>and</strong> losses are minor outside <strong>of</strong> <strong>the</strong> irrigation<br />
season. Many determinations <strong>of</strong> spring flow include only <strong>the</strong><br />
upstream <strong>and</strong> downstream measurements <strong>and</strong> measurement<br />
<strong>of</strong> <strong>the</strong> single major tributary, Buck Creek. Determinations<br />
<strong>of</strong> spring discharge made by comparing flows only at Keller<br />
Bridge, Buck Creek, <strong>and</strong> Harpold Dam outside <strong>of</strong> <strong>the</strong><br />
irrigation season are considered reasonable because <strong>the</strong> spring<br />
discharge is much larger than <strong>the</strong> o<strong>the</strong>r stream gains <strong>and</strong><br />
losses.<br />
Discharge measurements <strong>of</strong> Bonanza Springs show<br />
considerable temporal variation (fig. 15). The largest<br />
measurement, 118 ft 3 /s in October 1958, occurred after a<br />
15-year period <strong>of</strong> wetter-than-average wea<strong>the</strong>r. The smallest<br />
measurement, 38 ft 3 /s in January 1992, occurred late in a<br />
drought that started in <strong>the</strong> mid-1980s. Overall, <strong>the</strong> pattern <strong>of</strong><br />
spring discharge follows <strong>the</strong> general pattern <strong>of</strong> precipitation,<br />
reflecting drought cycles <strong>and</strong> a general drying trend since<br />
<strong>the</strong> late 1950s. Unfortunately, no measurements are available<br />
from <strong>the</strong> very dry period in <strong>the</strong> early 1940s. Bonanza Springs<br />
discharge is affected by climate, ground-water pumping, <strong>and</strong><br />
artificial manipulation <strong>of</strong> <strong>the</strong> stage <strong>of</strong> <strong>the</strong> Lost River (Grondin,<br />
2004). Discharge from <strong>the</strong> main spring can cease entirely<br />
during <strong>the</strong> irrigation season in dry years. Most measurements<br />
after 1960 (fig. 15) were made well after <strong>the</strong> irrigation season<br />
(December to April), so <strong>the</strong> system should have mostly<br />
recovered from <strong>the</strong> seasonal effects <strong>of</strong> pumping <strong>and</strong> diversion.<br />
Present information is insufficient, however, to determine<br />
precisely how much <strong>of</strong> <strong>the</strong> variation in spring discharge is<br />
natural <strong>and</strong> how much is related to pumping.
34 <strong>Ground</strong>-<strong>Water</strong> <strong>Hydrology</strong> <strong>of</strong> <strong>the</strong> <strong>Upper</strong> <strong>Klamath</strong> <strong>Basin</strong>, <strong>Oregon</strong> <strong>and</strong> California<br />
150<br />
150<br />
DISCHARGE, IN CUBIC FEET PER SECOND<br />
125<br />
100<br />
75<br />
50<br />
25<br />
0<br />
1910<br />
1915<br />
1920<br />
1925<br />
1930<br />
1935<br />
1940<br />
1945<br />
1950<br />
1955<br />
Published measurements with estimated 95% confidence intervals<br />
Unverified measurements<br />
Cumulative departure from precipitation at Crater Lake 1913-2005—<br />
Dotted where estimated from <strong>Klamath</strong> Falls data.<br />
1960<br />
1965<br />
1970<br />
1975<br />
1980<br />
1985<br />
1990<br />
1995<br />
2000<br />
2005<br />
125<br />
100<br />
75<br />
50<br />
25<br />
0<br />
-25<br />
-50<br />
CUMULATIVE DEPARTURE FROM AVERAGE PRECIPITATION, IN INCHES<br />
Figure 15. Discharge <strong>of</strong> Bonanza Springs <strong>and</strong> cumulative departure from average precipitation at Crater Lake,<br />
<strong>Oregon</strong>. (Sources <strong>of</strong> data: Meinzer, 1927; U.S. Geological Survey, 1956, 1960a; Leonard <strong>and</strong> Harris, 1974; Grondin,<br />
2004; measurements labeled unverified appear in <strong>of</strong>ficial State <strong>of</strong> <strong>Oregon</strong> correspondence <strong>and</strong> are attributed to<br />
Reclamation <strong>and</strong> USGS, but no original records were found.)<br />
<strong>Klamath</strong> River Subbasin—Geographic Distribution <strong>of</strong><br />
<strong>Ground</strong>-<strong>Water</strong> Discharge<br />
The <strong>Klamath</strong> River subbasin encompasses <strong>the</strong> area<br />
between <strong>the</strong> outlet <strong>of</strong> <strong>Upper</strong> <strong>Klamath</strong> Lake <strong>and</strong> Iron Gate<br />
Dam. The main hydrologic features are John C. Boyle, Copco,<br />
<strong>and</strong> Iron Gate Reservoirs, Lake Ewauna, Lower <strong>Klamath</strong> Lake,<br />
<strong>and</strong> <strong>the</strong> <strong>Klamath</strong> River. The <strong>Klamath</strong> River begins at <strong>the</strong> outlet<br />
<strong>of</strong> <strong>Upper</strong> <strong>Klamath</strong> Lake, where, for <strong>the</strong> first mile or so, it is<br />
known as <strong>the</strong> Link River. From <strong>the</strong> dam, <strong>the</strong> Link River flows<br />
about 1 mi through a narrow gorge into a broad, flat valley<br />
containing Lake Ewauna, <strong>the</strong> head <strong>of</strong> <strong>Klamath</strong> River proper.<br />
Lake Ewauna, impounded by Keno Dam, is a long, narrow<br />
reservoir that traverses <strong>the</strong> nor<strong>the</strong>rn part <strong>of</strong> <strong>the</strong> Lower <strong>Klamath</strong><br />
Lake subbasin.<br />
Prior to development <strong>of</strong> <strong>the</strong> region, <strong>the</strong> <strong>Klamath</strong> River<br />
occasionally spilled across <strong>the</strong> low, nearly level divide<br />
into <strong>the</strong> Lost River subbasin during floods. La Rue (1922)<br />
hypo<strong>the</strong>sized that water also may have flowed from <strong>the</strong> Lost<br />
River to <strong>the</strong> <strong>Klamath</strong> River subbasin during floods. Recent<br />
analysis <strong>of</strong> topographic mapping from <strong>the</strong> early 1900s,<br />
however, suggests that <strong>the</strong> Lost River was incised to <strong>the</strong><br />
degree that flow from <strong>the</strong> Lost River system to <strong>the</strong> <strong>Klamath</strong><br />
River subbasin was highly unlikely (Jon Hicks, Bureau <strong>of</strong><br />
Reclamation, oral commun., 2006). <strong>Water</strong> also moved between<br />
<strong>the</strong> <strong>Klamath</strong> River <strong>and</strong> Lower <strong>Klamath</strong> Lake subbasin prior<br />
to development. <strong>Water</strong> flowed from <strong>the</strong> <strong>Klamath</strong> River into<br />
Lower <strong>Klamath</strong> Lake during periods <strong>of</strong> high flow, usually in<br />
winter or spring. After high flows, water would flow out <strong>of</strong> <strong>the</strong><br />
lake through <strong>the</strong> <strong>Klamath</strong> Strait back into <strong>the</strong> <strong>Klamath</strong> River.<br />
There is some uncertainty as to timing <strong>and</strong> duration <strong>of</strong> flow<br />
from <strong>the</strong> lake to <strong>the</strong> river, <strong>and</strong> it probably varied from year to<br />
year with hydrologic conditions (Weddell, 2000; Bureau <strong>of</strong><br />
Reclamation, 2005). Flows into <strong>and</strong> out <strong>of</strong> <strong>the</strong> Lost River <strong>and</strong><br />
Lower <strong>Klamath</strong> Lake subbasins are now controlled.<br />
Downstream from Lake Ewauna <strong>and</strong> Keno Dam, <strong>the</strong><br />
<strong>Klamath</strong> River enters a canyon <strong>and</strong> flows into John C. Boyle<br />
Reservoir (operated by PacifiCorp), near <strong>the</strong> confluence with<br />
Spencer Creek. Below John C. Boyle Dam, <strong>the</strong> river drops<br />
into ano<strong>the</strong>r steep canyon. About 1 mile below <strong>the</strong> dam,<br />
a large spring complex contributes significant flow to <strong>the</strong><br />
river. Numerous perennial streams originating from <strong>the</strong> High<br />
Cascades <strong>and</strong> older Western Cascades also add flow to <strong>the</strong><br />
river between Keno <strong>and</strong> Iron Gate Dams. These tributaries<br />
are predominately run<strong>of</strong>f dominated; however several (for<br />
example, Spencer <strong>and</strong> Fall Creeks) have large components <strong>of</strong><br />
ground-water discharge. Flows in <strong>the</strong> <strong>Klamath</strong> River above<br />
Iron Gate Dam are largely regulated by Reclamation <strong>and</strong><br />
PacifiCorp impoundments, including Link River Dam at <strong>the</strong><br />
outlet <strong>of</strong> <strong>Upper</strong> <strong>Klamath</strong> Lake. Gaging station data from below<br />
Iron Gate Dam (11516530) show a high mean monthly flow <strong>of</strong><br />
3,600 ft 3 /s in March <strong>and</strong> a low mean monthly flow <strong>of</strong> 770 ft 3 /s<br />
in August.<br />
OR19-0048_fig15
<strong>Ground</strong>-<strong>Water</strong> <strong>Hydrology</strong> 35<br />
Most ground-water discharge in this subbasin occurs<br />
along <strong>the</strong> <strong>Klamath</strong> River <strong>and</strong> principal tributaries. A small<br />
amount <strong>of</strong> ground water also discharges to springs southwest<br />
<strong>of</strong> Lower <strong>Klamath</strong> Lake. <strong>Ground</strong>-water discharge in <strong>the</strong><br />
<strong>Klamath</strong> River subbasin was calculated directly from longterm<br />
streamflow data <strong>and</strong> corrected for reservoir storage in<br />
reaches <strong>of</strong> <strong>the</strong> <strong>Klamath</strong> River from <strong>the</strong> gaging station at Keno<br />
(11509500) to <strong>the</strong> gaging station below <strong>the</strong> John C. Boyle<br />
Power Plant (11510700) (about 5 mi below <strong>the</strong> dam), <strong>and</strong><br />
from that gage to <strong>the</strong> gage below Iron Gate Dam (11516530).<br />
Some short-term streamflow records available for tributaries<br />
were useful for discriminating ground-water discharge directly<br />
to <strong>the</strong> river from discharge to tributaries. Gains <strong>and</strong> losses<br />
between Link River Dam <strong>and</strong> Keno were not estimated owing<br />
to large uncertainties in <strong>the</strong> data in that reach. Discharge to<br />
springs southwest <strong>of</strong> Lower <strong>Klamath</strong> Lake was not measured<br />
for this study, but measurements are available from Wood<br />
(1960) <strong>and</strong> Reclamation records.<br />
The largest source <strong>of</strong> ground-water discharge between<br />
<strong>the</strong> gage at Keno <strong>and</strong> <strong>the</strong> gage below <strong>the</strong> John C. Boyle<br />
Power Plant is a series <strong>of</strong> springs about a mile below <strong>the</strong><br />
dam (fig. 7 <strong>and</strong> table 6). Although early references to <strong>the</strong>se<br />
springs are scarce, Newcomb <strong>and</strong> Hart (1958) note that springs<br />
contribute “considerable inflow” to <strong>the</strong> river in this area.<br />
Their observations <strong>and</strong> those <strong>of</strong> local residents cited in <strong>the</strong>ir<br />
report predate construction <strong>of</strong> John C. Boyle Dam, indicating<br />
that <strong>the</strong>se springs do not merely represent reservoir seepage.<br />
Records show that average gain from <strong>the</strong> springs is about<br />
190 ft 3 /s (table 6). The temporal variation in <strong>the</strong> discharge <strong>of</strong><br />
<strong>the</strong>se springs is well characterized. The baseflow <strong>of</strong> Spencer<br />
Creek, tributary to <strong>the</strong> <strong>Klamath</strong> River in this reach, is about<br />
27 ft 3 /s.<br />
Between <strong>the</strong> gage below <strong>the</strong> John C. Boyle Power Plant<br />
<strong>and</strong> that below Iron Gate Dam, gains averaged 140 ft 3 /s from<br />
1967 to 2000 (table 6). The spatial location <strong>of</strong> <strong>the</strong> groundwater<br />
discharge in this reach is not well known; however, <strong>the</strong>re<br />
is evidence <strong>of</strong> inflow to <strong>the</strong> main stem <strong>of</strong> <strong>the</strong> <strong>Klamath</strong> River<br />
between river miles 207 <strong>and</strong> 213, roughly between Shovel<br />
<strong>and</strong> Rock Creeks. Thermal infrared remote sensing shows that<br />
<strong>the</strong> river cools in this reach, an indication <strong>of</strong> ground-water<br />
discharge (<strong>Water</strong>shed Sciences, 2002). This reach corresponds<br />
with <strong>the</strong> boundary between <strong>the</strong> High Cascade <strong>and</strong> Western<br />
Cascade subprovinces <strong>and</strong> is <strong>the</strong>refore an area <strong>of</strong> expected<br />
ground-water discharge. In addition, <strong>the</strong> reach traverses a<br />
large l<strong>and</strong>slide complex with numerous mapped springs. Some<br />
inflow in this reach is due to tributary streams. Fall Creek,<br />
which drains an area dominated by rocks <strong>of</strong> <strong>the</strong> High Cascade<br />
subprovince, is <strong>the</strong> largest known contributor, with a baseflow<br />
<strong>of</strong> about 36 ft 3 /s, whereas <strong>the</strong> much larger Jenny Creek<br />
watershed, which is underlain largely by low-permeability<br />
older volcanic rocks, contributes only about 9 ft 3 /s. Flow data<br />
are sparse for <strong>the</strong> remaining tributaries in <strong>Oregon</strong>, but regional<br />
regression techniques show that <strong>the</strong>se contributions probably<br />
amount to slightly greater than 1 ft 3 /s. The component <strong>of</strong><br />
baseflow to <strong>the</strong> reach from California tributaries is unknown.<br />
<strong>Ground</strong> water also discharges to a number <strong>of</strong> spring<br />
complexes southwest <strong>of</strong> Lower <strong>Klamath</strong> Lake (fig. 7<br />
<strong>and</strong> table 6). Reclamation engineer Louis Hall made a<br />
reconnaissance <strong>of</strong> <strong>the</strong> Lower <strong>Klamath</strong> Lake subbasin in<br />
September 1908 during which he inventoried springs along<br />
<strong>the</strong> margin <strong>of</strong> <strong>the</strong> lake <strong>and</strong> estimated <strong>the</strong>ir discharge. His<br />
estimates <strong>of</strong> spring discharge to <strong>the</strong> lake total 104 ft 3 /s,<br />
although his estimating methods are not known (Tom Perry,<br />
Bureau <strong>of</strong> Reclamation, written commun., 2006). Wood<br />
(1960) made several measurements <strong>of</strong> discharge at three<br />
<strong>of</strong> <strong>the</strong> principal spring complexes during water year 1955.<br />
He also reports CDWR observations that year for a fourth<br />
discharge measurement. Wood’s measurements are not directly<br />
comparable to Hall’s earlier estimates because <strong>of</strong> differences<br />
in locations; however, in cases where general comparisons can<br />
be made, Wood’s measured flows appear to be about one-half<br />
<strong>of</strong> Hall’s estimates. Averages <strong>of</strong> Wood’s measurements total<br />
about 35 ft 3 /s. Some small seasonal variability is evident in <strong>the</strong><br />
measurements, but <strong>the</strong> data are too sparse to define a pattern<br />
<strong>and</strong> identify <strong>the</strong> source <strong>of</strong> <strong>the</strong> variability. Measurements made<br />
in 1955 may reasonably represent <strong>the</strong> average flow during <strong>the</strong><br />
early 1950s. Precipitation during water year 1955 was less<br />
than average, but 1953 <strong>and</strong> 1954 were close to <strong>the</strong> long-term<br />
average. Discharge <strong>of</strong> <strong>the</strong>se springs probably is now less than<br />
it was in <strong>the</strong> mid-1950s, owing to dryer conditions in recent<br />
decades <strong>and</strong> increased ground-water development in <strong>the</strong> area.<br />
<strong>Klamath</strong> River Subbasin—Temporal Variations in <strong>Ground</strong>-<br />
<strong>Water</strong> Discharge<br />
The principal sources <strong>of</strong> data used to evaluate groundwater<br />
discharge variations in <strong>the</strong> <strong>Klamath</strong> River subbasin are<br />
stream-gaging stations at Keno (11509500), below <strong>the</strong> John<br />
C. Boyle power plant (11510700), <strong>and</strong> below Iron Gate Dam<br />
(11516530). These data are augmented with short-term gaging<br />
station records from Spencer <strong>and</strong> Fall Creeks (11510000<br />
<strong>and</strong> 11512000, respectively). Underst<strong>and</strong>ing ground-water<br />
discharge variations along <strong>the</strong> <strong>Klamath</strong> River, however, is<br />
complicated by inflow from ungaged tributaries, unmeasured<br />
diversions, <strong>and</strong> changes in reservoir storage.<br />
<strong>Ground</strong>-water discharges to <strong>the</strong> <strong>Klamath</strong> River between<br />
<strong>the</strong> Keno gage <strong>and</strong> <strong>the</strong> gage below <strong>the</strong> John C. Boyle power<br />
plant. Nearly all <strong>of</strong> <strong>the</strong> discharge is from a spring complex<br />
near river mile 224 about 1 mi below <strong>the</strong> John C. Boyle Dam<br />
<strong>and</strong> about 3.5 mi above <strong>the</strong> power plant. Thermal infrared<br />
remote sensing on July 15, 2002, showed that this spring<br />
complex cooled <strong>the</strong> river about 10°F (<strong>Water</strong>shed Sciences,<br />
2002). Gage data indicate <strong>the</strong> flow in <strong>the</strong> river just below <strong>the</strong><br />
springs was about 370 ft 3 /s on that date. Temporal variations
36 <strong>Ground</strong>-<strong>Water</strong> <strong>Hydrology</strong> <strong>of</strong> <strong>the</strong> <strong>Upper</strong> <strong>Klamath</strong> <strong>Basin</strong>, <strong>Oregon</strong> <strong>and</strong> California<br />
in net ground-water discharge to this reach can be evaluated<br />
by comparing August mean flows at <strong>the</strong> two gages <strong>and</strong><br />
accounting for changes in storage <strong>of</strong> John C. Boyle Reservoir<br />
(reservoir data from Rob Allerman, PacifiCorp, written<br />
commun, 2002). August means were used to evaluate temporal<br />
variations here instead <strong>of</strong> <strong>the</strong> September–November means to<br />
minimize <strong>the</strong> effects <strong>of</strong> fall storms. This can be done because<br />
diversions are insignificant <strong>and</strong> <strong>the</strong> mean August inflow (240<br />
ft 3 /s) is reasonably close to <strong>the</strong> mean September–November<br />
inflow (230 ft 3 /s).<br />
A graph showing <strong>the</strong> August mean net inflow to <strong>the</strong><br />
reach between Keno <strong>and</strong> <strong>the</strong> gage below <strong>the</strong> John C. Boyle<br />
power plant (fig. 16) shows that ground-water discharge to this<br />
reach varied from less than 200 ft 3 /s to greater than 300 ft 3 /s<br />
during <strong>the</strong> period <strong>of</strong> record. The average error in <strong>the</strong> individual<br />
inflow estimates is approximately ± 50 ft 3 /s on <strong>the</strong> basis <strong>of</strong><br />
measurement error <strong>of</strong> <strong>the</strong> stream gages. The general pattern<br />
<strong>of</strong> ground-water discharge loosely follows <strong>the</strong> decadal cycles<br />
seen in precipitation, with <strong>the</strong> lowest inflows corresponding to<br />
extended periods <strong>of</strong> drought, but that correlation is low<br />
(r = 0.30).<br />
<strong>Ground</strong>-water discharge also occurs to <strong>the</strong> <strong>Klamath</strong> River<br />
between <strong>the</strong> gaging station below <strong>the</strong> John C. Boyle power<br />
plant <strong>and</strong> <strong>the</strong> gaging station below Iron Gate Dam. Evaluating<br />
temporal variations in ground-water discharge to this reach<br />
is made difficult by ungaged tributary inflow <strong>and</strong> probable<br />
diversions. Moreover, calculated inflow values include<br />
cumulative errors in data from <strong>the</strong> two gaging stations <strong>and</strong><br />
in storage measurements <strong>of</strong> two large reservoirs. As with <strong>the</strong><br />
upstream reach, temporal variations in ground-water discharge<br />
can be evaluated by calculating <strong>the</strong> differences between flows<br />
at <strong>the</strong> two gages <strong>and</strong> accounting for changes in reservoir<br />
storage (fig. 16). September to November mean inflows are<br />
used here to minimize <strong>the</strong> effects <strong>of</strong> diversions.<br />
Between 1967 <strong>and</strong> 2002, <strong>the</strong> September to November<br />
mean inflow between <strong>the</strong> gaging stations below <strong>the</strong> John C.<br />
Boyle power plant <strong>and</strong> Iron Gate Dam ranged from 30 to 330<br />
ft 3 /s, averaging 140 ft 3 /s (fig. 17). About 45 ft 3 /s if this inflow<br />
is from Fall <strong>and</strong> Jenny Creeks (table 6). The uncertainty <strong>of</strong> <strong>the</strong><br />
inflow estimates due to measurement error is ± 110 ft 3 /s. The<br />
correlation between ground-water discharge <strong>and</strong> climate is not<br />
as apparent here as elsewhere in <strong>the</strong> basin owing to <strong>the</strong> small<br />
amount <strong>of</strong> net ground-water inflow relative to <strong>the</strong> streamflow<br />
measurement error.<br />
INFLOW, IN CUBIC FEET PER SECOND<br />
400<br />
350<br />
300<br />
250<br />
200<br />
150<br />
100<br />
50<br />
200<br />
150<br />
100<br />
50<br />
0<br />
-50<br />
PacifiCorp spring discharge estimates<br />
August mean inflow between gages at Keno <strong>and</strong> below <strong>the</strong> J.C. Boyle Dam<br />
Cumulative departure from average precipitation at Crater Lake (1932-2005)<br />
0<br />
-100<br />
1960 1965 1970 1975 1980 1985 1990 1995 2000 2005<br />
CUMULATIVE DEPARTURE FROM AVERAGE PRECIPITATION, IN INCHES<br />
Figure 16. August mean gains in flow (a proxy for ground-water discharge) between Keno (USGS gaging station number<br />
11509500) <strong>and</strong> <strong>the</strong> John C. Boyle power plant (11510700), estimates <strong>of</strong> inflow by PacifiCorp, <strong>and</strong> <strong>the</strong> cumulative departure<br />
from average precipitation at Crater Lake, <strong>Oregon</strong>. (PacifiCorp data from Rob Allerman, written commun., 2002).
<strong>Ground</strong>-<strong>Water</strong> <strong>Hydrology</strong> 37<br />
INFLOW, IN CUBIC FEET PER SECOND<br />
400<br />
350<br />
300<br />
250<br />
200<br />
150<br />
100<br />
50<br />
September-November mean inflow between J.C. Boyle Power Plant <strong>and</strong> Iron Gate Dam<br />
Cumulative departure from average precipitation at Crater Lake (1932-2005)<br />
0<br />
1965 1970 1975 1980 1985 1990 1995 2000<br />
250<br />
200<br />
150<br />
100<br />
50<br />
0<br />
-50<br />
CUMULATIVE DEPARTURE FROM AVERAGE PRECIPITATION, IN INCHES<br />
Figure 17. September to November mean gains in flow (a proxy for ground-water discharge) between <strong>the</strong> John C.<br />
Boyle power plant (USGS station number 11510700) <strong>and</strong> Iron Gate Dam (11516530), <strong>and</strong> <strong>the</strong> cumulative departure from<br />
average precipitation at Crater Lake, <strong>Oregon</strong>.<br />
Summary <strong>of</strong> Geographic <strong>and</strong> Temporal Variations<br />
<strong>of</strong> <strong>Ground</strong>-<strong>Water</strong> Discharge to Streams<br />
Analysis <strong>of</strong> streamflow data indicates that many streams<br />
in <strong>the</strong> upper <strong>Klamath</strong> <strong>Basin</strong> have a large component <strong>of</strong> ground<br />
water. Most streams throughout <strong>the</strong> world rely on groundwater<br />
discharge to support flows during <strong>the</strong> dry season. The<br />
upper <strong>Klamath</strong> <strong>Basin</strong> <strong>and</strong> o<strong>the</strong>r basins on <strong>the</strong> eastern flank <strong>of</strong><br />
<strong>the</strong> Cascade Range are unique in that ground water discharge<br />
composes a large proportion <strong>of</strong> <strong>the</strong> total streamflow. This is<br />
attributable to <strong>the</strong> substantial regional ground-water system<br />
that exists in <strong>the</strong> permeable volcanic terrane. Some major<br />
streams in <strong>the</strong> basin, such as <strong>the</strong> Wood River <strong>and</strong> Spring<br />
Creek, are virtually entirely ground water fed. It has long<br />
been recognized that much <strong>of</strong> <strong>the</strong> water flowing into <strong>Upper</strong><br />
<strong>Klamath</strong> Lake originates as ground-water discharge (Bureau <strong>of</strong><br />
Reclamation, 1954, p. 150). Of <strong>the</strong> 2,200–2,300 ft 3 /s average<br />
total inflow to <strong>the</strong> lake (from Hubbard, 1970, <strong>and</strong> Reclamation<br />
records), at least 60 percent can be attributed to ground-water<br />
discharge in <strong>the</strong> Wood River subbasin <strong>and</strong> springs in <strong>the</strong> lower<br />
Sprague River drainage <strong>and</strong> <strong>the</strong> Williamson River drainage<br />
below Kirk. This quantity does not include ground-water<br />
discharge to upper parts <strong>of</strong> <strong>the</strong> Williamson <strong>and</strong> Sprague River<br />
systems, which would make <strong>the</strong> figure even larger. The large<br />
component <strong>of</strong> ground water in streamflow influences <strong>the</strong><br />
hydrologic response <strong>of</strong> <strong>the</strong> basin to climate cycles, <strong>and</strong> has<br />
implications for flow forecasting (Risley <strong>and</strong> o<strong>the</strong>rs, 2005).<br />
OR19-0048_fig17<br />
Discharge from all major ground-water discharge areas<br />
in <strong>the</strong> basin fluctuates over time. <strong>Ground</strong>-water discharge<br />
fluctuations are primarily climate driven, <strong>and</strong>, <strong>the</strong>refore,<br />
discharge from <strong>the</strong> various sources tends to vary in unison.<br />
Owing to <strong>the</strong> effects <strong>of</strong> ground-water storage, regional-scale<br />
discharge areas integrate climate conditions over multiple<br />
years. Consequently, ground-water discharge fluctuations<br />
tend to follow a pattern similar to <strong>the</strong> cumulative departure<br />
from average precipitation. A practical implication <strong>of</strong> this<br />
observation is that ground-water discharge from storage may<br />
support robust streamflow during a dry year following a series<br />
<strong>of</strong> wet years. Conversely, it may take multiple years <strong>of</strong> average<br />
or above average conditions following a protracted drought to<br />
replace ground-water storage <strong>and</strong> return spring discharge (<strong>and</strong><br />
hence, streamflow) to predrought conditions.<br />
<strong>Ground</strong>-water discharge variations can represent<br />
substantial volumes <strong>of</strong> water on an annual basis. The<br />
combined ground-water discharge to <strong>the</strong> lower Williamson,<br />
Sprague, <strong>and</strong> Wood Rivers just upstream <strong>of</strong> <strong>Upper</strong> <strong>Klamath</strong><br />
Lake can vary by at least 450 ft 3 /s in response to climate<br />
cycles. This equates to an annual volume <strong>of</strong> 326,000 acreft.<br />
The actual variation in ground-water discharge to <strong>Upper</strong><br />
<strong>Klamath</strong> Lake <strong>and</strong> its tributaries is larger, because <strong>the</strong> probable<br />
variations in ground-water discharge to Fort Creek, Crooked<br />
Creek, <strong>and</strong> springs discharging directly to <strong>the</strong> lake have not<br />
been included. Gaging station data show that net ground-water<br />
inflow to <strong>the</strong> <strong>Klamath</strong> River (<strong>and</strong> ground-water fed tributaries)<br />
between Keno <strong>and</strong> Iron Gate Dam probably varies at least 150<br />
ft 3 /s in response to climate.
38 <strong>Ground</strong>-<strong>Water</strong> <strong>Hydrology</strong> <strong>of</strong> <strong>the</strong> <strong>Upper</strong> <strong>Klamath</strong> <strong>Basin</strong>, <strong>Oregon</strong> <strong>and</strong> California<br />
<strong>Ground</strong>-<strong>Water</strong> Discharge to Wells<br />
<strong>Ground</strong> water pumped from wells in <strong>the</strong> upper <strong>Klamath</strong><br />
<strong>Basin</strong> is used primarily for public supply <strong>and</strong> agriculture.<br />
For public supply, ground water is provided by public or<br />
privately owned utilities for drinking, municipal, industrial,<br />
<strong>and</strong> commercial purposes. Most ground water pumped for<br />
irrigation is used for agriculture; however, some is used for<br />
irrigation <strong>of</strong> cemeteries, parks, <strong>and</strong> golf courses. The following<br />
discussion is limited to ground-water withdrawals for publicsupply<br />
<strong>and</strong> agricultural irrigation. Industrial <strong>and</strong> domestic<br />
withdrawals from individual private wells are not discussed<br />
because <strong>the</strong>ir proportion <strong>of</strong> <strong>the</strong> total ground-water use in <strong>the</strong><br />
basin is small.<br />
Methods<br />
<strong>Ground</strong>-water pumping for public-supply <strong>and</strong> irrigation<br />
was estimated using different methods. Since 1985, OWRD<br />
has required public suppliers to report ground-water pumpage<br />
annually. Public suppliers in <strong>Oregon</strong> report monthly pumpage<br />
totals by individual well for each water year. The totals<br />
typically are based on direct flowmeter measurements or<br />
calculated from pumping rates <strong>and</strong> duration <strong>of</strong> pumping. The<br />
totals for this report were based on reported pumpage in 2000.<br />
No pumpage data were available for <strong>the</strong> small California<br />
communities <strong>of</strong> Dorris, Macdoel, <strong>and</strong> Tulelake. <strong>Ground</strong>water<br />
withdrawals for <strong>the</strong>se suppliers were estimated using<br />
population data.<br />
Nei<strong>the</strong>r <strong>Oregon</strong> nor California requires well owners<br />
to report ground-water withdrawals for irrigation. Some<br />
irrigators in <strong>Oregon</strong> report <strong>the</strong>ir yearly pumpage to OWRD<br />
ei<strong>the</strong>r voluntarily or as required by conditions in <strong>the</strong>ir waterright<br />
permit, but such reporting is rare. The lack <strong>of</strong> any<br />
comprehensive reporting system by both States means that<br />
indirect methods based on water right information, satellite<br />
imagery, <strong>and</strong> l<strong>and</strong> <strong>and</strong> water surveys must be used to estimate<br />
<strong>the</strong> rate <strong>and</strong> distribution <strong>of</strong> ground-water withdrawal.<br />
<strong>Ground</strong>-<strong>Water</strong> Pumpage for Public-Supply Use<br />
<strong>Ground</strong> water is <strong>the</strong> source <strong>of</strong> water supplied by eight<br />
public systems <strong>and</strong> one quasi-public system in <strong>the</strong> study area.<br />
Public suppliers <strong>of</strong> ground water include <strong>the</strong> communities <strong>of</strong><br />
<strong>Klamath</strong> Falls, Bly, Chiloquin, Merrill, <strong>and</strong> Malin. One resort<br />
community northwest <strong>of</strong> <strong>Klamath</strong> Falls is considered a quasimunicipal<br />
system on <strong>the</strong> basis <strong>of</strong> <strong>the</strong> variety <strong>of</strong> water uses.<br />
<strong>Ground</strong>-water withdrawals for <strong>the</strong> communities <strong>of</strong> Dorris,<br />
Macdoel, <strong>and</strong> Tulelake were estimated using recent population<br />
totals <strong>and</strong> a per capita use <strong>of</strong> 150 gallons per day (according<br />
to <strong>the</strong> methods <strong>of</strong> Broad <strong>and</strong> Collins, 1996). Public-supply<br />
systems that served more than 25 people or had at least 15<br />
connections pumped approximately 9.3 Mgal/d (million<br />
gallons per day) or about 14.4 ft 3 /s in 2000. By comparison,<br />
in <strong>the</strong> 5-year period from 1996 through 2000, public supply<br />
withdrawals in <strong>the</strong> basin averaged an estimated 8.2 Mgal/d<br />
(12.7 ft 3 /s). The City <strong>of</strong> <strong>Klamath</strong> Falls, with a population <strong>of</strong><br />
19,400, accounted for 84 percent <strong>of</strong> <strong>the</strong> 2000 total, reporting<br />
withdrawals <strong>of</strong> 7.8 Mgal/d (12.1 ft 3 /s) from 9 city wells. Per<br />
capita use in cities such as <strong>Klamath</strong> Falls is larger than in rural<br />
areas <strong>and</strong> small towns due to <strong>the</strong> larger relative amount <strong>of</strong><br />
commercial, industrial, <strong>and</strong> irrigation included.<br />
<strong>Ground</strong>-<strong>Water</strong> Pumping for Irrigation<br />
In <strong>Oregon</strong>, ground-water pumpage for irrigation was<br />
estimated by matching maps <strong>of</strong> primary <strong>and</strong> supplemental<br />
irrigation ground-water rights to areas that were determined<br />
to be irrigated by using a l<strong>and</strong>-cover data set created from<br />
30-meter resolution L<strong>and</strong>sat satellite imagery taken during<br />
<strong>the</strong> 2000 irrigation season. The L<strong>and</strong>sat image data were<br />
analyzed to help identify vegetation types <strong>and</strong> conditions (such<br />
as <strong>the</strong> stage <strong>of</strong> growth) in a process known as “classification.”<br />
The ground-water rights data sets consisted <strong>of</strong> geographic<br />
information system (GIS) layers showing places <strong>of</strong> use<br />
(POUs) <strong>and</strong> points <strong>of</strong> appropriation (POAs), <strong>and</strong> were<br />
provided by <strong>the</strong> OWRD along with data from <strong>the</strong>ir <strong>Water</strong><br />
Rights Information System. The POUs represent <strong>the</strong> fields<br />
where water is applied under <strong>the</strong> terms <strong>of</strong> <strong>the</strong> water right. That<br />
right might be a primary right for ground-water irrigation,<br />
or a supplemental right under which ground water is used<br />
to supplement a primary surface-water right on <strong>the</strong> same<br />
l<strong>and</strong>. A water-right can cover a single tract or several tracts<br />
not necessarily adjacent to one ano<strong>the</strong>r. POAs correspond to<br />
specific wells at particular locations on ground-water rights.<br />
A single ground-water right may include more than one<br />
well. Pumpage was estimated only for active primary <strong>and</strong><br />
supplemental ground-water rights for irrigation outside <strong>of</strong><br />
irrigation district boundaries. It was assumed that no primary<br />
ground-water rights are in areas included in irrigation districts<br />
within <strong>the</strong> <strong>Klamath</strong> Project, <strong>and</strong> that supplemental groundwater<br />
irrigation within irrigation districts was negligible in<br />
2000.<br />
The POU boundaries were overlaid with <strong>the</strong> l<strong>and</strong>s<br />
determined to be irrigated using <strong>the</strong> classified L<strong>and</strong>sat imagery<br />
(fig. 18). The purpose <strong>of</strong> <strong>the</strong> overlay was to match specific<br />
water rights to irrigated areas shown on <strong>the</strong> l<strong>and</strong>-cover map<br />
developed from <strong>the</strong> imagery. The results reveal which fields<br />
with ground-water rights were actually irrigated during <strong>the</strong><br />
2000 irrigation season. Partial overlay matches, where ei<strong>the</strong>r<br />
<strong>the</strong> irrigated l<strong>and</strong>s from <strong>the</strong> imagery did not completely fill a<br />
POU field boundary or <strong>the</strong> imagery showed many small blocks<br />
<strong>of</strong> irrigated areas within a field boundary, were evaluated<br />
individually <strong>and</strong> <strong>the</strong> acres included or dropped (considered<br />
irrigated or not irrigated) on <strong>the</strong> basis <strong>of</strong> specific criteria.<br />
Any irrigated fields smaller than 3 acres were eliminated.<br />
<strong>Ground</strong>-water pumpage used in irrigated areas was assigned<br />
to a specific well based on water right information. Where<br />
<strong>the</strong> l<strong>and</strong>-cover data showed an obvious irrigated field (for
<strong>Ground</strong>-<strong>Water</strong> <strong>Hydrology</strong> 39<br />
example, from a center pivot) but no matching water right in<br />
<strong>the</strong> GIS data set, a withdrawal location based on <strong>the</strong> centroid<br />
<strong>of</strong> <strong>the</strong> field was used. In total, 19,250 acres <strong>of</strong> cropl<strong>and</strong> in <strong>the</strong><br />
upper <strong>Klamath</strong> <strong>Basin</strong> in <strong>Oregon</strong> was estimated to have been<br />
irrigated with ground water in 2000, or about 30 percent <strong>of</strong><br />
<strong>the</strong> 64,000 acres with <strong>Oregon</strong> primary ground-water rights<br />
evaluated in this analysis.<br />
The estimation method produced a conservative number<br />
<strong>of</strong> irrigated acres <strong>and</strong> points <strong>of</strong> appropriation. The apparent<br />
low percentage <strong>of</strong> ground-water rights exercised in 2000<br />
may be attributable to counting only <strong>the</strong> acres appearing to<br />
be irrigated on L<strong>and</strong>sat images ra<strong>the</strong>r than <strong>the</strong> total acreage<br />
carried on <strong>the</strong> water right, <strong>and</strong> editing criteria that were<br />
more likely to eliminate than include fields where evidence<br />
<strong>of</strong> irrigation was questionable on <strong>the</strong> satellite image. Any<br />
irrigation in areas not included in <strong>the</strong> OWRD digital water<br />
right POU maps is not included in <strong>the</strong> estimate. Estimates<br />
<strong>of</strong> pumpage within irrigation district boundaries under a<br />
pilot water bank <strong>and</strong> similar programs starting in 2001 are<br />
discussed in a separate section<br />
The crop types in areas irrigated with ground water in<br />
<strong>Oregon</strong> were determined from <strong>the</strong> classified L<strong>and</strong>sat satellite<br />
imagery using <strong>the</strong> methodology described in appendix A.<br />
Specific crop types could not be reliably identified using <strong>the</strong><br />
L<strong>and</strong>sat imagery. Five vegetative classes <strong>of</strong> crop types were<br />
identified, however, on <strong>the</strong> basis <strong>of</strong> spectral signatures <strong>and</strong><br />
potential water requirements. The five classes are (1) alfalfa<br />
<strong>and</strong> irrigated grasses, (2) small grains, (3) onions <strong>and</strong> garlic,<br />
(4) potatoes <strong>and</strong> corn, <strong>and</strong> (5) strawberries.<br />
About 40,000 acres were irrigated with ground water in<br />
<strong>the</strong> upper <strong>Klamath</strong> <strong>Basin</strong> in California during 2000. California<br />
water law does not require a permit or approval to withdraw<br />
ground water from wells (California State <strong>Water</strong> Resources<br />
Control Board, 1990). The estimation <strong>of</strong> ground-water<br />
withdrawals in this report relied primarily on data compiled<br />
from a comprehensive l<strong>and</strong> <strong>and</strong> water survey by <strong>the</strong> CDWR’s<br />
Nor<strong>the</strong>rn District in summer 2000 for <strong>the</strong> State water plan<br />
update (Todd Hillaire, CWDR, written commun., April, 28,<br />
2003). For each tract <strong>of</strong> l<strong>and</strong> surveyed, CDWR determined<br />
<strong>the</strong> source <strong>of</strong> water, crop type <strong>and</strong> in most instances, <strong>the</strong> type<br />
<strong>of</strong> irrigation system used. The estimate in this report includes<br />
only those l<strong>and</strong>s assessed through <strong>the</strong> survey as entirely or<br />
partially irrigated with ground water.<br />
Irrigation water use on individual parcels was estimated<br />
based on <strong>the</strong> crop type, acreage, crop-water requirements,<br />
<strong>and</strong> irrigation method used. Alfalfa, pasture, grains, potatoes,<br />
onions, <strong>and</strong> garlic represented <strong>the</strong> predominant crop types,<br />
but mint, sunflowers, strawberries, <strong>and</strong> sugar beets also<br />
were grown. Crop-water requirements were derived using<br />
published data (Cuenca <strong>and</strong> o<strong>the</strong>rs, 1992), evapotranspiration<br />
(ET) totals recorded at Bureau <strong>of</strong> Reclamation Agrimet sites<br />
in <strong>Klamath</strong> Falls <strong>and</strong> Worden, <strong>and</strong> information provided<br />
by State <strong>and</strong> county agricultural agencies. The irrigation<br />
seasons for certain crop types were determined from Agrimet<br />
data, interviews with county <strong>and</strong> State agricultural agencies,<br />
<strong>and</strong> from published crop reports by <strong>the</strong> U.S. Department <strong>of</strong><br />
Agriculture (2004). Sprinkler application efficiency rates<br />
were not field measured but obtained from published sources,<br />
including King <strong>and</strong> o<strong>the</strong>rs (1978) <strong>and</strong> from communication<br />
with State agricultural agents. Efficiencies assigned ranged<br />
from 45 percent for gravity systems, to 75 percent for most<br />
center pivots, to 90 percent for drip systems. Most groundwater<br />
irrigation was done using sprinkler systems. The average<br />
application efficiency was estimated to be about 72 percent.<br />
Withdrawals were computed by dividing <strong>the</strong> crop-water<br />
requirements by <strong>the</strong> irrigation method efficiency.<br />
On l<strong>and</strong>s with primary surface-water rights (outside <strong>of</strong><br />
irrigation districts) <strong>and</strong> supplemental ground-water rights, <strong>the</strong><br />
wells were assumed to have been used <strong>and</strong> were assigned 50<br />
percent <strong>of</strong> <strong>the</strong> computed total irrigation requirement. About<br />
620 acres with supplemental ground-water rights outside<br />
<strong>of</strong> irrigation districts were estimated to have been irrigated<br />
in 2000. This estimate may be conservative for reasons<br />
previously listed.<br />
During <strong>the</strong> 2000 irrigation season, an estimated 150,000<br />
acre-ft <strong>of</strong> ground water was pumped to irrigate about 59,600<br />
acres (table 4 <strong>and</strong> fig. 18). In <strong>Oregon</strong>, 19,200 acres were<br />
irrigated with ground water (about 32 percent <strong>of</strong> <strong>the</strong> total),<br />
<strong>and</strong> 40,400 acres (68 percent <strong>of</strong> <strong>the</strong> total) were irrigated with<br />
ground water in California. Withdrawals in <strong>the</strong> Butte Valley<br />
were about 75,600 acre-ft, or 50 percent <strong>of</strong> <strong>the</strong> total in <strong>the</strong><br />
upper <strong>Klamath</strong> <strong>Basin</strong>. All withdrawals for this subbasin were<br />
in California. Pumpage in <strong>the</strong> upper Lost River subbasin,<br />
which includes Swan Lake, Langell, Yonna, <strong>and</strong> Poe Valleys<br />
in <strong>Oregon</strong>, totaled about 28,800 acre-ft, or 19 percent <strong>of</strong> <strong>the</strong><br />
total withdrawals. All irrigated acres for this subbasin were<br />
in <strong>Oregon</strong>. In <strong>the</strong> Sprague River <strong>Basin</strong>, approximately 11,600<br />
acre-ft <strong>of</strong> water was pumped, about 8 percent <strong>of</strong> <strong>the</strong> total<br />
pumpage in <strong>the</strong> study area. Pumpage in <strong>the</strong> lower Lost River<br />
<strong>and</strong> Lower <strong>Klamath</strong> Lake subbasin, which span both States,<br />
totaled about 28,600 acre-ft, or about 19 percent <strong>of</strong> <strong>the</strong> total<br />
pumpage. <strong>Ground</strong>-water pumpage for irrigation in <strong>the</strong> Wood<br />
River subbasin totaled only about 1,100 acre-ft.<br />
Table 4. Estimated ground-water pumping for irrigation in <strong>the</strong><br />
upper <strong>Klamath</strong> <strong>Basin</strong>, <strong>Oregon</strong> <strong>and</strong> California, during water year<br />
2000.<br />
Subbasin<br />
Area irrigated<br />
with ground water<br />
(acres)<br />
Estimated<br />
pumpage<br />
(acre-feet)<br />
<strong>Upper</strong> Williamson River 2,100 4,600<br />
Sprague River 4,300 11,600<br />
Wood River 360 1,100<br />
<strong>Upper</strong> Lost River 10,500 28,800<br />
Lower Lost River 4,700 11,500<br />
Lower <strong>Klamath</strong> Lake 5,600 17,100<br />
Butte Valley 32,000 75,600<br />
Total (rounded) 59,600 150,000
Creek<br />
40 <strong>Ground</strong>-<strong>Water</strong> <strong>Hydrology</strong> <strong>of</strong> <strong>the</strong> <strong>Upper</strong> <strong>Klamath</strong> <strong>Basin</strong>, <strong>Oregon</strong> <strong>and</strong> California<br />
43°15'<br />
122°30' 15'<br />
138<br />
Tokatee<br />
Falls<br />
Clearwater<br />
D O U G L A S<br />
230<br />
122°00'<br />
DiamondMount<br />
Lake ThielsenBeaver<br />
Marsh<br />
138<br />
97<br />
45'<br />
Chemult<br />
30'<br />
Road<br />
15'<br />
31<br />
Silver<br />
Lake<br />
121°00'<br />
EXPLANATION<br />
Area with primary<br />
ground-water rights<br />
in <strong>Oregon</strong><br />
Area irrigated with<br />
ground water in 2000<br />
Irrigated area within<br />
<strong>the</strong> Bureau <strong>of</strong><br />
Reclamation’s<br />
<strong>Klamath</strong> Project<br />
43°00'<br />
Prospect<br />
45'<br />
62<br />
Cascade<br />
Gorge<br />
30'<br />
15'<br />
42°00'<br />
45'<br />
Butte<br />
Falls<br />
66<br />
Dry Cr<br />
Union<br />
Creek<br />
J A C K S O N<br />
Mt<br />
McLoughlin<br />
Mill Cr<br />
Jenny<br />
Cr<br />
Fall<br />
Cr<br />
<strong>Klamath</strong><br />
Iron<br />
Gate<br />
Res<br />
Montague<br />
Little<br />
Shasta<br />
Lake<br />
<strong>of</strong> <strong>the</strong><br />
Woods<br />
River<br />
River<br />
Annie<br />
Sun<br />
Creek<br />
Creek<br />
S<strong>and</strong><br />
Creek<br />
Wood<br />
River<br />
<strong>Upper</strong><br />
Agency<br />
Lake<br />
<strong>Klamath</strong><br />
Lake<br />
John C. Boyle<br />
Reservoir<br />
Pinehurst Keno<br />
Keno Midl<strong>and</strong><br />
Lincoln<br />
Bogus<br />
Crater Lake<br />
Copco<br />
Lake<br />
Pelican<br />
Butte<br />
Rocky<br />
Point<br />
Edge Cr<br />
<strong>Klamath</strong><br />
Agency<br />
Fort<br />
<strong>Klamath</strong><br />
140<br />
62<br />
Dorris<br />
Butte<br />
Valley<br />
Larkin<br />
Creek<br />
Dam<br />
<strong>Klamath</strong><br />
Strait<br />
66<br />
Lenz<br />
Kirk<br />
Silver<br />
Solomon<br />
Butte<br />
Sprague<br />
Dairy<br />
<strong>Klamath</strong> Falls<br />
Altamont<br />
Lake<br />
Ewauna<br />
Olene<br />
Henley<br />
Lost River<br />
Diversion<br />
Channel<br />
Lower<br />
<strong>Klamath</strong><br />
Lake<br />
Lake<br />
Whitehorse<br />
Spring<br />
McReady<br />
Chiloquin Spring<br />
Narrows<br />
ChiloquinKamkaun<br />
Spring<br />
Modoc<br />
Point<br />
<strong>Klamath</strong> Valley<br />
<strong>Klamath</strong> Hills<br />
Worden<br />
S I S K I Y O U<br />
Red Rock Valley<br />
<strong>Klamath</strong><br />
Marsh<br />
Wildhorse<br />
Ridge<br />
Merrill<br />
Lost<br />
River<br />
Williamson<br />
Sprague<br />
River<br />
Tule<br />
Lake<br />
Sump<br />
River<br />
K L A M AT H<br />
Swan Lake Valley<br />
Yonna Valley<br />
Sheepy Ridge<br />
Taylor<br />
Butte<br />
Lost<br />
Rocky<br />
Ford<br />
River<br />
Bly<br />
Mt<br />
70<br />
Malin<br />
River<br />
Tulelake<br />
Sycan<br />
Bonanza<br />
Yamsay<br />
Mountain<br />
Torrent<br />
Spring<br />
Study<br />
Spodue<br />
Mountain<br />
Bryant Mountain<br />
Langell<br />
Valley<br />
River<br />
Beatty<br />
Yainax<br />
Butte<br />
Lorella<br />
Miller Cr<br />
Clear<br />
Lake<br />
Res<br />
area<br />
Sycan<br />
Marsh<br />
Bly Ridge<br />
N<br />
Bly<br />
Fk<br />
S Fork<br />
Gerber<br />
Reservoir<br />
Willow<br />
Boles<br />
River<br />
Sprague<br />
Summer<br />
Lake<br />
boundary<br />
L A K E<br />
M O D O C<br />
Creek<br />
River<br />
Sprague<br />
Creek<br />
Winter Ridge<br />
120°45'<br />
Summer Lake<br />
Barns Rim<br />
OREGON<br />
CALIFORNIA<br />
Modoc Plateau<br />
31<br />
Gearhart<br />
Mountain<br />
Coleman Rim<br />
Quartz<br />
Mountain<br />
140<br />
41°30'<br />
Shasta River<br />
5<br />
Whitney<br />
Creek<br />
97<br />
Butte<br />
Medicine<br />
Lake<br />
Volcano<br />
Scale 1:1,000,000<br />
5 0 5 10 15 20 MILES<br />
5 0 5 10 15 20 KILOMETERS<br />
139<br />
299<br />
Pit<br />
River<br />
See table <strong>of</strong> contents for mapping sources<br />
Figure 18. Areas irrigated with ground water in <strong>the</strong> upper <strong>Klamath</strong> <strong>Basin</strong>, <strong>Oregon</strong> <strong>and</strong> California, during <strong>the</strong> 2000 water year,<br />
<strong>and</strong> areas with primary ground-water irrigation rights in <strong>Oregon</strong>.<br />
OR19-0048_fig18
<strong>Ground</strong>-<strong>Water</strong> <strong>Hydrology</strong> 41<br />
Recent Increases in <strong>the</strong> Rate <strong>of</strong> <strong>Ground</strong>-<strong>Water</strong><br />
Pumping<br />
The number <strong>of</strong> acres irrigated with ground water in <strong>the</strong><br />
<strong>Oregon</strong> part <strong>of</strong> <strong>the</strong> upper <strong>Klamath</strong> <strong>Basin</strong> increased by about<br />
1,800 acres per year between 1950 <strong>and</strong> 2000. Figure 19<br />
shows that <strong>the</strong> total acres in <strong>the</strong> <strong>Klamath</strong> <strong>Basin</strong> with primary<br />
ground-water rights in <strong>Oregon</strong> increased slowly with time,<br />
with periodic larger increases associated with droughts in <strong>the</strong><br />
late 1960s, late 1970s, <strong>and</strong> early 1990s. Historical information<br />
on ground-water use in California was not readily available.<br />
<strong>Ground</strong>-water withdrawal in <strong>the</strong> entire upper <strong>Klamath</strong><br />
<strong>Basin</strong> during water year 2000 is estimated to have been<br />
about 150,000 acre-ft (table 4). The amounts <strong>of</strong> historical<br />
supplemental ground-water pumping are not known, but<br />
generally are assumed to be a fraction <strong>of</strong> <strong>the</strong> total amount<br />
pumped. The number <strong>of</strong> acres with supplemental ground-water<br />
rights is less than one-half <strong>the</strong> number with primary rights, <strong>and</strong><br />
supplemental ground-water use presumably occurs only during<br />
dry years or parts <strong>of</strong> irrigation seasons when surface water is<br />
not available.<br />
Since 2001, <strong>the</strong>re has been a marked increase in groundwater<br />
pumping in <strong>the</strong> upper <strong>Klamath</strong> <strong>Basin</strong> in response<br />
to changes in surface-water management <strong>and</strong> to a series<br />
<strong>of</strong> consecutive dryer-than-average years. The increase is<br />
largely due to government programs such as Reclamation’s<br />
ground-water acquisition program in 2001 <strong>and</strong> pilot water<br />
bank in 2003, 2004, <strong>and</strong> 2005 designed to augment surfacewater<br />
supplies. The pilot water bank was m<strong>and</strong>ated by <strong>the</strong><br />
2002 NOAA Fisheries Biological Opinion (National Marine<br />
Fisheries Service, 2002) regarding operation <strong>of</strong> <strong>the</strong> <strong>Klamath</strong><br />
Project <strong>and</strong> its effects on <strong>Klamath</strong> River coho salmon.<br />
Pumping for Reclamation programs, which accounts for<br />
most <strong>the</strong> new use, is metered <strong>and</strong> <strong>the</strong>refore reasonably well<br />
quantified. The amounts <strong>of</strong> pumping related to Reclamation<br />
programs are shown in table 5. Flow-meter data provided to<br />
Reclamation by well owners indicates that <strong>the</strong> total amounts<br />
<strong>of</strong> ground water pumped for <strong>the</strong> water bank in 2003 <strong>and</strong> 2004<br />
were approximately 55,700 <strong>and</strong> 75,800 acre-ft respectively.<br />
The reported pumpage for <strong>the</strong> water bank in 2003 represents a<br />
41-percent increase over <strong>the</strong> estimated pumping during 2000<br />
in <strong>the</strong> upper <strong>Klamath</strong> <strong>Basin</strong>. The 2004 pumpage represents<br />
a 56-percent increase. The spatial distribution <strong>of</strong> 2003 <strong>and</strong><br />
2004 water-bank pumping is shown in figure 20. Most <strong>of</strong> this<br />
increased pumping (about 61,000 acre-ft) was in <strong>the</strong> lower<br />
Lost River <strong>and</strong> Lower <strong>Klamath</strong> Lake subbasins. <strong>Ground</strong>-water<br />
pumping in this area prior to 2001 is estimated to be about<br />
28,600 acre-ft. Therefore, <strong>the</strong> additional 61,000 acre-ft <strong>of</strong><br />
water-bank pumping during 2004 represents an approximate<br />
3-fold increase in <strong>the</strong> total ground-water use in that area. The<br />
response to this increased pumping is discussed in <strong>the</strong> section<br />
on hydraulic head fluctuations.<br />
175<br />
150<br />
All ground-water irrigated acres (<strong>Oregon</strong> only)<br />
Acres with primary rights (<strong>Oregon</strong> only)<br />
Acres with supplemental rights (<strong>Oregon</strong> only)<br />
125<br />
ACRES, IN THOUSANDS<br />
100<br />
75<br />
50<br />
25<br />
0<br />
1940<br />
1945<br />
1950<br />
1955<br />
1960<br />
1965<br />
1970<br />
1975<br />
1980<br />
1985<br />
1990<br />
1995<br />
2000<br />
Figure 19. Growth in total acreage with ground-water irrigation rights (primary <strong>and</strong> supplemental) in <strong>the</strong> upper<br />
<strong>Klamath</strong> <strong>Basin</strong> in <strong>Oregon</strong> through 2005.
42 <strong>Ground</strong>-<strong>Water</strong> <strong>Hydrology</strong> <strong>of</strong> <strong>the</strong> <strong>Upper</strong> <strong>Klamath</strong> <strong>Basin</strong>, <strong>Oregon</strong> <strong>and</strong> California<br />
Table 5. <strong>Ground</strong>-water pumping for <strong>the</strong> Bureau <strong>of</strong> Reclamation<br />
pilot water bank <strong>and</strong> ground-water acquisition program, upper<br />
<strong>Klamath</strong> <strong>Basin</strong>, <strong>Oregon</strong> <strong>and</strong> California.<br />
[Data from Bureau <strong>of</strong> Reclamation <strong>and</strong> <strong>Oregon</strong> <strong>Water</strong> Resources Department.<br />
Values in acre-feet]<br />
Source<br />
<strong>Water</strong> year<br />
2001 2002 2003 2004<br />
Reported pumpage from 29,000 0 38,900 62,900<br />
private wells 1<br />
Pumpage from Tule Lake 10,300 18,600 16,800 12,900<br />
Irrigation District wells<br />
Total 2 39,300 18,600 55,700 75,800<br />
1<br />
Includes some irrigation district wells in <strong>Oregon</strong>.<br />
2<br />
Totals include only pumpage related to government sponsored programs.<br />
Hydraulic Head Distribution <strong>and</strong> <strong>Ground</strong>-<strong>Water</strong><br />
Flow Directions<br />
Hydraulic head provides <strong>the</strong> driving force for groundwater<br />
flow. <strong>Ground</strong> water flows from areas <strong>of</strong> high head<br />
toward areas <strong>of</strong> low head. The change <strong>of</strong> head with distance<br />
is referred to as <strong>the</strong> “head gradient.” In <strong>the</strong> uppermost parts <strong>of</strong><br />
aquifer systems, <strong>the</strong> head generally follows topography <strong>and</strong><br />
is highest in upl<strong>and</strong> areas, where recharge typically occurs,<br />
<strong>and</strong> lowest in lowl<strong>and</strong> areas, where ground water typically<br />
discharges to streams. Hydraulic head <strong>of</strong>ten changes with<br />
depth as well as horizontally, so ground-water movement<br />
typically includes a vertical component <strong>of</strong> flow. Vertical head<br />
gradients are downward in recharge areas; as a result, <strong>the</strong><br />
elevation <strong>of</strong> <strong>the</strong> static (nonpumping) water levels in wells in<br />
recharge areas decreases (becomes deeper) with increasing<br />
well depth. Head gradients are typically upward in discharge<br />
areas, causing <strong>the</strong> elevation <strong>of</strong> <strong>the</strong> static water levels in wells<br />
to increase (become shallower) with increasing well depth.<br />
If an upward vertical gradient is sufficient, wells <strong>of</strong> a certain<br />
depth may flow at <strong>the</strong> surface. Flowing artesian wells are<br />
common in parts <strong>of</strong> <strong>the</strong> Wood <strong>and</strong> Sprague River subbasins.<br />
Knowing <strong>the</strong> distribution <strong>of</strong> hydraulic head is critical to<br />
underst<strong>and</strong>ing <strong>the</strong> directions <strong>of</strong> ground-water flow. Figure 21<br />
shows <strong>the</strong> generalized hydraulic head distribution in <strong>the</strong><br />
upper <strong>Klamath</strong> <strong>Basin</strong>. Information used to map hydraulic<br />
head is obtained from water wells, springs, <strong>and</strong> streams.<br />
The static water level in a well represents <strong>the</strong> hydraulic<br />
head in <strong>the</strong> aquifer at <strong>the</strong> depth <strong>of</strong> <strong>the</strong> open interval <strong>of</strong> <strong>the</strong><br />
well. <strong>Water</strong> levels in wells open to more than one aquifer,<br />
or to large vertical thicknesses in a single aquifer, represent<br />
an average <strong>of</strong> <strong>the</strong> heads in <strong>the</strong> open interval. Springs also<br />
provide information on hydraulic head distribution, as springs<br />
represent places where <strong>the</strong> water table intersects l<strong>and</strong> surface.<br />
Large-volume springs provide useful information on <strong>the</strong> head<br />
in <strong>the</strong> regional ground-water flow system. Stream reaches<br />
that gain flow from ground-water discharge also provide<br />
information on <strong>the</strong> hydraulic head distribution <strong>of</strong> <strong>the</strong> groundwater<br />
system. Streams that gain large volumes <strong>of</strong> water due to<br />
ground-water inflow are at or below <strong>the</strong> elevation <strong>of</strong> <strong>the</strong> head<br />
in <strong>the</strong> adjacent aquifer system. The mapping <strong>of</strong> <strong>the</strong> hydraulic<br />
head distribution in <strong>the</strong> upper <strong>Klamath</strong> <strong>Basin</strong> relied upon data<br />
from all <strong>of</strong> <strong>the</strong>se sources. <strong>Water</strong> level measurements from<br />
approximately 1,000 field-located water wells provided most<br />
<strong>of</strong> <strong>the</strong> detailed information in populated parts <strong>of</strong> <strong>the</strong> basin. In<br />
sparsely populated <strong>and</strong> unpopulated parts <strong>of</strong> <strong>the</strong> basin, where<br />
wells are scarce, springs provided much <strong>of</strong> <strong>the</strong> information.<br />
Spring elevations generally were obtained from 1:24,000-<br />
scale topographic maps. Gaining stream reaches were used to<br />
constrain head elevations in <strong>the</strong> Williamson River drainage,<br />
Wood River Valley, <strong>and</strong> in <strong>the</strong> <strong>Klamath</strong> River canyon below<br />
John C. Boyle Dam. Heads shown on figure 21 in <strong>the</strong> Lost<br />
River subbasin from <strong>the</strong> outlet <strong>of</strong> Clear Lake Reservoir<br />
(Malone Dam) to Olene Gap were modified from Grondin<br />
(2004), <strong>and</strong> contours in <strong>the</strong> Butte Valley area were modified<br />
from Wood (1960).<br />
The head distribution depicted in figure 21 is a<br />
generalization. Limited available data prevented mapping<br />
all <strong>the</strong> complexities <strong>of</strong> <strong>the</strong> true head distribution. The map<br />
depicts <strong>the</strong> top <strong>of</strong> <strong>the</strong> saturated zone as closely as possible,<br />
<strong>and</strong> generally represents <strong>the</strong> water-table surface. For low-lying<br />
areas, <strong>the</strong> map is based on static water levels in wells <strong>and</strong> may<br />
not reflect water levels in temporarily saturated soil horizons<br />
in irrigated areas. For <strong>the</strong> Wood River subbasin, <strong>the</strong> map<br />
was drawn using wells penetrating an artesian aquifer, where<br />
<strong>the</strong> heads are locally above l<strong>and</strong> surface. Contours are most<br />
detailed <strong>and</strong> have <strong>the</strong> smallest intervals in areas where data are<br />
plentiful, <strong>and</strong> more generalized with large intervals where data<br />
area sparse.<br />
The highest water-level elevations in <strong>the</strong> upper <strong>Klamath</strong><br />
<strong>Basin</strong> occur in <strong>the</strong> principal recharge areas. These include <strong>the</strong><br />
Cascade Range, <strong>the</strong> highl<strong>and</strong> around Medicine Lake Volcano,<br />
<strong>and</strong> upl<strong>and</strong>s along <strong>the</strong> eastern margin <strong>of</strong> <strong>the</strong> basin, including<br />
Yamsay Mountain, Winter Ridge, Gearhart Mountain, <strong>and</strong><br />
Coleman <strong>and</strong> Barns Rims. <strong>Ground</strong> water flows from <strong>the</strong><br />
Cascade Range eastward toward <strong>the</strong> lower elevations <strong>of</strong> <strong>the</strong><br />
basin. From Crater Lake, head gradients are toward <strong>Klamath</strong><br />
Marsh <strong>and</strong> sou<strong>the</strong>astward toward <strong>the</strong> Wood River valley.<br />
South <strong>of</strong> Crater Lake, ground water flows eastward toward<br />
<strong>the</strong> Wood River Valley <strong>and</strong> <strong>Upper</strong> <strong>Klamath</strong> Lake. Where <strong>the</strong><br />
<strong>Klamath</strong> River cuts through <strong>the</strong> Cascade Range, ground-water<br />
flow is generally parallel to <strong>the</strong> axis <strong>of</strong> <strong>the</strong> range <strong>and</strong> toward<br />
<strong>the</strong> river. From <strong>the</strong> Medicine Lake highl<strong>and</strong>s, ground water<br />
flows generally northward toward Butte Valley <strong>and</strong> <strong>the</strong> Lower<br />
<strong>Klamath</strong> <strong>and</strong> Tule Lake subbasins. Head gradients along <strong>the</strong><br />
eastern margin <strong>of</strong> <strong>the</strong> basin are generally westward. From<br />
Yamsay Mountain, ground water flows westward toward <strong>the</strong><br />
upper Williamson River, <strong>and</strong> sou<strong>the</strong>astward toward Sycan<br />
Marsh. <strong>Ground</strong> water flows from <strong>the</strong> Gearhart Mountain area<br />
generally southwestward toward <strong>the</strong> Sycan <strong>and</strong> Sprague River<br />
drainages. From <strong>the</strong> Barns Rim area, ground water flows<br />
generally toward Gerber Reservoir <strong>and</strong> <strong>the</strong> upper Lost River.<br />
In <strong>the</strong> Modoc Plateau area east <strong>and</strong> south <strong>of</strong> Clear Lake, head<br />
gradients slope westward toward <strong>the</strong> Tule Lake subbasin.
<strong>Ground</strong>-<strong>Water</strong> <strong>Hydrology</strong> 43<br />
122°00' 45' 30' 121°15'<br />
Modoc<br />
Point<br />
Sprague<br />
Sprague<br />
River<br />
River<br />
Beatty<br />
Bly Ridge<br />
42°15'<br />
<strong>Upper</strong><br />
<strong>Klamath</strong><br />
Bly<br />
Mt<br />
Lake<br />
Swan Lake Valley<br />
Yainax<br />
Butte<br />
<strong>Klamath</strong> Falls<br />
Dairy<br />
42°00'<br />
Lake<br />
Ewauna<br />
Keno<br />
Keno<br />
Dam<br />
<strong>Klamath</strong><br />
Strait<br />
Worden<br />
KLAMATH<br />
RIVER<br />
Midl<strong>and</strong><br />
Altamont<br />
Olene<br />
Henley<br />
<strong>Klamath</strong> Hills<br />
<strong>Klamath</strong> Valley<br />
Lost River<br />
Diversion<br />
Channel<br />
Merrill<br />
Lost<br />
Malin<br />
River<br />
Bonanza<br />
Bryant Mountain<br />
Lorella<br />
Miller Cr<br />
Langell<br />
Valley<br />
OREGON<br />
CALIFORNIA<br />
Dorris<br />
Butte<br />
Valley<br />
EXPLANATION<br />
2003 annual estimated pumpage—<br />
In acre-feet per well included<br />
in <strong>the</strong> water bank<br />
Lower<br />
<strong>Klamath</strong><br />
Lake<br />
Sheepy Ridge<br />
Lost<br />
River<br />
Tule<br />
Lake<br />
Sump<br />
Tulelake<br />
Clear<br />
Lake<br />
Res<br />
0–250<br />
41°45'<br />
251–750<br />
751–1500<br />
1501–3000<br />
More than 3000<br />
0 5 10 15 MILES<br />
0 5 10 KILOMETERS<br />
See table <strong>of</strong> contents for mapping sources<br />
Figure 20. Distribution <strong>of</strong> ground-water pumping for <strong>the</strong> Bureau <strong>of</strong> Reclamation pilot water bank during water years 2003 <strong>and</strong><br />
2004, upper <strong>Klamath</strong> <strong>Basin</strong>, <strong>Oregon</strong> <strong>and</strong> California. (Data from Reclamation water bank records <strong>and</strong> OWRD meter readings.)<br />
OR19-0048_fig20a
44 <strong>Ground</strong>-<strong>Water</strong> <strong>Hydrology</strong> <strong>of</strong> <strong>the</strong> <strong>Upper</strong> <strong>Klamath</strong> <strong>Basin</strong>, <strong>Oregon</strong> <strong>and</strong> California<br />
122°00' 45' 30' 121°15'<br />
Modoc<br />
Point<br />
Sprague<br />
Sprague<br />
River<br />
River<br />
Beatty<br />
Bly Ridge<br />
42°15'<br />
<strong>Upper</strong><br />
<strong>Klamath</strong><br />
Bly<br />
Mt<br />
Lake<br />
Swan Lake Valley<br />
Yainax<br />
Butte<br />
<strong>Klamath</strong> Falls<br />
Dairy<br />
42°00'<br />
Lake<br />
Ewauna<br />
Keno<br />
Keno<br />
Dam<br />
<strong>Klamath</strong><br />
Strait<br />
Worden<br />
KLAMATH<br />
RIVER<br />
Midl<strong>and</strong><br />
Altamont<br />
Olene<br />
Henley<br />
<strong>Klamath</strong> Hills<br />
<strong>Klamath</strong> Valley<br />
Lost River<br />
Diversion<br />
Channel<br />
Merrill<br />
Lost<br />
Malin<br />
River<br />
Bonanza<br />
Bryant Mountain<br />
Lorella<br />
Miller Cr<br />
Langell<br />
Valley<br />
OREGON<br />
CALIFORNIA<br />
Dorris<br />
Butte<br />
Valley<br />
EXPLANATION<br />
2004 annual estimated pumpage—<br />
In acre-feet per well included<br />
in <strong>the</strong> water bank<br />
Lower<br />
<strong>Klamath</strong><br />
Lake<br />
Sheepy Ridge<br />
Lost<br />
River<br />
Tule<br />
Lake<br />
Sump<br />
Tulelake<br />
Clear<br />
Lake<br />
Res<br />
0–250<br />
41°45'<br />
251–750<br />
751–1500<br />
1501–3000<br />
More than 3000<br />
0 5 10 15 MILES<br />
0 5 10 KILOMETERS<br />
See table <strong>of</strong> contents for mapping sources<br />
Figure 20.—Continued.<br />
OR19-0048_fig20b
Creek<br />
<strong>Ground</strong>-<strong>Water</strong> <strong>Hydrology</strong> 45<br />
43°15'<br />
43°00'<br />
45'<br />
30'<br />
15'<br />
42°00'<br />
45'<br />
122°30' 15'<br />
138<br />
D O U G L A S<br />
62<br />
Butte<br />
Falls<br />
66<br />
Dry Cr<br />
5000<br />
Prospect<br />
J A C K S O N<br />
Mt<br />
McLoughlin<br />
Mill Cr<br />
4000<br />
3000<br />
Jenny<br />
Cr<br />
4200<br />
<strong>Klamath</strong><br />
Iron<br />
Gate<br />
Res<br />
Little<br />
Pinehurst<br />
Fall<br />
Creek<br />
3000<br />
Bogus<br />
Shasta<br />
Copco<br />
Lake<br />
4000<br />
Diamond<br />
Lake<br />
230<br />
Crater Lake<br />
5000<br />
5000<br />
6000<br />
Lake<br />
<strong>of</strong> <strong>the</strong><br />
Woods<br />
River<br />
Crater<br />
Lake<br />
River<br />
Annie<br />
Pelican<br />
Butte<br />
Rocky<br />
Point<br />
Sun<br />
Creek<br />
John C. Boyle<br />
Reservoir<br />
Edge Cr<br />
5000<br />
122°00'<br />
Mount<br />
Thielsen<br />
4800<br />
4100<br />
Creek<br />
4180<br />
4160<br />
S<strong>and</strong><br />
Creek<br />
Wood<br />
River<br />
4140<br />
4200<br />
<strong>Upper</strong><br />
Agency<br />
Lake<br />
140<br />
138<br />
Fort<br />
<strong>Klamath</strong><br />
4120<br />
4100<br />
Dorris<br />
<strong>Klamath</strong><br />
Lake<br />
66<br />
97<br />
Lenz<br />
45'<br />
Chemult<br />
Silver<br />
Lower<br />
<strong>Klamath</strong><br />
Lake<br />
Lake<br />
Kirk<br />
Solomon<br />
Butte<br />
<strong>Klamath</strong><br />
Agency<br />
Whitehorse<br />
Spring<br />
McReady<br />
62 Chiloquin Spring<br />
Narrows<br />
Chiloquin Kamkaun<br />
Spring<br />
Larkin<br />
Creek<br />
Keno<br />
Keno<br />
Dam<br />
<strong>Klamath</strong><br />
Strait<br />
4240<br />
4220<br />
Miller<br />
Creek<br />
4140<br />
Butte<br />
Valley<br />
5000<br />
4600<br />
4540<br />
Modoc<br />
Point<br />
4140<br />
4220<br />
4080<br />
4120<br />
4520<br />
<strong>Klamath</strong> Valley<br />
<strong>Klamath</strong> Hills<br />
S I S K I Y O U<br />
Red Rock Valley<br />
<strong>Klamath</strong><br />
Marsh<br />
Wildhorse<br />
Ridge<br />
Sprague<br />
Merrill<br />
Lost<br />
River<br />
30'<br />
Williamson<br />
Sprague<br />
River<br />
Tule<br />
Lake<br />
Sump<br />
Sheep<br />
Creek<br />
River<br />
Lost<br />
Road<br />
K L A M AT H<br />
Swan Lake Valley<br />
Yonna Valley<br />
Sheepy Ridge<br />
Taylor<br />
Butte<br />
Dairy<br />
<strong>Klamath</strong> Falls<br />
Lake Ewauna The<br />
Gap<br />
Olene<br />
Lost River<br />
Diversion<br />
Channel<br />
Stukel<br />
Mountain<br />
4080<br />
4400<br />
4200<br />
4600<br />
4040<br />
4060<br />
4500<br />
4700<br />
4120<br />
Poe Valley<br />
4120<br />
4280<br />
5000<br />
Rocky<br />
Ford<br />
River<br />
Bly<br />
Mt<br />
70<br />
Malin<br />
5500<br />
Wickiup<br />
Spring<br />
4300<br />
River<br />
Tulelake<br />
Sycan<br />
Bonanza<br />
15'<br />
Torrent<br />
Spring<br />
Brown<br />
Spring<br />
4120<br />
6000<br />
Study<br />
Bryant Mountain<br />
Langell<br />
Valley<br />
31<br />
Yamsay<br />
Mountain<br />
4340<br />
4140<br />
4200<br />
5500<br />
5000<br />
River<br />
Spodue<br />
Mountain<br />
4900<br />
4800<br />
4500<br />
4400<br />
Beatty<br />
Yainax<br />
Butte<br />
Lorella<br />
5000<br />
Miller Cr<br />
Clear<br />
Lake<br />
Res<br />
Silver<br />
Lake<br />
121°00'<br />
5500<br />
4540<br />
area<br />
Sycan<br />
Marsh<br />
Bly Ridge<br />
N<br />
Bly<br />
Fk<br />
S Fork<br />
Gerber<br />
Reservoir<br />
Willow<br />
Boles<br />
River<br />
Sprague<br />
Well with water-level<br />
measurements<br />
120°45'<br />
Summer<br />
Lake<br />
boundary<br />
L A K E<br />
5000<br />
M O D O C<br />
Creek<br />
River<br />
Sprague<br />
Creek<br />
Winter Ridge<br />
Summer Lake<br />
Barns Rim<br />
140<br />
Modoc Plateau<br />
31<br />
Gearhart<br />
Mountain<br />
Coleman Rim<br />
OREGON<br />
CALIFORNIA<br />
4600<br />
EXPLANATION<br />
Equal elevation <strong>of</strong> water<br />
level contour—<br />
Interval <strong>of</strong> solid lines is<br />
100, 200, 500, <strong>and</strong> 1,000<br />
feet. Interval <strong>of</strong> dotted<br />
lines is 20 feet. Datum<br />
is NGVD 1929.<br />
Direction <strong>of</strong> groundwater<br />
flow<br />
4700<br />
4800<br />
41°30'<br />
Shasta River<br />
5<br />
Whitney<br />
Creek<br />
97<br />
5500<br />
Butte<br />
4400<br />
4600<br />
6000<br />
5500<br />
4800<br />
5500<br />
Medicine<br />
Lake<br />
Volcano<br />
Scale 1:1,000,000<br />
5 0 5 10 15 20 MILES<br />
6000<br />
5 0 5 10 15 20 KILOMETERS<br />
4000<br />
4020<br />
4100<br />
4200<br />
4300<br />
139<br />
4400<br />
4500<br />
299<br />
Pit<br />
River<br />
See table <strong>of</strong> contents for mapping sources<br />
Figure 21. Generalized water-level contours <strong>and</strong> approximate directions <strong>of</strong> regional ground-water flow in <strong>the</strong> upper <strong>Klamath</strong><br />
<strong>Basin</strong>, <strong>Oregon</strong> <strong>and</strong> California.<br />
OR19-0048_fig21
46 <strong>Ground</strong>-<strong>Water</strong> <strong>Hydrology</strong> <strong>of</strong> <strong>the</strong> <strong>Upper</strong> <strong>Klamath</strong> <strong>Basin</strong>, <strong>Oregon</strong> <strong>and</strong> California<br />
Sprague River Subbasin<br />
Hydraulic head data in <strong>the</strong> Sprague River subbasin are<br />
largely limited to valley bottoms <strong>and</strong> are sparse in upl<strong>and</strong><br />
areas. Head data from wells <strong>and</strong> springs indicate regional<br />
ground water flows generally westward from upl<strong>and</strong> areas<br />
around Gearhart Mountain. Between Bly <strong>and</strong> Beatty, ground<br />
water flows toward <strong>the</strong> valley from local recharge areas around<br />
Yainax Butte. <strong>Ground</strong> water also flows toward this part <strong>of</strong> <strong>the</strong><br />
valley from <strong>the</strong> north. These head gradients are consistent with<br />
<strong>the</strong> observed ground-water discharge to <strong>the</strong> river between Bly<br />
<strong>and</strong> Beatty. Head data also show ground water flowing toward<br />
<strong>the</strong> Whisky Creek area from Yainax Butte <strong>and</strong> Bly Mountain.<br />
<strong>Ground</strong> water discharges to streams in <strong>the</strong> Whisky Creek area.<br />
The general pattern <strong>of</strong> ground-water flow toward <strong>the</strong> valley<br />
occurs over most <strong>of</strong> <strong>the</strong> length <strong>of</strong> <strong>the</strong> Sprague River, although<br />
discharge occurs only at specific locations. An upward vertical<br />
head gradient occurs locally in <strong>the</strong> Sprague River Valley.<br />
Numerous flowing artesian wells have been mapped in <strong>the</strong><br />
area between Beatty <strong>and</strong> <strong>the</strong> town <strong>of</strong> Sprague River (Leonard<br />
<strong>and</strong> Harris, 1974). The localized artesian aquifer consists <strong>of</strong><br />
volcanic, fluvial, <strong>and</strong> volcaniclastic deposits confined by finegrained<br />
lacustrine deposits.<br />
Wells are sparse in <strong>the</strong> Sycan River subbasin, so<br />
ground-water flow directions are inferred mostly from spring<br />
altitudes <strong>and</strong> topography. <strong>Ground</strong> water appears to flow from<br />
Winter Ridge <strong>and</strong> upl<strong>and</strong>s south <strong>of</strong> Sycan Marsh generally<br />
westward. <strong>Ground</strong> water flows sou<strong>the</strong>astward toward <strong>the</strong><br />
Sycan River subbasin from Yamsay Mountain. North <strong>of</strong><br />
Spodue Mountain, <strong>the</strong> head gradient is generally northward<br />
toward <strong>the</strong> Sycan River. This is consistent with <strong>the</strong> groundwater<br />
discharge at Torrent Spring. West <strong>and</strong> south <strong>of</strong> Spodue<br />
Mountain, ground water flows generally southward toward<br />
<strong>the</strong> Sprague River subbasin. Piezometer data from Sycan<br />
Marsh show a downward head gradient over most <strong>of</strong> <strong>the</strong> area<br />
(Leslie Bach, The Nature Conservancy, oral commun., 2005).<br />
At <strong>the</strong> nor<strong>the</strong>rn end <strong>of</strong> Sycan Marsh an area on <strong>the</strong> valley<br />
floor contains numerous springs, indicating that upward head<br />
gradients occur locally.<br />
Williamson River Subbasin<br />
The Williamson River originates near Taylor Butte <strong>and</strong><br />
flows generally northward between Yamsay Mountain <strong>and</strong><br />
<strong>the</strong> faulted volcanic upl<strong>and</strong> to <strong>the</strong> west. Two local recharge<br />
areas exist in <strong>the</strong> upper Williamson River drainage. Head<br />
data from wells <strong>and</strong> springs, along with precipitation data,<br />
indicate that Yamsay Mountain is a significant local recharge<br />
area <strong>and</strong> that ground water flows westward from Yamsay<br />
Mountain toward <strong>the</strong> upper Williamson River. Head data,<br />
mostly from springs, indicates that <strong>the</strong> faulted upl<strong>and</strong> west<br />
<strong>of</strong> <strong>the</strong> uppermost Williamson River also is an area <strong>of</strong> local<br />
recharge, <strong>and</strong> that ground water flows from that area eastward<br />
toward <strong>the</strong> Williamson River. Head gradients sloping toward<br />
<strong>the</strong> Williamson River from both <strong>of</strong> <strong>the</strong>se recharge areas causes<br />
<strong>the</strong> river to gain flow due to ground-water discharge in its<br />
uppermost reaches.<br />
Data from wells <strong>and</strong> springs show that <strong>the</strong> head gradient<br />
slopes toward <strong>Klamath</strong> Marsh from recharge areas in <strong>the</strong><br />
Cascade Range. Out on <strong>the</strong> broad plain east <strong>of</strong> <strong>the</strong> Cascade<br />
Range, <strong>the</strong> water table is relatively flat, sloping gently toward<br />
<strong>the</strong> marsh. <strong>Ground</strong>-water flow directions between <strong>Klamath</strong><br />
Marsh <strong>and</strong> Kirk are poorly understood due to <strong>the</strong> lack <strong>of</strong><br />
data. South <strong>of</strong> Kirk <strong>and</strong> west <strong>of</strong> Solomon Butte, a substantial<br />
southward head gradient exists, indicating that ground water<br />
flows from this area toward major discharge (spring) areas<br />
along <strong>the</strong> lower Williamson River <strong>and</strong> tributaries. <strong>Ground</strong><br />
water also appears to flow south <strong>of</strong> Solomon Butte toward<br />
discharge areas along <strong>the</strong> lower Sprague River.<br />
Upward vertical gradients are apparent locally in spring<br />
areas near <strong>the</strong> headwaters <strong>of</strong> <strong>the</strong> Williamson River <strong>and</strong> west<br />
<strong>of</strong> <strong>Klamath</strong> Marsh, where numerous flowing artesian wells<br />
have been mapped. Downward head gradients are apparent in<br />
well data along <strong>the</strong> Williamson River near Sheep Creek <strong>and</strong> in<br />
upl<strong>and</strong>s north <strong>of</strong> <strong>the</strong> marsh. Well 28S/09E-20BAB northwest<br />
<strong>of</strong> <strong>the</strong> marsh had a water-level altitude <strong>of</strong> about 4,510 ft in July<br />
2006, below <strong>the</strong> altitude <strong>of</strong> nearby springs <strong>and</strong> at roughly <strong>the</strong><br />
same altitude as <strong>the</strong> marsh. The water level altitude in well<br />
28S/10E-27DBD was about 4,503 ft in April 2006, several feet<br />
below <strong>the</strong> water level in <strong>the</strong> marsh. This raises <strong>the</strong> possibility<br />
<strong>of</strong> subsurface drainage <strong>of</strong> <strong>the</strong> nor<strong>the</strong>rn part <strong>of</strong> <strong>Klamath</strong> Marsh,<br />
at least during dry climate cycles.<br />
The lower Williamson River (below Kirk) is one <strong>of</strong> <strong>the</strong><br />
most significant ground-water discharge areas in <strong>the</strong> upper<br />
<strong>Klamath</strong> <strong>Basin</strong>. Between its descent from Kirk <strong>and</strong> <strong>the</strong> point<br />
where it emerges onto its delta, <strong>the</strong> Williamson River is largely<br />
confined to a relatively narrow valley. Head gradients slope<br />
toward <strong>the</strong> Williamson River in this area from <strong>the</strong> east <strong>and</strong><br />
west<br />
<strong>Upper</strong> <strong>Klamath</strong> Lake Subbasin<br />
Well <strong>and</strong> spring data show that <strong>the</strong> head gradient<br />
slopes eastward from <strong>the</strong> Cascade Range toward <strong>the</strong> Wood<br />
River Valley north <strong>of</strong> <strong>Upper</strong> <strong>Klamath</strong> Lake. Consequently,<br />
many streams emerging from <strong>the</strong> Cascade Range have large<br />
baseflow, <strong>and</strong> several large springs discharge at <strong>the</strong> western<br />
edge <strong>of</strong> <strong>the</strong> valley. A steep gradient toward <strong>the</strong> basin from <strong>the</strong><br />
east indicates <strong>the</strong> potential for ground-water flow across <strong>the</strong><br />
bounding escarpments from upl<strong>and</strong>s immediately to <strong>the</strong> east.<br />
This gradient from <strong>the</strong> east appears to extend southward at<br />
least to Modoc Point.<br />
A southward hydraulic head gradient from Crater Lake<br />
extends to <strong>the</strong> nor<strong>the</strong>rn edge <strong>of</strong> Agency Lake. Between Crater<br />
Lake <strong>and</strong> <strong>the</strong> nor<strong>the</strong>rn end <strong>of</strong> <strong>the</strong> Wood River Valley, <strong>the</strong><br />
gradient is 100 to 300 ft/mi. The gradient decreases to about<br />
40 ft/mi from <strong>the</strong> nor<strong>the</strong>rn end <strong>of</strong> <strong>the</strong> valley to <strong>the</strong> area <strong>of</strong><br />
Fort <strong>Klamath</strong>, where <strong>the</strong> gradient continues south at less than
<strong>Ground</strong>-<strong>Water</strong> <strong>Hydrology</strong> 47<br />
5 ft/mi. The head altitudes shown in <strong>the</strong> Wood River Valley<br />
on figure 21 represent water bearing strata (generally s<strong>and</strong><br />
<strong>and</strong> pumice) in <strong>the</strong> upper 100–300 ft <strong>of</strong> <strong>the</strong> basin-fill deposits.<br />
These strata are overlain <strong>and</strong> confined by clay layers, resulting<br />
in artesian conditions, with heads above l<strong>and</strong> surface over<br />
much <strong>of</strong> <strong>the</strong> area. This is <strong>the</strong> principal developed aquifer in <strong>the</strong><br />
Wood River Valley.<br />
Little head data exist for <strong>the</strong> ridge east <strong>of</strong> <strong>Upper</strong> <strong>Klamath</strong><br />
Lake; however, springs along <strong>the</strong> margin <strong>of</strong> <strong>Upper</strong> <strong>Klamath</strong><br />
Lake indicate a head gradient toward <strong>the</strong> lake, consistent<br />
with <strong>the</strong> area to <strong>the</strong> north. Head data in <strong>the</strong> Rocky Point area<br />
indicate a gradient toward <strong>the</strong> lake ranging from more than<br />
100 ft/mi in <strong>the</strong> Cascade Range to about 15 ft/mi on <strong>the</strong> valley<br />
floor. The gradients toward <strong>Upper</strong> <strong>Klamath</strong> Lake from <strong>the</strong><br />
north, east, <strong>and</strong> west suggest that ground water is discharging<br />
to <strong>the</strong> lake. South <strong>of</strong> <strong>Upper</strong> <strong>Klamath</strong> Lake, however, <strong>the</strong> head<br />
gradient slopes sou<strong>the</strong>astward toward <strong>the</strong> <strong>Klamath</strong> River<br />
Valley <strong>and</strong> <strong>the</strong> Lower <strong>Klamath</strong> Lake subbasin.<br />
<strong>Upper</strong> Lost River Subbasin<br />
Much <strong>of</strong> head data <strong>and</strong> analysis for <strong>the</strong> upper Lost River<br />
subbasin are from Grondin (2004). The Lost River originates<br />
at Clear Lake Reservoir <strong>and</strong> winds through a complex <strong>of</strong><br />
interconnected structural basins north to Bonanza, west to<br />
Olene Gap, <strong>and</strong> <strong>the</strong>n generally southwestward to Tule Lake.<br />
Head gradients indicate that ground water flows generally<br />
toward <strong>the</strong> upper Lost River Valley from regional recharge<br />
areas to <strong>the</strong> east <strong>and</strong> from local recharge associated with<br />
Bryant Mountain <strong>and</strong> o<strong>the</strong>r upl<strong>and</strong>s surrounding <strong>the</strong> subbasin.<br />
Although data are scarce, ground water appears also to flow<br />
from recharge areas associated with upl<strong>and</strong>s around Yainax<br />
Butte <strong>and</strong> Bly Mountain. The hydraulic head gradient is<br />
exceedingly flat in <strong>the</strong> alluvial valleys <strong>of</strong> <strong>the</strong> upper Lost River<br />
subbasin; however, <strong>the</strong> water-table surface likely is variably<br />
influenced by pumping. Although <strong>the</strong> head gradient in <strong>the</strong><br />
valley is small, it does indicate that ground water moves<br />
generally down valley.<br />
<strong>Ground</strong>-water flow directions in structural valleys<br />
adjacent to <strong>the</strong> upper Lost River subbasin, such as Swan Lake<br />
<strong>and</strong> Yonna Valleys, appear to be generally toward <strong>the</strong> Lost<br />
River. One exception is <strong>the</strong> sou<strong>the</strong>rnmost Poe Valley, where<br />
<strong>the</strong> head gradient slopes steeply southward toward <strong>the</strong> Tule<br />
Lake subbasin. Ano<strong>the</strong>r exception is <strong>the</strong> sou<strong>the</strong>rn part <strong>of</strong><br />
Swan Lake Valley, where <strong>the</strong> gradient appears to slope steeply<br />
toward <strong>the</strong> southwest. The path that ground water follows<br />
out <strong>of</strong> <strong>the</strong> southwestern margin <strong>of</strong> <strong>the</strong> Swan Lake Valley is<br />
unclear, but most likely it is southward toward Olene Gap.<br />
Vertical head gradients are variable in <strong>the</strong> upper<br />
Lost River subbasin. Grondin (2004) evaluated well log<br />
information, geophysical data, <strong>and</strong> water-level measurements,<br />
<strong>and</strong> found downward vertical gradients between basin-fill<br />
sediments <strong>and</strong> <strong>the</strong> underlying basalt to be common along<br />
valley margins <strong>and</strong> upward gradients in valley centers in<br />
<strong>the</strong> eastern Lost River subbasin. Vertical gradients within<br />
<strong>the</strong> sedimentary section or <strong>the</strong> basalt were not common.<br />
Downward vertical gradients were observed in <strong>the</strong> Swan<br />
Lake Valley, but heads in that area generally were above <strong>the</strong><br />
elevation <strong>of</strong> <strong>the</strong> Lost River.<br />
<strong>Klamath</strong> Valley<br />
The <strong>Klamath</strong> Valley area comprises <strong>the</strong> Lost River<br />
drainage from Olene Gap to about Merrill <strong>and</strong> includes <strong>the</strong><br />
area immediately south <strong>of</strong> <strong>Klamath</strong> Falls <strong>and</strong> nor<strong>the</strong>ast <strong>of</strong><br />
<strong>the</strong> <strong>Klamath</strong> Hills. <strong>Ground</strong> water flows into <strong>the</strong> <strong>Klamath</strong><br />
Valley from <strong>the</strong> area <strong>of</strong> <strong>Klamath</strong> Falls <strong>and</strong> <strong>the</strong> upl<strong>and</strong>s to <strong>the</strong><br />
southwest. <strong>Ground</strong> water also flows into <strong>the</strong> <strong>Klamath</strong> Valley<br />
from upl<strong>and</strong>s to <strong>the</strong> nor<strong>the</strong>ast <strong>and</strong> <strong>the</strong> Olene Gap area. Local<br />
recharge creates a gradient toward <strong>the</strong> valley from <strong>the</strong> <strong>Klamath</strong><br />
Hills as well. Within <strong>the</strong> <strong>Klamath</strong> Valley, ground water flows<br />
sou<strong>the</strong>astward toward <strong>the</strong> Tule Lake subbasin. Head gradients<br />
on <strong>the</strong> valley floor are low, averaging 2–3 ft/mi. Sou<strong>the</strong>ast <strong>of</strong><br />
Merrill <strong>and</strong> north <strong>of</strong> Sheepy Ridge, <strong>the</strong> head gradient steepens<br />
to about 20 ft/mi. This steepening coincides with a possible<br />
subsurface extension <strong>of</strong> Sheepy Ridge <strong>and</strong> <strong>the</strong> margin <strong>of</strong> <strong>the</strong><br />
Tule Lake structural basin.<br />
Butte Valley/Red Rock Valley Area<br />
Butte Valley is an internally drained structural basin.<br />
The head distribution in <strong>the</strong> Butte Valley area shown on<br />
figure 21 is modified from Wood (1960) <strong>and</strong> augmented in<br />
adjacent upl<strong>and</strong>s using additional well <strong>and</strong> spring data. Since<br />
<strong>the</strong> creation <strong>of</strong> Wood’s (1960) water-table map, water levels<br />
have declined in parts <strong>of</strong> Butte Valley as much as 15–25 ft in<br />
response to pumping <strong>and</strong> climate. Declines occurred primarily<br />
during 1975–1990 <strong>and</strong> since 2000. The declines appear to be<br />
localized, as water levels have been stable in o<strong>the</strong>r parts <strong>of</strong><br />
Butte Valley. Localized declines since <strong>the</strong> 1950s have changed<br />
<strong>the</strong> configuration <strong>of</strong> <strong>the</strong> water-table surface in Butte Valley,<br />
but have not changed <strong>the</strong> overall regional ground-water flow<br />
directions.<br />
Head data show a steep gradient toward Butte Valley<br />
from volcanic upl<strong>and</strong>s to <strong>the</strong> south <strong>and</strong> west. Gradients from<br />
<strong>the</strong> upl<strong>and</strong>s to <strong>the</strong> south <strong>and</strong> around Medicine Lake Volcano<br />
range from 100 to 300 ft/mi. In <strong>the</strong> lower elevation parts <strong>of</strong> <strong>the</strong><br />
Butte Valley/Red Rock Valley area, gradients flatten markedly<br />
to less than a few feet per mile. <strong>Water</strong>-table altitudes are<br />
between 4,200 <strong>and</strong> 4,230 ft over much <strong>of</strong> this area. The watertable<br />
surface is not smooth, but is affected by local geology,<br />
surface-water hydrology, <strong>and</strong> pumping. There is a regional<br />
nor<strong>the</strong>astward slope to <strong>the</strong> gradient, indicating ground-water<br />
flow from <strong>the</strong> Butte Valley/Red Rock Valley area toward <strong>the</strong><br />
Lower <strong>Klamath</strong> Lake subbasin across <strong>the</strong> intervening upl<strong>and</strong>s.<br />
The gradient steepens beneath <strong>the</strong> intervening upl<strong>and</strong>s to<br />
roughly 50 ft/mi.
48 <strong>Ground</strong>-<strong>Water</strong> <strong>Hydrology</strong> <strong>of</strong> <strong>the</strong> <strong>Upper</strong> <strong>Klamath</strong> <strong>Basin</strong>, <strong>Oregon</strong> <strong>and</strong> California<br />
Lower <strong>Klamath</strong> Lake Subbasin<br />
Lower <strong>Klamath</strong> Lake occupies a structural basin bounded<br />
roughly by <strong>the</strong> <strong>Klamath</strong> River, <strong>the</strong> <strong>Klamath</strong> Hills, upl<strong>and</strong>s<br />
to <strong>the</strong> southwest, <strong>and</strong> Sheepy Ridge. Hydraulic head data<br />
(fig. 21) indicate ground-water flow toward Lower <strong>Klamath</strong><br />
Lake from upl<strong>and</strong>s just north <strong>of</strong> <strong>the</strong> <strong>Klamath</strong> River. There also<br />
is flow from <strong>the</strong> Butte Valley/Red Rock Valley area southwest<br />
<strong>of</strong> <strong>the</strong> basin. Heads in <strong>the</strong> Lower <strong>Klamath</strong> Lake subbasin <strong>and</strong><br />
<strong>Klamath</strong> Valley are similar; however, in <strong>the</strong> <strong>Klamath</strong> Hills,<br />
which separate <strong>the</strong> two subbasins, heads are slightly higher,<br />
indicating local recharge or regional discharge. The higher<br />
heads cause a small gradient toward <strong>the</strong> Lower <strong>Klamath</strong> Lake<br />
subbasin from <strong>the</strong> <strong>Klamath</strong> Hills.<br />
The hydraulic head gradient is very small on <strong>the</strong><br />
floor <strong>of</strong> <strong>the</strong> Lower <strong>Klamath</strong> Lake subbasin, sloping gently<br />
sou<strong>the</strong>astward at 1 to 2 ft/mi over most <strong>of</strong> <strong>the</strong> area. East <strong>of</strong><br />
<strong>the</strong> Lower <strong>Klamath</strong> Lake, near Sheepy Ridge, <strong>the</strong> gradient<br />
steepens to approximately 16 ft/mi toward <strong>the</strong> Tule Lake<br />
subbasin, indicating ground-water flow in that direction. This<br />
is consistent with isotopic data from deep wells in <strong>the</strong> Tule<br />
Lake subbasin, which indicate <strong>the</strong> deep aquifer <strong>the</strong>re contains<br />
a fraction <strong>of</strong> water from <strong>the</strong> Lower <strong>Klamath</strong> Lake subbasin<br />
(Palmer <strong>and</strong> o<strong>the</strong>rs, 2007).<br />
Tule Lake Subbasin<br />
Hydraulic head data from wells shows that ground<br />
water flows toward <strong>the</strong> Tule Lake subbasin from <strong>the</strong> north,<br />
east, <strong>and</strong> west. <strong>Ground</strong> water flows from <strong>the</strong> north from <strong>the</strong><br />
<strong>Klamath</strong> Valley <strong>and</strong> sou<strong>the</strong>rnmost Poe Valley. <strong>Ground</strong> water<br />
flows eastward from <strong>the</strong> Lower <strong>Klamath</strong> Lake subbasin into<br />
<strong>the</strong> Tule Lake subbasin as described in <strong>the</strong> preceding section.<br />
A relatively steep gradient <strong>of</strong> up to 100 ft/mi toward <strong>the</strong><br />
Tule Lake subbasin occurs in <strong>the</strong> Clear Lake area <strong>and</strong> on <strong>the</strong><br />
Modoc Plateau to <strong>the</strong> south. The ground-water flow directions<br />
inferred from hydraulic head gradients are consistent with<br />
isotopic data that suggest that water produced by deep wells<br />
in <strong>the</strong> Tule Lake subbasin originated as recharge in <strong>the</strong> interior<br />
<strong>and</strong> eastern parts <strong>of</strong> <strong>the</strong> upper <strong>Klamath</strong> <strong>Basin</strong> with a probable<br />
component <strong>of</strong> water from <strong>the</strong> Lower <strong>Klamath</strong> Lake subbasin<br />
(Palmer <strong>and</strong> o<strong>the</strong>rs, 2007). Head gradients are small on <strong>the</strong><br />
valley floor, being less than 1 ft/mi in much <strong>of</strong> <strong>the</strong> area.<br />
Analysis by CDWR (Eaves <strong>and</strong> o<strong>the</strong>rs, 2002) indicates that<br />
<strong>the</strong> head gradients in lavas underlying basin-filling sediments<br />
slope gently toward <strong>the</strong> south at 2.5 ft/mi or less. Gradients<br />
are much smaller in <strong>the</strong> shallow water-bearing zones in <strong>the</strong><br />
sedimentary section, <strong>and</strong> are generally toward <strong>the</strong> Tule Lake<br />
Sump. Head data from wells indicate ground-water flow<br />
southward out <strong>of</strong> <strong>the</strong> Tule Lake subbasin, east <strong>of</strong> Medicine<br />
Lake Volcano, toward <strong>the</strong> Pit River <strong>Basin</strong> south <strong>of</strong> <strong>the</strong> study<br />
area.<br />
Subsurface drainage from <strong>the</strong> Tule Lake subbasin is<br />
consistent with historical observations in <strong>the</strong> area, many <strong>of</strong><br />
which were summarized by La Rue (1922). Much <strong>of</strong> this<br />
evidence was manifest prior to <strong>the</strong> draining <strong>of</strong> Tule Lake,<br />
which covered an area <strong>of</strong> about 150 mi 2 prior to draining<br />
(according to a 1905 Reclamation survey map). La Rue cited<br />
Native American accounts <strong>of</strong> a whirlpool in <strong>the</strong> lake, <strong>and</strong><br />
stated that at high stage water discharged into lava flows along<br />
<strong>the</strong> sou<strong>the</strong>rn margin (a phenomenon common in <strong>the</strong> lavas<br />
<strong>of</strong> central <strong>Oregon</strong>). Early efforts to drain <strong>the</strong> lake included<br />
construction <strong>of</strong> pits in <strong>the</strong> lava designed to act as drains. La<br />
Rue noted that silt deposits in <strong>the</strong> lava slope southward, away<br />
from <strong>the</strong> lake. He also considered <strong>the</strong> fact that “waters <strong>of</strong> Tule<br />
Lake are fresh <strong>and</strong> <strong>the</strong> lake bed comparatively free <strong>of</strong> salts” as<br />
pro<strong>of</strong> that <strong>the</strong> lake “in <strong>the</strong> past had an outlet.”<br />
<strong>Klamath</strong> Canyon Area<br />
The <strong>Klamath</strong> Canyon area includes <strong>the</strong> reach <strong>of</strong> <strong>the</strong><br />
<strong>Klamath</strong> River between John C. Boyle <strong>and</strong> Iron Gate Dams.<br />
Along most <strong>of</strong> this reach, <strong>the</strong> river occupies a steep-walled<br />
canyon as it cuts through <strong>the</strong> Cascade Range. The canyon<br />
widens between <strong>the</strong> upper end <strong>of</strong> Copco Lake reservoir <strong>and</strong><br />
Iron Gate Dam, becoming narrow again downstream. Data<br />
from sparse wells <strong>and</strong> numerous springs indicate that ground<br />
water flows toward <strong>the</strong> river throughout <strong>the</strong> <strong>Klamath</strong> Canyon<br />
area.<br />
Fluctuations in Hydraulic Head<br />
Hydraulic head fluctuates with time in response to<br />
external stresses, <strong>the</strong> most important <strong>of</strong> which are variations in<br />
natural recharge from precipitation, pumping, lake stage, <strong>and</strong><br />
recharge from canal leakage. These fluctuations are manifest<br />
as variations in <strong>the</strong> water levels in wells.<br />
<strong>Ground</strong>-water-level fluctuation data are collected by<br />
taking multiple water-level measurements in <strong>the</strong> same well<br />
over a period <strong>of</strong> time. Multiple water-level measurements<br />
are available for 257 wells in <strong>the</strong> upper <strong>Klamath</strong> <strong>Basin</strong>.<br />
Observation wells are monitored periodically by <strong>the</strong> USGS,<br />
OWRD, <strong>and</strong> CDWR. Wells have been monitored for periods<br />
ranging from less than 1 year to more than 50 years, <strong>and</strong><br />
measurements have been made at intervals ranging from once<br />
every 2 hours (using automated recording devices) to a few<br />
times a year. The short-interval measurements effectively<br />
create a continuous record <strong>of</strong> water-level fluctuations.<br />
Ninety-one wells in <strong>the</strong> basin have been monitored by<br />
OWRD, some for periods greater than 50 years. Twenty wells<br />
with relatively long-term (10–50 years) records currently are<br />
being measured by OWRD (fig. 22). Measurements in those<br />
wells generally are made one to four times a year. Sixty-two
Creek<br />
<strong>Ground</strong>-<strong>Water</strong> <strong>Hydrology</strong> 49<br />
43°15'<br />
43°00'<br />
45'<br />
30'<br />
15'<br />
42°00'<br />
45'<br />
122°30' 15'<br />
D O U G L A S<br />
Camp Cr<br />
Scotch Cr<br />
Dry Cr<br />
138<br />
62<br />
Butte<br />
Falls<br />
66<br />
Prospect<br />
J A C K S O N<br />
Mt<br />
McLoughlin<br />
Mill Cr<br />
Jenny<br />
Cr<br />
Little<br />
Fall<br />
Cr<br />
<strong>Klamath</strong><br />
Iron<br />
Gate<br />
Res<br />
Pinehurst<br />
Bogus<br />
Cr<br />
Shasta<br />
Diamond<br />
Lake<br />
Copco<br />
Lake<br />
230<br />
R A N G E<br />
Crater<br />
Lake<br />
C A S C A D E<br />
Spencer<br />
Edge Cr<br />
Lake<br />
<strong>of</strong> <strong>the</strong><br />
Woods<br />
Shovel<br />
River<br />
Cr<br />
Crater<br />
Lake<br />
35S/06E-10ACC<br />
Pelican<br />
Butte<br />
Rocky<br />
Point<br />
Annie<br />
Creek<br />
Sevenmile<br />
122°00'<br />
Scott<br />
Creek<br />
S<strong>and</strong><br />
Creek<br />
Sun<br />
Creek<br />
Cr<br />
Fourmile<br />
Creek<br />
Rock<br />
Creek<br />
River<br />
Creek<br />
Aspen<br />
Lake<br />
John C. Boyle<br />
Reservoir<br />
Mount<br />
Thielsen<br />
138<br />
30S/07E-06AAA<br />
Wood<br />
River<br />
Spring<br />
Creek<br />
Agency<br />
Lake<br />
Keno<br />
Dam<br />
<strong>Klamath</strong><br />
Strait<br />
41S/09E-12AAB<br />
Butte<br />
Valley<br />
Macdoel<br />
Larkin<br />
Creek<br />
Big<br />
Springs<br />
Creek<br />
45'<br />
Lower<br />
<strong>Klamath</strong><br />
Lake<br />
S I S K I Y O U<br />
Red Rock Valley<br />
Jack<br />
Chemult<br />
28S/09E-20BAB<br />
97<br />
Lenz<br />
<strong>Klamath</strong><br />
30'<br />
K L A M AT H<br />
Sprague<br />
Trout Cr<br />
Creek<br />
Wildhorse<br />
Ridge<br />
Fort<br />
<strong>Klamath</strong><br />
Kirk<br />
Solomon<br />
Butte<br />
<strong>Klamath</strong><br />
Agency<br />
Whitehorse<br />
Spring<br />
McReady<br />
62 Chiloquin Spring<br />
Narrows<br />
Chiloquin Kamkaun<br />
Spring<br />
<strong>Klamath</strong> Valley<br />
<strong>Klamath</strong> Hills<br />
Marsh<br />
Yonna Valley<br />
Lost<br />
River<br />
Sheepy Ridge<br />
Williamson<br />
Tule<br />
Lake<br />
Sump<br />
Sheep<br />
Creek<br />
River<br />
Taylor<br />
Butte<br />
Rocky<br />
Ford<br />
River<br />
Lost<br />
Whisky<br />
Creek<br />
River<br />
Long<br />
Sycan<br />
Knot Tablel<strong>and</strong><br />
36S/10E-14ACC<br />
Modoc<br />
<strong>Upper</strong> Point<br />
Sprague<br />
River<br />
<strong>Klamath</strong><br />
36S/11E-20DCA Bly<br />
Mt<br />
38S/09E-17CBC<br />
140 Lake<br />
Keno<br />
Dorris<br />
66<br />
Silver<br />
15'<br />
Yamsay<br />
Mountain<br />
Torrent<br />
Spring<br />
Spodue<br />
Mountain<br />
Bryant Mountain<br />
Creek<br />
River<br />
Brown<br />
Creek<br />
Yainax<br />
Butte<br />
Fivemile<br />
Miller Cr<br />
Clear<br />
Lake<br />
Res<br />
Silver<br />
Lake<br />
Sycan<br />
Marsh<br />
Creek<br />
Meryl<br />
Bly Ridge<br />
121°00'<br />
Fork<br />
EXPLANATION<br />
Wells in <strong>the</strong> <strong>Upper</strong> <strong>Klamath</strong><br />
<strong>Basin</strong><br />
Well monitored quarterly by<br />
USGS<br />
Well equipped with USGS<br />
continuous recorder<br />
<strong>Oregon</strong> <strong>Water</strong> Resources<br />
Department observation<br />
well<br />
California Department <strong>of</strong><br />
<strong>Water</strong> Resources<br />
observation 120°45' well<br />
L A K E<br />
Creek<br />
S Fork<br />
Swan Lake Valley<br />
Dairy<br />
Gerber<br />
<strong>Klamath</strong> Falls<br />
39S/11E-20AAD Reservoir<br />
Lake Ewauna<br />
70 Bonanza<br />
39S/11E-26ABD<br />
Lorella<br />
Olene<br />
39S/12E-35ABB<br />
Lost River<br />
Diversion<br />
39S/12E-35ADD<br />
Channel 40S/11E-11BAD<br />
40S/09E-28ADB 40S/12E-30DCB Langell<br />
Valley<br />
Malin<br />
Merrill<br />
40S/12E-32CDB 41S/14E-08CAA<br />
Tulelake<br />
48N/04E-35L02<br />
46N/01E-06N01<br />
28S/10E-27DBD<br />
Lake<br />
Road<br />
35S/12E-26DCD<br />
Study<br />
31<br />
area<br />
Willow<br />
Boles<br />
M O D O C<br />
River<br />
Sprague<br />
Summer<br />
Lake<br />
boundary<br />
N 36S/14E-25BCB<br />
Beatty<br />
Beatty<br />
Gap<br />
Bly<br />
Deming<br />
Creek<br />
Creek<br />
Cr<br />
Winter Ridge<br />
River<br />
Sprague<br />
Summer Lake<br />
Barns Rim<br />
Modoc Plateau<br />
Gearhart<br />
Mountain<br />
Brownsworth<br />
Creek<br />
140<br />
Coleman Rim<br />
OREGON<br />
CALIFORNIA<br />
31<br />
41°30'<br />
Shasta River<br />
5<br />
Whitney<br />
Creek<br />
97<br />
Butte<br />
Medicine<br />
139<br />
Lake<br />
Volcano<br />
Scale 1:1,000,000<br />
5 0 5 10 15 20 MILES<br />
5 0 5 10 15 20 KILOMETERS<br />
299<br />
Pit<br />
River<br />
See table <strong>of</strong> contents for mapping sources<br />
Figure 22. Selected observation wells in <strong>the</strong> upper <strong>Klamath</strong> <strong>Basin</strong>, <strong>Oregon</strong> <strong>and</strong> California. Location information is only shown<br />
for wells specifically referenced in this report.<br />
OR19-0048_fig22
50 <strong>Ground</strong>-<strong>Water</strong> <strong>Hydrology</strong> <strong>of</strong> <strong>the</strong> <strong>Upper</strong> <strong>Klamath</strong> <strong>Basin</strong>, <strong>Oregon</strong> <strong>and</strong> California<br />
wells were measured quarterly during this study by <strong>the</strong> USGS<br />
for periods ranging from 1 to 6 years (fig. 22). Nineteen wells<br />
were instrumented with continuous recorders, devices that<br />
measure <strong>and</strong> record <strong>the</strong> water-level elevation every 2 hours.<br />
Graphs <strong>of</strong> water-level fluctuations in all <strong>of</strong> <strong>the</strong> wells monitored<br />
by <strong>the</strong> USGS are available on <strong>the</strong> USGS web site (http://<br />
waterdata.usgs.gov/or/nwis/gw). Not all wells monitored in<br />
<strong>the</strong> upper <strong>Klamath</strong> <strong>Basin</strong> are shown in figure 22. Scores <strong>of</strong><br />
additional wells have been or currently are monitored by <strong>the</strong><br />
CDWR <strong>and</strong> <strong>the</strong> OWRD for specific purposes. Data from <strong>the</strong><br />
wells shown in figure 22, which includes all wells monitored<br />
by <strong>the</strong> USGS, provide a comprehensive picture <strong>of</strong> <strong>the</strong> dynamic<br />
nature <strong>of</strong> <strong>the</strong> regional ground-water system.<br />
Climate-Induced Fluctuations<br />
<strong>Water</strong> levels in most wells fluctuate in response to natural,<br />
climate-induced changes in recharge. The greatest response<br />
to climate-induced water-level fluctuations in <strong>the</strong> upper<br />
<strong>Klamath</strong> <strong>Basin</strong> occurs in <strong>the</strong> Cascade Range. The response to<br />
diminished precipitation (<strong>and</strong> hence recharge) in <strong>the</strong> Cascade<br />
Range during <strong>the</strong> current drought cycle is exemplified by <strong>the</strong><br />
hydrograph <strong>of</strong> well 30S/07E-06AAA on <strong>the</strong> lower eastern<br />
flank <strong>of</strong> <strong>the</strong> Crater Lake highl<strong>and</strong>s (fig. 23). The water level in<br />
that well has declined approximately 12 ft since 2000 because<br />
<strong>of</strong> climate-related decreased recharge. On <strong>the</strong> eastern side <strong>of</strong><br />
<strong>the</strong> basin, a similar post-2000 trend exists in well 36S/14E-<br />
25BCB (fig. 24), but <strong>the</strong> magnitude <strong>of</strong> <strong>the</strong> recent decline is<br />
less. A comparison <strong>of</strong> <strong>the</strong>se water-level fluctuations with<br />
precipitation at Crater Lake in <strong>the</strong> Cascade Range (fig. 24)<br />
shows that periods <strong>of</strong> rising ground-water levels generally<br />
correspond to periods <strong>of</strong> increasing precipitation, <strong>and</strong> falling<br />
water-levels correspond to periods <strong>of</strong> decreasing precipitation.<br />
Figure 24 also shows that <strong>the</strong> decadal drought cycles are<br />
responsible for <strong>the</strong> largest water-level fluctuations. During<br />
periods <strong>of</strong> abundant precipitation, <strong>the</strong> rate <strong>of</strong> ground-water<br />
recharge exceeds, at least temporarily, <strong>the</strong> rate <strong>of</strong> discharge.<br />
When ground-water recharge exceeds discharge, <strong>the</strong> amount <strong>of</strong><br />
ground water in storage must increase, causing <strong>the</strong> water table<br />
to rise. During dry periods, in contrast, <strong>the</strong> rate <strong>of</strong> discharge<br />
exceeds <strong>the</strong> rate <strong>of</strong> recharge, <strong>and</strong> ground-water levels decline<br />
as a result.<br />
<strong>Water</strong> table fluctuations in response to variations in<br />
recharge are most prominent in <strong>the</strong> Cascade Range, <strong>the</strong><br />
primary recharge area. Climate-related fluctuations may be<br />
difficult to discern in some interior parts <strong>of</strong> <strong>the</strong> basin, for<br />
two reasons. First, precipitation <strong>and</strong>, hence, recharge are<br />
comparatively small in <strong>the</strong> interior parts <strong>of</strong> <strong>the</strong> basin, so<br />
climate-induced water-level fluctuations are correspondingly<br />
small. Second, water levels in <strong>the</strong>se areas are affected by<br />
ground-water pumping, canal operation, <strong>and</strong> irrigation, <strong>the</strong><br />
effects <strong>of</strong> which can mask <strong>the</strong> climate signal.<br />
186<br />
188<br />
190<br />
DEPTH TO WATER, IN FEET<br />
192<br />
194<br />
196<br />
198<br />
200<br />
J M M J S N J M M J S N J M M J S N J M M J S N J M M J S N J M M J S N<br />
2000 2001 2002 2003 2004 2005<br />
Figure 23.<br />
<strong>Water</strong>-level fluctuations in well 30S/07E-06AAA near Bear Creek nor<strong>the</strong>ast <strong>of</strong> Crater Lake, <strong>Oregon</strong>.
<strong>Ground</strong>-<strong>Water</strong> <strong>Hydrology</strong> 51<br />
DEPTH TO WATER, IN FEET<br />
0<br />
2<br />
4<br />
6<br />
8<br />
10<br />
12<br />
14<br />
16<br />
18<br />
Depth to water in well 36S/14E-25BCB<br />
Cumulative departure from average precipitation at Crater Lake<br />
20<br />
1960 1965 1970 1975 1980 1985 1990 1995 2000<br />
100<br />
80<br />
60<br />
40<br />
20<br />
0<br />
-20<br />
-40<br />
-60<br />
-80<br />
2005 -100<br />
CUMULATIVE DEPARTURE FROM AVERAGE PRECIPITATION, IN INCHES<br />
Figure 24. <strong>Water</strong>-level fluctuations in well 36S/14E-25BCB near Bly <strong>and</strong> <strong>the</strong> cumulative departure from average<br />
precipitation at Crater Lake, <strong>Oregon</strong>.<br />
Pumping-Induced Fluctuations<br />
When a well is pumped, <strong>the</strong> water table near <strong>the</strong> well<br />
declines due to <strong>the</strong> removal <strong>of</strong> ground water from storage.<br />
A conical depression centered on <strong>the</strong> well develops on <strong>the</strong><br />
water table (or potentiometric surface in <strong>the</strong> case <strong>of</strong> a confined<br />
aquifer) <strong>and</strong> exp<strong>and</strong>s until it captures sufficient discharge <strong>and</strong><br />
(or) induces enough new recharge to equal <strong>the</strong> pumping rate.<br />
After pumping ceases, <strong>the</strong> water table recovers as <strong>the</strong> aquifer<br />
returns to pre-pumping conditions. Key factors that determine<br />
<strong>the</strong> magnitude <strong>of</strong> water-table fluctuations caused by pumping<br />
are <strong>the</strong> aquifer characteristics, <strong>the</strong> rate <strong>and</strong> duration <strong>of</strong><br />
pumping, <strong>the</strong> presence <strong>of</strong> aquifer boundaries, <strong>and</strong> <strong>the</strong> number<br />
<strong>of</strong> wells affecting <strong>the</strong> water table in a given area. In aquifers<br />
that have low permeability, pumping-induced water-table<br />
fluctuations can be large <strong>and</strong> even interfere with <strong>the</strong> operation<br />
<strong>of</strong> nearby wells. If <strong>the</strong> long-term average pumping rate exceeds<br />
<strong>the</strong> rate at which <strong>the</strong> aquifer can supply water, water levels will<br />
not recover fully <strong>and</strong> long-term water-level declines will occur.<br />
Seasonal pumping affects many wells throughout <strong>the</strong><br />
upper <strong>Klamath</strong> <strong>Basin</strong>. <strong>Water</strong>-level fluctuations from pumping<br />
generally range from a few feet to 20 ft. Pumping effects<br />
can be seen in <strong>the</strong> hydrographs for a well 35S/12E-26DCD<br />
near Beatty (fig. 25) <strong>and</strong> well 40S/12E-32CDB near Malin<br />
(fig. 26). Hydrographs for both wells have a steep drawdown<br />
curve during <strong>the</strong> summer followed by a broad recovery curve<br />
that rises throughout <strong>the</strong> winter <strong>and</strong> spring. Hydrographs for<br />
<strong>the</strong> wells in figures 25 <strong>and</strong> 26 also show slight year-to-year<br />
declines, probably due to a combination <strong>of</strong> pumping <strong>and</strong><br />
climate.<br />
OR19-0048_fig24<br />
Response to Canal Leakage<br />
<strong>Water</strong>-level fluctuations due to irrigation-canal leakage<br />
occur in many wells throughout <strong>the</strong> irrigated areas in <strong>the</strong><br />
central part <strong>of</strong> <strong>the</strong> study area, with water levels rising<br />
during <strong>the</strong> irrigation season when canals are flowing, <strong>and</strong><br />
falling when canals are dry. The magnitude <strong>of</strong> <strong>the</strong>se annual<br />
fluctuations varies with <strong>the</strong> proximity <strong>of</strong> <strong>the</strong> well to <strong>the</strong><br />
canal, <strong>the</strong> depth <strong>of</strong> <strong>the</strong> well, <strong>and</strong> <strong>the</strong> local geology. Annual<br />
fluctuations due to canal leakage <strong>of</strong> more than 10 ft have been<br />
documented (fig. 27), although fluctuations in <strong>the</strong> range <strong>of</strong> 4 to<br />
5 ft are more common.<br />
The water-level response in well 40S/09E-28ADB<br />
(fig. 27) is an example <strong>of</strong> canal <strong>and</strong> drain influences on wells<br />
open to sedimentary materials. This well is constructed into<br />
late Tertiary sediment on <strong>the</strong> northwest flank <strong>of</strong> <strong>the</strong> <strong>Klamath</strong><br />
Hills, about 900 ft from <strong>the</strong> North Canal. The North Canal is<br />
diverted directly from <strong>the</strong> <strong>Klamath</strong> River <strong>and</strong> operates almost<br />
continuously. Although <strong>the</strong> water-level in <strong>the</strong> well responds<br />
to <strong>the</strong> canal operation nearly year-round, <strong>the</strong> response is<br />
most prevalent during <strong>the</strong> summer irrigation season. Note<br />
that <strong>the</strong> ground-water response to canal leakage was almost<br />
nonexistent in 2001, when no water flowed through <strong>the</strong><br />
<strong>Klamath</strong> Project canals for most <strong>of</strong> <strong>the</strong> irrigation season<br />
(fig. 27).<br />
<strong>Ground</strong>-water levels can respond rapidly to canal<br />
leakage, even at considerable depths, particularly in areas<br />
where fractured lava is <strong>the</strong> predominant rock type. Well<br />
39S/12E-35ABB was constructed to allow separate waterlevel<br />
measurements in two distinct water-bearing intervals.
52 <strong>Ground</strong>-<strong>Water</strong> <strong>Hydrology</strong> <strong>of</strong> <strong>the</strong> <strong>Upper</strong> <strong>Klamath</strong> <strong>Basin</strong>, <strong>Oregon</strong> <strong>and</strong> California<br />
18<br />
19<br />
20<br />
DEPTH TO WATER, IN FEET<br />
21<br />
22<br />
23<br />
24<br />
25<br />
J A J O J A J S J A J O J A J S J A J O J A J O J A J O<br />
1999 2000 2001 2002 2003 2004 2005<br />
Figure 25.<br />
<strong>Water</strong>-level fluctuations in well 35S/12E-26DCD north <strong>of</strong> Beatty, <strong>Oregon</strong>.<br />
145<br />
150<br />
155<br />
DEPTH TO WATER, IN FEET<br />
160<br />
165<br />
170<br />
175<br />
180<br />
J M M J S N J M M J S N J M M J S N J M M J S N J M M J S N J M M J S N<br />
2000 2001 2002 2003 2004 2005<br />
Figure 26.<br />
<strong>Water</strong>-level fluctuations in well 40S/12E-32CDB northwest <strong>of</strong> Malin, <strong>Oregon</strong>.<br />
OR19-0048_fig25
<strong>Ground</strong>-<strong>Water</strong> <strong>Hydrology</strong> 53<br />
35<br />
37<br />
Depth to water in well 40S/9E-28ADB01<br />
Discharge in North Canal<br />
40<br />
35<br />
DEPTH TO WATER, IN FEET<br />
39<br />
41<br />
43<br />
45<br />
30<br />
25<br />
20<br />
15<br />
10<br />
DISCHARGE, IN THOUSANDS OF ACRE FEET<br />
47<br />
5<br />
49<br />
J M M J S N J M M J S N J M M J S N J M M J S N J M M J S N J M M J S N 0<br />
2000 2001 2002 2003 2004 2005<br />
Figure 27. <strong>Water</strong>-level fluctuations in well 40S/09E-28ADB on <strong>the</strong> southwest side <strong>of</strong> <strong>the</strong> <strong>Klamath</strong> Hills, <strong>Oregon</strong>, <strong>and</strong><br />
monthly discharge in <strong>the</strong> nearby North Canal.<br />
The upper interval, which responds primarily to <strong>the</strong> canal<br />
operation, is open from 92 to 516 ft below l<strong>and</strong> surface. The<br />
main water-bearing zone is in pyroclastic material between<br />
305 <strong>and</strong> 360 ft below l<strong>and</strong> surface, <strong>and</strong> is overlain by lava<br />
flows. The water level in <strong>the</strong> upper interval <strong>of</strong> this well<br />
responds in a matter <strong>of</strong> days to <strong>the</strong> operation <strong>of</strong> <strong>the</strong> Langell<br />
Valley Irrigation District canal system (fig. 28). The water<br />
level starts to rise shortly after <strong>the</strong> canals start flowing,<br />
peaking late in <strong>the</strong> irrigation season, <strong>and</strong> dropping soon after<br />
canals are shut <strong>of</strong>f for <strong>the</strong> season. The rapid response <strong>of</strong> <strong>the</strong><br />
water table to canal leakage at such depth likely is due to rapid<br />
downward movement <strong>of</strong> water through interconnected vertical<br />
fractures in <strong>the</strong> lava flows. The lower water-bearing interval in<br />
<strong>the</strong> observation well is open from 950 to 1,005 ft below l<strong>and</strong><br />
surface, <strong>and</strong> is not influenced by canal operation. Both <strong>the</strong><br />
upper <strong>and</strong> lower water-bearing zones in this well respond to<br />
<strong>the</strong> pumping effects <strong>of</strong> nearby wells (fig. 29). Individual wells<br />
can respond to both canal operation <strong>and</strong> pumping.<br />
Response to Lake Stage<br />
As previously discussed, ground water discharges to<br />
<strong>Upper</strong> <strong>Klamath</strong> Lake. The lake, <strong>the</strong>refore, represents a local<br />
boundary to <strong>the</strong> regional ground-water system. As a result,<br />
water levels in most wells near <strong>the</strong> lake track variations in<br />
lake stage. The water-level in well 35S/06E-10ACC (fig. 30),<br />
drilled on <strong>the</strong> lower nor<strong>the</strong>ast flank <strong>of</strong> Pelican Butte, closely<br />
follows <strong>the</strong> stage in <strong>Upper</strong> <strong>Klamath</strong> Lake. The well, about<br />
OR19-0048_fig27<br />
3,500 ft from <strong>the</strong> shoreline <strong>of</strong> <strong>the</strong> lake, is constructed into<br />
layered lava flows that are saturated below a depth <strong>of</strong> about<br />
470 ft (altitude 4,140). Well 38S/09E-17CBC, located near <strong>the</strong><br />
<strong>Oregon</strong> Institute <strong>of</strong> Technology campus in <strong>Klamath</strong> Falls, also<br />
fluctuates with <strong>the</strong> stage <strong>of</strong> <strong>Upper</strong> <strong>Klamath</strong> Lake (fig. 31). The<br />
well is about 5,200 ft from <strong>the</strong> lake, <strong>and</strong> is constructed into<br />
interbedded sediment <strong>and</strong> lava to a total depth <strong>of</strong> 425 ft.<br />
Long-Term <strong>Water</strong>-Table Fluctuations<br />
<strong>Water</strong> levels in wells in <strong>the</strong> upper <strong>Klamath</strong> <strong>Basin</strong> that<br />
have been monitored for several decades show fluctuations in<br />
response to many <strong>of</strong> <strong>the</strong> stresses just discussed. In addition,<br />
measurements in most <strong>of</strong> <strong>the</strong> wells also reflect decadal scale,<br />
wet-dry climate cycles, with some showing <strong>the</strong> effects <strong>of</strong><br />
multiyear pumping stresses. <strong>Water</strong> level trends observed near<br />
Bly (well 36S/14E-25BCB), Bonanza (well 39S/11E-20AAD),<br />
<strong>and</strong> <strong>the</strong> sou<strong>the</strong>rn Langell Valley (well 41S/14E-08CAA)<br />
exemplify areas where ground-water levels are responding<br />
mostly to variations in recharge (climate) (fig. 32), showing<br />
decadal scale fluctuations <strong>of</strong> 4–5 ft.<br />
The ground-water flow system appears to be responding<br />
to prolonged pumping stresses in several o<strong>the</strong>r areas in<br />
<strong>the</strong> upper <strong>Klamath</strong> <strong>Basin</strong>, including <strong>the</strong> area between <strong>the</strong><br />
communities <strong>of</strong> Sprague River <strong>and</strong> Beatty, parts <strong>of</strong> Butte<br />
Valley, south Poe Valley <strong>and</strong> <strong>the</strong> area <strong>of</strong> <strong>the</strong> Shasta View<br />
Irrigation District just north <strong>of</strong> Malin, parts <strong>of</strong> west Langell<br />
Valley, an area east <strong>of</strong> Lorella, <strong>and</strong> <strong>the</strong> <strong>Klamath</strong> Valley.
54 <strong>Ground</strong>-<strong>Water</strong> <strong>Hydrology</strong> <strong>of</strong> <strong>the</strong> <strong>Upper</strong> <strong>Klamath</strong> <strong>Basin</strong>, <strong>Oregon</strong> <strong>and</strong> California<br />
25<br />
30<br />
Canal system <strong>of</strong>f<br />
35<br />
DEPTH TO WATER, IN FEET<br />
40<br />
45<br />
50<br />
Canal system on<br />
55<br />
Deep open interval<br />
Shallow open interval<br />
60<br />
J M M J S N J M M J S N J M M J S N J M M J S N J M M J S N J M M J S N<br />
2000 2001 2002 2003 2004 2005<br />
Figure 28. <strong>Water</strong>-level fluctuations in shallow <strong>and</strong> deep water-bearing zones in double-completion well 39S/12E-<br />
35ABB near Lorella, <strong>Oregon</strong>.<br />
25<br />
51<br />
DEPTH TO WATER, SHALLOW INTERVAL, IN FEET<br />
30<br />
35<br />
40<br />
45<br />
Shallow open interval<br />
52<br />
53<br />
54<br />
55<br />
DEPTH TO WATER, DEEP INTERVAL, IN FEET<br />
Deep open interval<br />
50<br />
APRIL MAY JUNE<br />
2002<br />
JULY AUGUST SEPTEMBER<br />
56<br />
Figure 29. <strong>Water</strong>-level fluctuations in shallow <strong>and</strong> deep water-bearing zones in double-completion well 39S/12E-<br />
35ABB near Lorella, <strong>Oregon</strong>, with time scale exp<strong>and</strong>ed to show effects <strong>of</strong> nearby ground-water pumping.<br />
OR19-0048_fig28
<strong>Ground</strong>-<strong>Water</strong> <strong>Hydrology</strong> 55<br />
4144<br />
4143<br />
ELEVATION, IN FEET ABOVE NGVD29<br />
4142<br />
4141<br />
4140<br />
4139<br />
4138<br />
4137<br />
Stage <strong>of</strong> <strong>Upper</strong> <strong>Klamath</strong> Lake (USGS gage 11507001)<br />
<strong>Water</strong> level elevation in well 35S/06E-10ACC<br />
4136<br />
J A J O J A J S J A J O J A J S J A J O J A J O J A J O<br />
1999 2000 2001 2002 2003 2004 2005<br />
Figure 30.<br />
<strong>Oregon</strong>.<br />
<strong>Water</strong>-level fluctuations in well 35S/06E-10ACC near Pelican Butte <strong>and</strong> stage in <strong>Upper</strong> <strong>Klamath</strong> Lake,<br />
4153<br />
4143<br />
WATER-LEVEL ELEVATION IN WELL, IN FEET ABOVE NGVD29<br />
4152<br />
4151<br />
4150<br />
4149<br />
4148<br />
4147<br />
<strong>Water</strong> level in well 38S/09E-17CBC<br />
Stage <strong>of</strong> <strong>Upper</strong> <strong>Klamath</strong> Lake (USGS gage 11507001)<br />
4146<br />
J M M J S N J M M J S N J M M J S N J M M J S N J M M J S N J M M J S N<br />
2000 2001 2002 2003 2004 2005<br />
Figure 31. <strong>Water</strong>-level fluctuations in well 38S/09E-17CBC in <strong>the</strong> north part <strong>of</strong> <strong>Klamath</strong> Falls <strong>and</strong> stage in <strong>Upper</strong><br />
<strong>Klamath</strong> Lake, <strong>Oregon</strong>.<br />
4142<br />
4141<br />
4140<br />
4139<br />
4138<br />
4137<br />
4136<br />
LAKE-STAGE ELEVATION, IN FEET<br />
OR19-0048_fig30
56 <strong>Ground</strong>-<strong>Water</strong> <strong>Hydrology</strong> <strong>of</strong> <strong>the</strong> <strong>Upper</strong> <strong>Klamath</strong> <strong>Basin</strong>, <strong>Oregon</strong> <strong>and</strong> California<br />
0<br />
2<br />
36S/14E-25BCB<br />
4<br />
6<br />
8<br />
10<br />
12<br />
14<br />
16<br />
18<br />
20<br />
DEPTH TO WATER, IN FEET<br />
60<br />
62<br />
64<br />
66<br />
68<br />
70<br />
72<br />
39S/11E-20AAD<br />
74<br />
10<br />
12<br />
41S/14E-08CCA<br />
14<br />
16<br />
18<br />
20<br />
22<br />
24<br />
1955<br />
1960<br />
1965<br />
1970<br />
1975<br />
1980<br />
1985<br />
1990<br />
1995<br />
2000<br />
2005<br />
26<br />
28<br />
30<br />
Figure 32. <strong>Water</strong>-level fluctuations in wells 36S/14E-25BCB near Bly, 39S/11E-20AAD near Bonanza, <strong>and</strong> 41S/14E-<br />
08CCA in <strong>the</strong> sou<strong>the</strong>rn Langell Valley, <strong>Oregon</strong>.<br />
OR19-0048_fig32
<strong>Ground</strong>-<strong>Water</strong> <strong>Hydrology</strong> 57<br />
<strong>Water</strong> levels in two observation wells near <strong>the</strong> town<br />
<strong>of</strong> Sprague River, 36S/10E-14ACC <strong>and</strong> 36S/11E-20DCA<br />
(fig. 33), have declined over 30 ft since monitoring began<br />
in <strong>the</strong> early 1960s. Leonard <strong>and</strong> Harris (1974) hypo<strong>the</strong>sized<br />
that <strong>the</strong> relatively steady, <strong>and</strong> somewhat localized, longterm<br />
decline represented a loss <strong>of</strong> hydraulic head caused<br />
by discharge from free-flowing wells. The OWRD later<br />
attributed <strong>the</strong> decline, at least in part, to some wells in <strong>the</strong><br />
area constructed in a manner that allowed ground water<br />
from a <strong>the</strong> confined basalt aquifer in <strong>the</strong> lower parts <strong>of</strong> <strong>the</strong><br />
wells to flow uphole <strong>and</strong> into sedimentary units (with lower<br />
head) in shallower parts <strong>of</strong> <strong>the</strong> well bores (<strong>Oregon</strong> <strong>Water</strong><br />
Resources Department, 1987). Borehole geophysical logging<br />
has confirmed <strong>the</strong> interaquifer leakage; however <strong>the</strong> geologic<br />
units receiving <strong>the</strong> leakage appear to be rhyolitic lavas mapped<br />
in <strong>the</strong> area by Sherrod <strong>and</strong> Pickthorn (1992) (Mark Norton,<br />
<strong>Oregon</strong> <strong>Water</strong> Resources Department, unpub. data). For<br />
example, geophysical logs for one nearby well show uphole<br />
interaquifer flow <strong>of</strong> about 200 gal/min into a unit with a<br />
relatively high natural gamma signature indicative <strong>of</strong> silicic<br />
material. The driller described <strong>the</strong> material as “broken lava<br />
rock.” <strong>Water</strong> levels in both wells have been more stable since<br />
<strong>the</strong> mid-1990s (fig. 33), likely owing to <strong>the</strong> ground-water-flow<br />
system beginning to reach a new equilibrium.<br />
<strong>Water</strong> levels in long-term observation well 46N/01E-<br />
06N01 in Butte Valley were stable from <strong>the</strong> 1950s to <strong>the</strong> mid-<br />
1970s (fig. 34). Since 1975, <strong>the</strong> water level has declined about<br />
20 ft. The trend likely reflects increased pumping stresses<br />
during times when precipitation is low, with intermittent times<br />
<strong>of</strong> partial recovery during wet years in <strong>the</strong> mid-1980s <strong>and</strong> mid-<br />
1990s.<br />
An observation well in sou<strong>the</strong>rn Poe Valley (40S/11E-<br />
11BAD) shows a series <strong>of</strong> responses to development from<br />
which it has never fully recovered (fig. 35). Most notable is<br />
<strong>the</strong> water-level decline <strong>of</strong> about 20 ft between 1985 <strong>and</strong> 1995,<br />
a recovery <strong>of</strong> less than 5 ft between 1995 <strong>and</strong> 1998, <strong>and</strong> a<br />
decline <strong>of</strong> about 12 ft since 1998. Ano<strong>the</strong>r observation well<br />
(40S/12E-30DCB) about 3 mi south-sou<strong>the</strong>ast <strong>of</strong> <strong>the</strong> Poe<br />
Valley well, in <strong>the</strong> area <strong>of</strong> <strong>the</strong> Shasta View Irrigation District,<br />
has a similar water-level trend where <strong>the</strong> records overlap from<br />
1994 to present (fig. 35). The total decline in well 40S/12E-<br />
30DCB since 1998, however, is slightly greater at about 19 ft.<br />
The similarity <strong>of</strong> <strong>the</strong> head fluctuations suggests that <strong>the</strong> effects<br />
<strong>of</strong> pumping stresses in both areas may migrate across <strong>the</strong><br />
subbasin boundary.<br />
0<br />
10<br />
36S/10E-14ACC<br />
20<br />
30<br />
40<br />
50<br />
DEPTH TO WATER, IN FEET<br />
60<br />
70<br />
80<br />
90<br />
40<br />
50<br />
60<br />
70<br />
80<br />
90<br />
100<br />
1960<br />
36S/11E-20DCA<br />
1965<br />
1970<br />
1975<br />
1980<br />
1985<br />
1990<br />
1995<br />
2000<br />
2005<br />
Figure 33.<br />
<strong>Water</strong>-level fluctuations in wells 36S/10E-14ACC <strong>and</strong> 36S/11E-20DCA in <strong>the</strong> Sprague River Valley, <strong>Oregon</strong>.
58 <strong>Ground</strong>-<strong>Water</strong> <strong>Hydrology</strong> <strong>of</strong> <strong>the</strong> <strong>Upper</strong> <strong>Klamath</strong> <strong>Basin</strong>, <strong>Oregon</strong> <strong>and</strong> California<br />
0<br />
10<br />
46N/01E-06N01<br />
DEPTH TO WATER, IN FEET<br />
20<br />
30<br />
40<br />
50<br />
60<br />
70<br />
1950<br />
1955<br />
1960<br />
1965<br />
1970<br />
1975<br />
1980<br />
1985<br />
1990<br />
1995<br />
2000<br />
2005<br />
Figure 34.<br />
<strong>Water</strong>-level fluctuations in well 46N/01E-06N01 in Butte Valley, California.<br />
0<br />
10<br />
40S/11E-11BAD<br />
20<br />
30<br />
40<br />
50<br />
DEPTH TO WATER, IN FEET<br />
60<br />
70<br />
80<br />
90<br />
100<br />
190<br />
200<br />
40S/12E-30DCB<br />
210<br />
220<br />
230<br />
240<br />
250<br />
1950<br />
1955<br />
1960<br />
1965<br />
1970<br />
1975<br />
1980<br />
1985<br />
1990<br />
1995<br />
2000<br />
2005<br />
Figure 35. <strong>Water</strong>-level fluctuations in wells 40S/11E-11BAD in <strong>the</strong> sou<strong>the</strong>rn Poe Valley <strong>and</strong> well 40S/12E-30DCB north<br />
<strong>of</strong> Malin, <strong>Oregon</strong>.<br />
OR19-0048_fig34
<strong>Ground</strong>-<strong>Water</strong> <strong>Hydrology</strong> 59<br />
Long-term water-level trends in northwest Langell Valley<br />
<strong>and</strong> east <strong>of</strong> Lorella indicate that pumping stresses in those<br />
areas are periodically greater than average (for <strong>the</strong> area),<br />
probably resulting from <strong>the</strong> occasional use <strong>of</strong> supplemental<br />
ground-water rights. The water level in <strong>the</strong> observation well<br />
in northwest Langell Valley (39S/11E-26ABD) apparently<br />
responded to increased pumping during <strong>the</strong> 1970s, again in <strong>the</strong><br />
early 1990s, <strong>and</strong> again starting in 2001 (fig. 36). The groundwater<br />
flow system nearly recovered after each <strong>of</strong> <strong>the</strong> earlier<br />
cycles. In 2005, <strong>the</strong> water level was about 13 ft below <strong>the</strong> level<br />
measured during 1998, <strong>the</strong> most recent wet period. A trend<br />
similar to that observed in <strong>the</strong> Langell Valley well, but with<br />
a smaller amplitude <strong>of</strong> fluctuation, is seen in <strong>the</strong> long-term<br />
record at well 39S/12E-35ADD, just east <strong>of</strong> Lorella (fig. 36).<br />
The 2005 water level in <strong>the</strong> Lorella well was only about 4 ft<br />
below <strong>the</strong> 1998 measurement. Recharge from canal leakage in<br />
<strong>the</strong> area may also be influencing <strong>the</strong> water-level trend in <strong>the</strong><br />
Lorella well (Grondin, 2004).<br />
Recent pumping stresses in <strong>the</strong> <strong>Klamath</strong> Valley area<br />
are reflected in water levels measured in observation well<br />
41S/09E-12AAB (fig. 37). With <strong>the</strong> exception <strong>of</strong> a sharp<br />
decline in 1970, <strong>the</strong> water-level trend in <strong>the</strong> well appears to<br />
have been in dynamic equilibrium until 2001. The increased<br />
pumping stresses combined with drought contributed to a<br />
water-level decline <strong>of</strong> about 12 ft between 2001 <strong>and</strong> 2004.<br />
Fluctuations in Hydraulic Head in Response to<br />
Recent Increases in <strong>Ground</strong>-<strong>Water</strong> Pumping<br />
Prior to 2001, <strong>the</strong> ground-water system in most <strong>of</strong> <strong>the</strong><br />
upper <strong>Klamath</strong> <strong>Basin</strong> was in a state <strong>of</strong> dynamic equilibrium,<br />
under which water levels rose <strong>and</strong> fell in response to climate<br />
cycles <strong>and</strong> seasonal pumping, but generally without chronic<br />
long-term declines. (<strong>Water</strong> levels in some wells near <strong>the</strong> town<br />
<strong>of</strong> Sprague River [fig. 33] are an exception.) Historically,<br />
water levels declined for several years during droughts, but,<br />
with local exceptions, water levels eventually rose to (or<br />
nearly to) predrought levels during subsequent multiyear<br />
wet periods. Wells generally have been drilled deep enough<br />
<strong>and</strong> pumps set low enough to accommodate <strong>the</strong>se historical<br />
water-level fluctuations. Pumping in <strong>the</strong> upper <strong>Klamath</strong> <strong>Basin</strong><br />
increased an estimated 50 percent starting in 2001 in response<br />
to changes in water management <strong>and</strong> a prolonged drought. The<br />
ground-water system has responded to <strong>the</strong> increased pumping<br />
with water levels showing acute, seasonal, <strong>and</strong> long-term<br />
effects.<br />
Acute effects occur close to pumping wells, generally<br />
within hundreds to thous<strong>and</strong>s <strong>of</strong> feet. These effects typically<br />
are <strong>the</strong> result <strong>of</strong> <strong>the</strong> cone <strong>of</strong> depression <strong>of</strong> <strong>the</strong> pumping<br />
well spreading to neighboring wells, resulting in a decline<br />
in <strong>the</strong> static water levels, sometimes referred to as “well<br />
interference.” These effects typically have a rapid onset <strong>and</strong><br />
dissipate relatively soon after pumping ends.<br />
0<br />
10<br />
39S/11E-26ABD<br />
20<br />
30<br />
DEPTH TO WATER, IN FEET<br />
40<br />
50<br />
30<br />
40<br />
50<br />
60<br />
70<br />
80<br />
1950<br />
39S/12E-35ADD<br />
1955<br />
1960<br />
1965<br />
1970<br />
1975<br />
1980<br />
1985<br />
1990<br />
1995<br />
2000<br />
2005<br />
Figure 36.<br />
<strong>Water</strong>-level fluctuations in wells 39S/11E-26ABD <strong>and</strong> 39S/12E-35ADD in <strong>the</strong> western Langell Valley, <strong>Oregon</strong>.
60 <strong>Ground</strong>-<strong>Water</strong> <strong>Hydrology</strong> <strong>of</strong> <strong>the</strong> <strong>Upper</strong> <strong>Klamath</strong> <strong>Basin</strong>, <strong>Oregon</strong> <strong>and</strong> California<br />
DEPTH TO WATER, IN FEET<br />
130<br />
140<br />
150<br />
160<br />
170<br />
180<br />
41S/09E-12AAB<br />
190<br />
1960 1965 1970 1975 1980 1985 1990 1995 2000<br />
2005<br />
Figure 37.<br />
<strong>Water</strong>-level fluctuations in well 41S/09E-12AAB at <strong>the</strong> sou<strong>the</strong>rn end <strong>of</strong> <strong>the</strong> <strong>Klamath</strong> Hills, <strong>Oregon</strong>.<br />
Seasonal effects reflect <strong>the</strong> general lowering <strong>of</strong> <strong>the</strong><br />
water table over a broad area (several square miles to tens <strong>of</strong><br />
square miles) in response to <strong>the</strong> combined seasonal pumping<br />
<strong>of</strong> multiple wells <strong>and</strong>, in some places, seasonal variations in<br />
recharge. These effects typically build up over <strong>the</strong> irrigation<br />
season <strong>and</strong> largely recover over <strong>the</strong> following winter.<br />
Figure 38 shows seasonal water-level declines between spring<br />
<strong>and</strong> fall 2004 caused by increased pumping in <strong>the</strong> basin. <strong>Water</strong><br />
levels declined more than 10 ft over more than 130 mi 2 <strong>and</strong><br />
more than 20 ft over about 20 mi 2 during <strong>the</strong> 2004 irrigation<br />
season. Declines <strong>of</strong> 10–20 ft are apparent in an area extending<br />
from north <strong>of</strong> <strong>the</strong> <strong>Klamath</strong> Hills, through <strong>the</strong> <strong>Klamath</strong> Valley,<br />
into <strong>the</strong> nor<strong>the</strong>rn <strong>and</strong> eastern parts <strong>of</strong> <strong>the</strong> Tulelake subbasin.<br />
Smaller areas in <strong>the</strong> <strong>Klamath</strong> Valley <strong>and</strong> <strong>the</strong> sou<strong>the</strong>astern part<br />
<strong>of</strong> <strong>the</strong> Tulelake subbasin show seasonal water-level declines<br />
exceeding 20 ft in some wells. Seasonal water-level declines<br />
<strong>of</strong> 1–3 ft were measured in most wells distant from pumping<br />
centers. These widespread declines are due to natural seasonal<br />
fluctuation, possibly amplified by dispersed pumping <strong>and</strong><br />
ongoing drought. Although a general decline in water levels<br />
was measured during this period, levels in some wells that<br />
are hydraulically connected to <strong>the</strong> shallow aquifer system in<br />
<strong>the</strong> basin-fill sediments rose between spring <strong>and</strong> fall, ranging<br />
from a fraction <strong>of</strong> a foot to as much as 3 ft. This is an annual<br />
occurrence entirely due to artificial recharge to <strong>the</strong> shallow<br />
system by canal leakage <strong>and</strong> deep percolation <strong>of</strong> irrigation<br />
water.<br />
Long-term pumping effects refer to <strong>the</strong> lowering <strong>of</strong> <strong>the</strong><br />
water table for more than a season, <strong>of</strong>ten years. Long-term<br />
effects can be caused by both climate <strong>and</strong> pumping stresses.<br />
Long-term water level declines typically occur over broad<br />
regions, such as an entire subbasin. Long-term decline<br />
generally is measured by comparing <strong>the</strong> spring high water<br />
levels each year. Such lowering <strong>of</strong> <strong>the</strong> water table has been<br />
observed over most <strong>of</strong> <strong>the</strong> upper <strong>Klamath</strong> <strong>Basin</strong> since about<br />
2000 because <strong>of</strong> ongoing drought. The only exception is in<br />
shallow aquifers in <strong>the</strong> <strong>Klamath</strong> Project area, where water<br />
levels are maintained by recharge from canal leakage <strong>and</strong><br />
deep percolation <strong>of</strong> irrigation water. Long-term declines due<br />
to pumping have occurred locally in addition to this droughtrelated<br />
decline. Distinguishing pumping related declines from<br />
drought related declines in <strong>the</strong> basin is difficult because <strong>of</strong> <strong>the</strong><br />
scarcity <strong>of</strong> data from previous drought cycles. However, near<br />
<strong>the</strong> town <strong>of</strong> Tulelake, where long-term water-level data exist,<br />
<strong>the</strong> rate <strong>of</strong> <strong>the</strong> year-to-year decline observed in <strong>the</strong> present<br />
drought cycle in well 48N/04E-35L02 appears to be about<br />
twice that observed in <strong>the</strong> most recent previous drought, from<br />
<strong>the</strong> late 1980s through mid-1990s (fig. 39).<br />
OR19-0048_fig37
<strong>Ground</strong>-<strong>Water</strong> <strong>Hydrology</strong> 61<br />
122°00' 45' 30' 121°15'<br />
Modoc<br />
Point<br />
Sprague<br />
Sprague<br />
River<br />
River<br />
Beatty<br />
Bly Ridge<br />
42°15'<br />
<strong>Upper</strong><br />
<strong>Klamath</strong><br />
Bly<br />
Mt<br />
Lake<br />
Swan Lake Valley<br />
Yainax<br />
Butte<br />
<strong>Klamath</strong> Falls<br />
Dairy<br />
42°00'<br />
Lake<br />
Ewauna<br />
Keno<br />
Keno<br />
Dam<br />
<strong>Klamath</strong><br />
Strait<br />
Worden<br />
KLAMATH<br />
RIVER<br />
Midl<strong>and</strong><br />
Altamont<br />
Olene<br />
Henley<br />
<strong>Klamath</strong> Hills<br />
<strong>Klamath</strong> Valley<br />
Lost River<br />
Diversion<br />
Channel<br />
Merrill<br />
Lost<br />
Malin<br />
River<br />
Bonanza<br />
Bryant Mountain<br />
Lorella<br />
Miller Cr<br />
Langell<br />
Valley<br />
OREGON<br />
CALIFORNIA<br />
Dorris<br />
Butte<br />
Valley<br />
Lower<br />
<strong>Klamath</strong><br />
Lake<br />
Sheepy Ridge<br />
Lost<br />
River<br />
Tule<br />
Lake<br />
Sump<br />
Tulelake<br />
Clear<br />
Lake<br />
Res<br />
41°45'<br />
EXPLANATION<br />
Area <strong>of</strong> water-level decline—In feet.<br />
Dashed where approximately located.<br />
10–20<br />
More than 20<br />
Measurement site<br />
0 5 10 15 MILES<br />
0 5 10 KILOMETERS<br />
See table <strong>of</strong> contents for mapping sources<br />
Figure 38. <strong>Water</strong>-level decline between spring <strong>and</strong> fall 2004 in <strong>the</strong> <strong>Klamath</strong> Valley <strong>and</strong> Tule Lake areas, upper <strong>Klamath</strong> <strong>Basin</strong>,<br />
<strong>Oregon</strong> <strong>and</strong> California.<br />
OR19-0048_fig38
62 <strong>Ground</strong>-<strong>Water</strong> <strong>Hydrology</strong> <strong>of</strong> <strong>the</strong> <strong>Upper</strong> <strong>Klamath</strong> <strong>Basin</strong>, <strong>Oregon</strong> <strong>and</strong> California<br />
DEPTH TO WATER, IN FEET<br />
0<br />
10<br />
20<br />
30<br />
40<br />
50<br />
48N/04E-35L02<br />
60<br />
1985 1990 1995 2000 2005<br />
Figure 39.<br />
<strong>Water</strong>-level fluctuations in well 48N/04E-35L02 near <strong>the</strong> town <strong>of</strong> Tulelake, California.<br />
The year-to-year water-level declines can be evaluated<br />
by observing <strong>the</strong> changes in water levels between spring 2001<br />
<strong>and</strong> spring 2004 (fig. 40). Although data are sparse in <strong>the</strong><br />
nor<strong>the</strong>rn part <strong>of</strong> <strong>the</strong> area, measurements show that over <strong>the</strong><br />
3-year period, water levels declined more than 10 ft in deep<br />
water-bearing zones (primarily basalt underlying basin-filling<br />
sediments) over more than 135 mi 2 <strong>of</strong> <strong>the</strong> <strong>Klamath</strong> Valley<br />
<strong>and</strong> nor<strong>the</strong>rn Tule Lake subbasin. Declines exceed 15 ft over<br />
an area <strong>of</strong> about 37 mi 2 encompassing <strong>the</strong> State line in <strong>the</strong><br />
Tule Lake subbasin <strong>and</strong> extending southward to <strong>the</strong> town <strong>of</strong><br />
Tulelake <strong>and</strong> northward to Malin. Declines <strong>of</strong> 10–15 ft during<br />
this period are common north <strong>of</strong> Malin. Declines <strong>of</strong> 5 to 10 ft<br />
are common in <strong>the</strong> sou<strong>the</strong>ast part <strong>of</strong> <strong>the</strong> Tule Lake subbasin.<br />
Levels in three wells on <strong>the</strong> Modoc Plateau sou<strong>the</strong>ast <strong>of</strong> <strong>the</strong><br />
Tule Lake subbasin declined 5 to 10 ft (fig. 40). The decline in<br />
this sou<strong>the</strong>rnmost area, where no new pumping has occurred,<br />
is somewhat enigmatic, but may indicate that effects are<br />
propagating sou<strong>the</strong>astward from pumping centers in <strong>the</strong> Tule<br />
Lake subbasin.<br />
If <strong>the</strong> post-2000 pumping rates continue in <strong>the</strong> future, <strong>the</strong><br />
regional ground-water system possibly will eventually achieve<br />
a new state <strong>of</strong> dynamic equilibrium. This will occur when<br />
<strong>the</strong> depression in <strong>the</strong> water table is large enough to redirect<br />
sufficient regional ground-water flow into <strong>the</strong> area to <strong>of</strong>fset<br />
<strong>the</strong> increased pumping. At equilibrium, however, <strong>the</strong> increased<br />
discharge in <strong>the</strong> area <strong>of</strong> pumping must be <strong>of</strong>fset by decreased<br />
discharge elsewhere, likely manifesting itself as a combination<br />
<strong>of</strong> decreased discharge to adjacent basins <strong>and</strong> decreased<br />
discharge to streams, lakes, <strong>and</strong> wetl<strong>and</strong>s.<br />
Certain details are readily apparent from <strong>the</strong> recently<br />
collected data <strong>and</strong> existing knowledge <strong>of</strong> <strong>the</strong> area. <strong>Ground</strong>water<br />
pumping is accompanied by declines in water levels that<br />
occur at a variety <strong>of</strong> temporal <strong>and</strong> spatial scales. The amount<br />
<strong>of</strong> ground water that can be pumped in a period <strong>of</strong> time will<br />
be determined in part by how much drawdown water users<br />
<strong>and</strong> regulatory agencies will tolerate, <strong>and</strong> in part by how<br />
much interference with streams <strong>and</strong> lakes will be considered<br />
acceptable. The drawdown can be easily measured. Where<br />
drawdowns acutely affect individual springs, <strong>the</strong> effects on<br />
discharge may be easy to measure. However, where <strong>the</strong> effects<br />
are to larger streams or lakes <strong>and</strong> represent a small part <strong>of</strong> <strong>the</strong><br />
overall flow, <strong>the</strong>y usually are difficult to discriminate from<br />
o<strong>the</strong>r fluctuations by measurement. Such effects, however, can<br />
be calculated using computer models or analytical methods.<br />
OR19-0048_fig39
<strong>Ground</strong>-<strong>Water</strong> <strong>Hydrology</strong> 63<br />
122°00' 45' 30' 121°15'<br />
Modoc<br />
Point<br />
Sprague<br />
Sprague<br />
River<br />
River<br />
Beatty<br />
Bly Ridge<br />
42°15'<br />
<strong>Upper</strong><br />
<strong>Klamath</strong><br />
Bly<br />
Mt<br />
Lake<br />
Swan Lake Valley<br />
Yainax<br />
Butte<br />
<strong>Klamath</strong> Falls<br />
Dairy<br />
42°00'<br />
Lake<br />
Ewauna<br />
Keno<br />
Keno<br />
Dam<br />
<strong>Klamath</strong><br />
Strait<br />
Worden<br />
KLAMATH<br />
RIVER<br />
Midl<strong>and</strong><br />
Altamont<br />
Olene<br />
Henley<br />
<strong>Klamath</strong> Hills<br />
<strong>Klamath</strong> Valley<br />
Lost River<br />
Diversion<br />
Channel<br />
Merrill<br />
Lost<br />
Malin<br />
River<br />
Bonanza<br />
Bryant Mountain<br />
Lorella<br />
Miller Cr<br />
Langell<br />
Valley<br />
OREGON<br />
CALIFORNIA<br />
Dorris<br />
Butte<br />
Valley<br />
Lower<br />
<strong>Klamath</strong><br />
Lake<br />
Sheepy Ridge<br />
Lost<br />
River<br />
Tule<br />
Lake<br />
Sump<br />
Tulelake<br />
Clear<br />
Lake<br />
Res<br />
41°45'<br />
EXPLANATION<br />
Area <strong>of</strong> water-level decline—In feet.<br />
Dashed where approximately located.<br />
5–10<br />
10–15<br />
More than 15<br />
Measurement site<br />
0 5 10 15 MILES<br />
0 5 10 KILOMETERS<br />
See table <strong>of</strong> contents for mapping sources<br />
Figure 40.<br />
California.<br />
<strong>Water</strong>-level decline between spring 2001 <strong>and</strong> spring 2004 in <strong>the</strong> <strong>Klamath</strong> Valley <strong>and</strong> Tule Lake areas, <strong>Oregon</strong> <strong>and</strong><br />
OR19-0048_fig40
64 <strong>Ground</strong>-<strong>Water</strong> <strong>Hydrology</strong> <strong>of</strong> <strong>the</strong> <strong>Upper</strong> <strong>Klamath</strong> <strong>Basin</strong>, <strong>Oregon</strong> <strong>and</strong> California<br />
Summary <strong>and</strong> Discussion<br />
The dem<strong>and</strong> for water has increased in recent years in <strong>the</strong><br />
upper <strong>Klamath</strong> <strong>Basin</strong> owing to changes in water management<br />
resulting from endangered species issues. Problems associated<br />
with <strong>the</strong> increased dem<strong>and</strong> have been exacerbated by drought.<br />
As a result, interest has increased in <strong>the</strong> use <strong>of</strong> ground water<br />
<strong>and</strong> in underst<strong>and</strong>ing how <strong>the</strong> regional ground-water system<br />
can be utilized to prevent future water shortages. Until<br />
recently, key aspects <strong>of</strong> <strong>the</strong> regional ground-water system<br />
were not well known, <strong>and</strong> information was insufficient to<br />
make informed ground-water-management decisions. This<br />
report describes part <strong>of</strong> <strong>the</strong> results <strong>of</strong> cooperative efforts by<br />
<strong>the</strong> U.S. Geological Survey <strong>and</strong> <strong>the</strong> <strong>Oregon</strong> <strong>Water</strong> Resources<br />
Department to quantitatively characterize <strong>the</strong> regional groundwater<br />
flow system in <strong>the</strong> upper <strong>Klamath</strong> <strong>Basin</strong> to provide<br />
resource managers <strong>and</strong> basin residents <strong>the</strong> information needed<br />
to make sound resource-management decisions.<br />
The 8,000-square-mile upper <strong>Klamath</strong> <strong>Basin</strong> is semiarid,<br />
with most <strong>of</strong> <strong>the</strong> basin interior receiving less than 20 inches<br />
per year <strong>of</strong> precipitation. Upl<strong>and</strong> areas in <strong>the</strong> basin are<br />
mostly forested, <strong>and</strong> broad river valleys <strong>and</strong> lake basins in<br />
<strong>the</strong> basin interior are largely cultivated or in pasture. Irrigated<br />
agriculture covers roughly 500,000 acres in <strong>the</strong> basin. Of<br />
this area, roughly 190,000 acres are within <strong>the</strong> Bureau <strong>of</strong><br />
Reclamation <strong>Klamath</strong> Project (this does not include refuge<br />
l<strong>and</strong>s in <strong>the</strong> Project area). Most water for <strong>the</strong> <strong>Klamath</strong> Project<br />
comes from <strong>Upper</strong> <strong>Klamath</strong> Lake. A smaller amount <strong>of</strong> l<strong>and</strong> in<br />
<strong>the</strong> basin is irrigated using ground water. In 2000, an estimated<br />
59,600 acres were irrigated using ground water.<br />
The upper <strong>Klamath</strong> <strong>Basin</strong> spans parts <strong>of</strong> <strong>the</strong> Cascade<br />
Range <strong>and</strong> <strong>Basin</strong> <strong>and</strong> Range geologic provinces, <strong>and</strong> is<br />
underlain principally by late Tertiary <strong>and</strong> Quaternary volcanic<br />
rocks. The volcanic deposits in <strong>the</strong> basin are generally<br />
permeable <strong>and</strong> host a substantial regional ground-water<br />
system recharged from precipitation in <strong>the</strong> Cascade Range<br />
<strong>and</strong> upl<strong>and</strong>s within <strong>and</strong> on <strong>the</strong> eastern margin <strong>of</strong> <strong>the</strong> basin.<br />
A prominent system <strong>of</strong> north to northwest trending faults<br />
divides <strong>the</strong> interior parts <strong>of</strong> <strong>the</strong> basin into a series <strong>of</strong> sedimentfilled<br />
structural subbasins. <strong>Ground</strong>-water flow is controlled<br />
by topography, distribution <strong>of</strong> recharge, <strong>the</strong> geometry <strong>of</strong> <strong>the</strong><br />
stream system, <strong>and</strong> <strong>the</strong> geology. The regional geology has<br />
been divided into eight hydrogeologic units on <strong>the</strong> basis <strong>of</strong><br />
<strong>the</strong>ir stratigraphic position <strong>and</strong> broad hydraulic characteristics.<br />
These hydrogeologic units are useful in assessing groundwater<br />
potential <strong>of</strong> specific areas.<br />
Precipitation in <strong>the</strong> upper <strong>Klamath</strong> <strong>Basin</strong> totals<br />
about 10 million acre-feet per year. Most <strong>of</strong> this water<br />
returns to <strong>the</strong> atmosphere at or near where it falls through<br />
evapotranspiration. Roughly 2 million acre-feet per year enter<br />
<strong>the</strong> ground-water system. Most <strong>of</strong> <strong>the</strong> water that enters <strong>the</strong><br />
ground-water system discharges elsewhere in <strong>the</strong> basin to<br />
streams, wells, or through evapotranspiration directly from <strong>the</strong><br />
water table in wetl<strong>and</strong>s.<br />
An estimated 1.8 million acre-feet per year <strong>of</strong> groundwater<br />
discharges to streams. Discharge to streams occurs<br />
throughout <strong>the</strong> basin, but prominent areas <strong>of</strong> groundwater<br />
discharge include <strong>the</strong> flanks <strong>of</strong> <strong>the</strong> Cascade Range,<br />
<strong>the</strong> margins <strong>of</strong> <strong>the</strong> Wood River Valley, <strong>the</strong> area near <strong>the</strong><br />
confluence <strong>of</strong> <strong>the</strong> Williamson <strong>and</strong> Sprague Rivers (including<br />
Spring Creek), <strong>the</strong> upper Williamson River near Yamsay<br />
Mountain, Bonanza Springs on <strong>the</strong> Lost River, <strong>and</strong> <strong>Klamath</strong><br />
River Canyon below John C. Boyle Dam. Much <strong>of</strong> <strong>the</strong><br />
ground-water discharge to streams is through major spring<br />
complexes. <strong>Ground</strong> water flows to streams throughout <strong>the</strong><br />
year, supplying substantial water to streams in <strong>the</strong> basin. For<br />
decades, hydrologists have recognized that much <strong>of</strong> <strong>the</strong> water<br />
flowing into <strong>Upper</strong> <strong>Klamath</strong> Lake originates as ground water<br />
that discharges to tributary streams within 12 miles <strong>of</strong> <strong>the</strong> lake,<br />
or directly to <strong>the</strong> lake.<br />
<strong>Ground</strong>-water discharge to streams is not constant, but<br />
varies seasonally <strong>and</strong> from year to year in response to climate<br />
cycles. In most large spring complexes, such as <strong>the</strong> headwaters<br />
<strong>of</strong> Spring Creek or <strong>the</strong> Wood River, discharge variations due<br />
to longer-term, decadal climate cycles are larger than seasonal<br />
variations. Discharge to major spring complexes, such as<br />
those feeding Wood River <strong>and</strong> Spring Creek may vary by a<br />
factor <strong>of</strong> 2. <strong>Basin</strong>wide, climate-driven ground-water discharge<br />
variations exceed 450 cubic feet per second, a rate that equates<br />
to an annual volume <strong>of</strong> 326,000 acre-feet.<br />
<strong>Ground</strong>-water discharge from wells increased gradually<br />
from <strong>the</strong> late 1940s to about 2000, with small increases in<br />
<strong>the</strong> rate <strong>of</strong> growth related to droughts in <strong>the</strong> late 1970s <strong>and</strong><br />
early 1990s. <strong>Ground</strong>-water pumpage for irrigation in 2000<br />
was about 150,000 acre-feet per year. <strong>Ground</strong>-water use<br />
increased markedly in response to water shortages in 2001 <strong>and</strong><br />
subsequent water-banking efforts. As a result, ground-water<br />
pumpage for irrigation in 2004 was about 226,000 acre-feet<br />
per year.<br />
Hydraulic head data from wells <strong>and</strong> springs shows<br />
that ground water flows from principal recharge areas in<br />
<strong>the</strong> Cascade Range <strong>and</strong> upl<strong>and</strong>s in <strong>the</strong> basin interior <strong>and</strong><br />
eastern margins toward discharge areas in <strong>the</strong> lake basins<br />
<strong>and</strong> stream valleys in <strong>the</strong> basin interior. In addition, head<br />
gradients indicate <strong>the</strong> potential for flow between structural<br />
subbasins in a generally north to south direction. <strong>Ground</strong><br />
water in <strong>the</strong> upper <strong>Klamath</strong> <strong>Basin</strong> generally flows toward two<br />
areas <strong>of</strong> low hydraulic head: <strong>the</strong> <strong>Klamath</strong> River Canyon <strong>and</strong><br />
<strong>the</strong> Tule Lake subbasin. <strong>Ground</strong> water that flows toward <strong>the</strong><br />
<strong>Klamath</strong> River Canyon discharges to <strong>the</strong> river between Keno<br />
<strong>and</strong> John C. Boyle Dam. Some ground water that flows into<br />
<strong>the</strong> Tule Lake subbasin discharges <strong>the</strong>re <strong>and</strong> is removed by<br />
evapotranspiration or pumped to <strong>the</strong> Lower <strong>Klamath</strong> Lake<br />
subbasin. Head gradient data indicate that some ground water<br />
also flows southward out <strong>of</strong> <strong>the</strong> Tule Lake subbasin basin<br />
toward <strong>the</strong> Pit River <strong>Basin</strong>. The amount <strong>of</strong> southward flow<br />
presently is not known.
Acknowledgments 65<br />
Hydraulic head in <strong>the</strong> upper <strong>Klamath</strong> <strong>Basin</strong> fluctuates<br />
primarily in response to climate, pumping, canal <strong>and</strong> irrigation<br />
operations, <strong>and</strong> lake stage. <strong>Basin</strong>wide, climate exerts <strong>the</strong><br />
largest influence on water levels. <strong>Water</strong> levels in upl<strong>and</strong> areas<br />
have declined more than 12 feet between 2000 <strong>and</strong> 2006 in<br />
response to drought conditions; however, <strong>the</strong>y are expected<br />
to rise again when wet conditions return. Because climatedriven<br />
fluctuations affect <strong>the</strong> entire basin, <strong>the</strong>y have <strong>the</strong> largest<br />
influence on <strong>the</strong> hydrologic system <strong>and</strong> are responsible for <strong>the</strong><br />
large variations in ground-water discharge to streams.<br />
<strong>Water</strong> level fluctuations in response to pumping are most<br />
commonly seasonal, with <strong>the</strong> water level declining during<br />
<strong>the</strong> irrigation season <strong>and</strong> recovering more or less fully by<br />
<strong>the</strong> following spring. Prior to 2001, year-to-year water-level<br />
declines due to pumping were rare in <strong>the</strong> upper <strong>Klamath</strong><br />
<strong>Basin</strong>. The large localized increase in pumping that began<br />
in 2001 has resulted in year-to-year declines in <strong>the</strong> <strong>Klamath</strong><br />
Valley <strong>and</strong> Tule Lake subbasin. The total decline between<br />
2001 <strong>and</strong> 2004 exceeds 15 feet in parts <strong>of</strong> <strong>the</strong>se areas <strong>and</strong> is<br />
larger than can be attributed to drought alone. These year-toyear<br />
declines have been accompanied by amplified seasonal<br />
declines. How long it will take water levels to recover fully<br />
after wet climate conditions return <strong>and</strong> pumping stress is<br />
reduced is not known. Data clearly show that pumping stresses<br />
can cause measurable head responses over broad parts <strong>of</strong> <strong>the</strong><br />
ground-water system.<br />
Irrigation <strong>and</strong> canal operation also affect water levels,<br />
particularly in shallow aquifers. <strong>Water</strong> levels in <strong>the</strong>se aquifers<br />
rise at <strong>the</strong> beginning <strong>of</strong> <strong>the</strong> irrigation season <strong>and</strong> decline<br />
during <strong>the</strong> <strong>of</strong>f-season. The magnitude <strong>of</strong> this fluctuation is<br />
generally 5 to 10 feet in <strong>the</strong> main part <strong>of</strong> <strong>the</strong> <strong>Klamath</strong> Project.<br />
<strong>Water</strong> levels in wells near <strong>Upper</strong> <strong>Klamath</strong> Lake fluctuate in<br />
concert with lake stage.<br />
This study was intended to develop an underst<strong>and</strong>ing <strong>of</strong><br />
<strong>the</strong> regional ground-water flow system in <strong>the</strong> upper <strong>Klamath</strong><br />
<strong>Basin</strong> to help resource managers <strong>and</strong> basin residents develop<br />
a strategy for managing ground water. Developing a groundwater<br />
management strategy for <strong>the</strong> upper <strong>Klamath</strong> <strong>Basin</strong> will<br />
require consideration <strong>of</strong> general characteristics <strong>of</strong> groundwater<br />
flow <strong>and</strong> characteristics unique to <strong>the</strong> upper <strong>Klamath</strong><br />
<strong>Basin</strong>. Generally, increases in <strong>the</strong> rate <strong>of</strong> pumping from<br />
a ground-water system will eventually be <strong>of</strong>fset by ei<strong>the</strong>r<br />
increased rates <strong>of</strong> recharge or (more likely) diminished rates<br />
<strong>of</strong> discharge. Mechanisms whereby ground-water recharge<br />
is increased by pumping are rare. In some circumstances, <strong>the</strong><br />
lowering <strong>of</strong> hydraulic head caused by pumping could cause<br />
increased leakage from streams to <strong>the</strong> ground-water system.<br />
Conditions where this could occur in <strong>the</strong> upper <strong>Klamath</strong> <strong>Basin</strong><br />
are rare. Pumping ground water near basin boundaries can<br />
cause <strong>the</strong> boundaries to shift, effectively capturing recharge<br />
from adjacent basins. However, only a fraction <strong>of</strong> <strong>the</strong> pumpage<br />
would be made up by flow from adjacent basins given likely<br />
pumping locations. Diminishment <strong>of</strong> discharge is <strong>the</strong> more<br />
likely consequence <strong>of</strong> ground-water extraction. Most <strong>of</strong> <strong>the</strong><br />
decrease would be in ground-water discharge to streams,<br />
although reductions in discharge to phreatophytes (riparian or<br />
wetl<strong>and</strong> vegetation with roots that extend to <strong>the</strong> water table)<br />
<strong>and</strong> in flows <strong>of</strong> ground water moving out <strong>of</strong> <strong>the</strong> basin in <strong>the</strong><br />
subsurface could occur as well.<br />
The timing <strong>and</strong> distribution <strong>of</strong> <strong>the</strong> effects <strong>of</strong> groundwater<br />
use are dictated to a large degree by <strong>the</strong> location <strong>of</strong><br />
pumping. Pumping very near to discharge areas, such as<br />
springs, can diminish <strong>the</strong> flow <strong>of</strong> <strong>the</strong> springs relatively quickly.<br />
There have been several instances (with varying amounts <strong>of</strong><br />
documentation) where ground-water pumping has affected<br />
spring discharge in <strong>the</strong> upper <strong>Klamath</strong> <strong>Basin</strong>. Springs affected<br />
by pumping in <strong>the</strong> past include those in Bonanza, elsewhere<br />
in <strong>the</strong> Lost River subbasin, <strong>and</strong> near Whisky Creek in <strong>the</strong><br />
Sprague River subbasin.<br />
<strong>Ground</strong> water is a major component <strong>of</strong> streamflow in<br />
<strong>the</strong> upper <strong>Klamath</strong> <strong>Basin</strong>, <strong>and</strong>, consequently, ground-water<br />
development has <strong>the</strong> potential to affect streamflow. Because<br />
<strong>the</strong> rate, spatial distribution, <strong>and</strong> variability <strong>of</strong> ground-water<br />
discharge in <strong>the</strong> upper <strong>Klamath</strong> <strong>Basin</strong> is now well understood,<br />
ground-water management strategies can be developed that<br />
minimize <strong>the</strong> effects <strong>of</strong> ground-water use.<br />
Recently, a considerable effort has been made by various<br />
agencies, including <strong>the</strong> U.S. Geological Survey, <strong>the</strong> <strong>Oregon</strong><br />
<strong>Water</strong> Resources Department, <strong>the</strong> California Department <strong>of</strong><br />
<strong>Water</strong> Resources, <strong>and</strong> <strong>the</strong> Bureau <strong>of</strong> Reclamation, to monitor<br />
ground-water levels <strong>and</strong> ground-water discharge in <strong>the</strong><br />
upper <strong>Klamath</strong> <strong>Basin</strong>. This information has been valuable in<br />
developing <strong>the</strong> present underst<strong>and</strong>ing <strong>of</strong> <strong>the</strong> regional groundwater<br />
system <strong>and</strong> its response to natural <strong>and</strong> human-caused<br />
stresses. Continued data collection will be important in <strong>the</strong><br />
future to quantify <strong>the</strong> response <strong>of</strong> <strong>the</strong> ground-water system to<br />
stresses.<br />
Acknowledgments<br />
The authors gratefully acknowledge <strong>the</strong> support <strong>of</strong> <strong>the</strong><br />
residents <strong>of</strong> <strong>the</strong> upper <strong>Klamath</strong> <strong>Basin</strong>, particularly <strong>the</strong> many<br />
hundreds <strong>of</strong> individuals who allowed access to property <strong>and</strong><br />
wells for water-level measurements <strong>and</strong> monitoring over <strong>the</strong><br />
course <strong>of</strong> several years. Our underst<strong>and</strong>ing <strong>of</strong> <strong>the</strong> groundwater<br />
hydrology <strong>of</strong> <strong>the</strong> upper <strong>Klamath</strong> <strong>Basin</strong> benefited<br />
tremendously from many hours <strong>of</strong> discussions with l<strong>and</strong><br />
owners <strong>and</strong> scientists working in <strong>the</strong> basin, who freely shared<br />
observations, insights, <strong>and</strong> valuable data. Particular thanks go<br />
to Noel Eaves <strong>and</strong> Bill Ehorn <strong>of</strong> <strong>the</strong> California Department <strong>of</strong><br />
<strong>Water</strong> Resources; Jon Hicks, John Rasmussen, <strong>and</strong> Tom Perry<br />
<strong>of</strong> <strong>the</strong> Bureau <strong>of</strong> Reclamation; Jerry Grondin <strong>and</strong> Ned Gates<br />
<strong>of</strong> <strong>the</strong> <strong>Oregon</strong> <strong>Water</strong> Resources Department; Tim Mayer <strong>of</strong><br />
<strong>the</strong> U.S. Fish <strong>and</strong> Wildlife Service; Mike Stansbury <strong>of</strong> <strong>Water</strong><br />
<strong>and</strong> Energy Services (WESCORP); Steve Luxton <strong>of</strong> W&H<br />
Pacific; Toni Boyd <strong>and</strong> John Lund <strong>of</strong> <strong>the</strong> <strong>Oregon</strong> Institute <strong>of</strong><br />
Technology Geo-Heat Center; <strong>and</strong> <strong>the</strong> staffs <strong>of</strong> <strong>the</strong> <strong>Klamath</strong><br />
National Wildlife Refuges Complex <strong>and</strong> Lava Beds National<br />
Monument. Our underst<strong>and</strong>ing <strong>of</strong> <strong>the</strong> geology <strong>of</strong> <strong>the</strong> region
66 <strong>Ground</strong>-<strong>Water</strong> <strong>Hydrology</strong> <strong>of</strong> <strong>the</strong> <strong>Upper</strong> <strong>Klamath</strong> <strong>Basin</strong>, <strong>Oregon</strong> <strong>and</strong> California<br />
benefited from discussions with Mike Cummings <strong>of</strong> Portl<strong>and</strong><br />
State University, Frank Hladky, Margi Jenks, <strong>and</strong> Ian Madin<br />
<strong>of</strong> <strong>the</strong> <strong>Oregon</strong> Department <strong>of</strong> Geology <strong>and</strong> Mineral Industries,<br />
<strong>and</strong> Dave Sherrod <strong>of</strong> <strong>the</strong> U.S. Geological Survey. Part <strong>of</strong> <strong>the</strong><br />
<strong>Oregon</strong> <strong>Water</strong> Resources Department contribution to this<br />
project was funded through grant assistance from <strong>the</strong> Bureau<br />
<strong>of</strong> Reclamation <strong>Klamath</strong> <strong>Basin</strong> Area Office.<br />
References Cited<br />
Adam, D.P., Bradbury, J.P., Rieck, H.J., <strong>and</strong> Sarna-Wojcicki,<br />
A.M., 1990, Environmental changes in <strong>the</strong> Tule Lake<br />
basin, Siskiyou <strong>and</strong> Modoc Counties, California, from 3<br />
to 2 million years before present: U.S. Geological Survey<br />
Bulletin 1933, 13 p.<br />
Almy, R. B., 1977, Report on pump test <strong>of</strong> Hill irrigation<br />
well <strong>and</strong> interference with Modoc Billy Springs, <strong>Klamath</strong><br />
County, <strong>Oregon</strong>: <strong>Oregon</strong> <strong>Water</strong> Resources Department<br />
unpublished internal memor<strong>and</strong>um, unpaginated.<br />
Anderson, J.R., Hardy, E.E., Roach, J.T., <strong>and</strong> Witmer, R.E.,<br />
1976. A l<strong>and</strong> use <strong>and</strong> l<strong>and</strong> cover classification system<br />
for use with remote sensor data: U.S. Geological Survey<br />
Pr<strong>of</strong>essional Paper 964, 28 p.<br />
Benson, S.M., Sammel, E.A., Solbau, R.D., <strong>and</strong> Lai, C.H.,<br />
1984a, Interpretation <strong>of</strong> aquifer test data, in Sammel, E.A.<br />
ed., Analysis <strong>and</strong> interpretation <strong>of</strong> data obtained in tests<br />
<strong>of</strong> <strong>the</strong> geo<strong>the</strong>rmal aquifer at <strong>Klamath</strong> Falls, <strong>Oregon</strong>: U.S.<br />
Geological Survey <strong>Water</strong>-Resources Investigations Report<br />
84-4216, p. 5.1-5.55.<br />
Benson, S.M., Janik, C.J., Long, D.C., Solbau, R.D., Lienau,<br />
P.J., Culver, G.G., Sammel, E.A., Swanson, S.R., Hart,<br />
D.N., Yee, Andrew, White, A.F., Stallard, M.L., Brown,<br />
S.P., Wheeler, M.C., Winnett, T.L., Fong, Grace, <strong>and</strong> Eakin,<br />
G.B., 1984b, Data from pumping <strong>and</strong> injection tests <strong>and</strong><br />
chemical sampling in <strong>the</strong> geo<strong>the</strong>rmal aquifer at <strong>Klamath</strong><br />
Falls, <strong>Oregon</strong>: U.S. Geological Survey Open-File Report<br />
84-146, 101 p.<br />
Boyd, T. G., 1996, <strong>Ground</strong>water recharge <strong>of</strong> <strong>the</strong> middle<br />
Deschutes <strong>Basin</strong>, <strong>Oregon</strong>: M.S. Thesis, Portl<strong>and</strong> State<br />
University, 86 p.<br />
Broad, T.M., <strong>and</strong> Collins. C.A., 1996, Estimated water-use <strong>and</strong><br />
general hydrologic conditions for <strong>Oregon</strong>, 1985-1990: U.S.<br />
Geological Survey <strong>Water</strong> Resources Investigations Report<br />
96-4080, 166 p.<br />
Bureau <strong>of</strong> Reclamation, 1954, <strong>Upper</strong> <strong>Klamath</strong> <strong>Basin</strong>, <strong>Oregon</strong>-<br />
California—A comprehensive departmental report on <strong>the</strong><br />
development <strong>of</strong> water <strong>and</strong> related resources: Sacramento,<br />
California, variously paginated, separate appendices.<br />
Bureau <strong>of</strong> Reclamation, 2005, Natural flow <strong>of</strong> <strong>the</strong> upper<br />
<strong>Klamath</strong> River: Bureau <strong>of</strong> Reclamation Technical Service<br />
Center, Denver, Colorado, 77 p. plus attachments.<br />
Burt, Charles, <strong>and</strong> Freeman, Beau, 2003, <strong>Klamath</strong> <strong>Basin</strong><br />
Investigation-Hydrologic assessment <strong>of</strong> <strong>the</strong> <strong>Upper</strong> <strong>Klamath</strong><br />
<strong>Basin</strong>-Issues <strong>and</strong> opportunities-Draft report: San Luis<br />
Obispo, California, California Polytechnic State University,<br />
Irrigation Training <strong>and</strong> Research Center (ITRAC), Prepared<br />
for <strong>the</strong> U.S. Bureau <strong>of</strong> Reclamation, May, 2003, variously<br />
paged.<br />
CH2M-Hill, 1992, <strong>Ground</strong>water development potential for two<br />
proposed Tenaska electrical generating facilities at Malin<br />
<strong>and</strong> Bonanza, <strong>Oregon</strong>: prepared for Tenaska, Inc., May,<br />
1992 Draft, variously paged.<br />
CH2M-Hill, 1994, <strong>Ground</strong>water development potential <strong>and</strong><br />
hydrogeologic assessment for <strong>the</strong> Lorella Pumped Storage<br />
Project <strong>Klamath</strong> County, <strong>Oregon</strong>, CH2M-Hill, Appendix<br />
E.2.(a): prepared for Energy Storage Partners, March, 1994,<br />
variously paged.<br />
CH2M-Hill, 2002, Deep aquifer testing at <strong>the</strong> COB Energy<br />
Facility water supply well-<strong>Water</strong> supply supplemental data<br />
report-Final report: Portl<strong>and</strong>, <strong>Oregon</strong>, prepared for Peoples<br />
Energy Resources, November, 2002, variously paged.<br />
California Department <strong>of</strong> <strong>Water</strong> Resources, 1963, Nor<strong>the</strong>astern<br />
counties ground-water investigation, Volume I-Text: State<br />
<strong>of</strong> California Department <strong>of</strong> <strong>Water</strong> Resources Bulletin 98,<br />
246 p.<br />
California Department <strong>of</strong> <strong>Water</strong> Resources, 1998, Butte Valley<br />
Wildlife Area well interference investigation: California<br />
Department <strong>of</strong> <strong>Water</strong> Resources Nor<strong>the</strong>rn District,<br />
December, 1998, 102 p<br />
California State <strong>Water</strong> Resources Control Board, 1990,<br />
California State <strong>Water</strong> Resources Control Board information<br />
pertaining to water rights in California—1990: Accessed<br />
at http://www.waterrights.ca.gov/forms/app-geninfo.pdf on<br />
3/2/06, 18 p.<br />
Carlson, H.L., <strong>and</strong> Todd, Rodney, 2003, Effects <strong>of</strong> <strong>the</strong> 2001<br />
water allocation decisions on <strong>the</strong> agricultural l<strong>and</strong>scape <strong>and</strong><br />
crop production in <strong>the</strong> <strong>Klamath</strong> Reclamation Project, in<br />
Braunworth, W.S., Jr., Welch, Teresa, <strong>and</strong> Hathaway, Ron,<br />
eds., <strong>Water</strong> allocation in <strong>the</strong> <strong>Klamath</strong> Reclamation Project:<br />
an assessment <strong>of</strong> natural resource, economic, social, <strong>and</strong><br />
institutional issues with a focus on <strong>the</strong> upper <strong>Klamath</strong><br />
<strong>Basin</strong>, <strong>Oregon</strong> State University Extension Service Special<br />
Report 1037, p. 163-167,<br />
Cooper, R.M., 2002, Determining surface water availability<br />
in <strong>Oregon</strong>: <strong>Oregon</strong> <strong>Water</strong> Resources Department Open File<br />
Report SW 02-02, 157 p.
References Cited 67<br />
Cooper, R.M., 2004, Natural Flow estimates for streams in <strong>the</strong><br />
<strong>Klamath</strong> <strong>Basin</strong>: <strong>Oregon</strong> <strong>Water</strong> Resources Department Open-<br />
File Report SW 04-001 23 p. plus appendixes.<br />
Cuenca, R.H., Nuss, J.L., Martinez-Cob, Antonio, Katul, G.G.,<br />
<strong>and</strong> Faci-Gonzalez, J. M., 1992, <strong>Oregon</strong> crop water use <strong>and</strong><br />
irrigation requirements: <strong>Oregon</strong> State University Extension<br />
Miscellaneous 8530, 184 p.<br />
Driscoll, F.G., 1986, <strong>Ground</strong>water <strong>and</strong> wells: Johnson<br />
Division, St. Paul, 1089 p.<br />
Eaves, J.N., Ehorn, William, Lawrence, Seth, <strong>and</strong> Ward,<br />
Michael, 2002, <strong>Upper</strong> <strong>Klamath</strong> <strong>Basin</strong> Tulelake subbasin<br />
hydrogeologic investigation (Draft report): California<br />
Department <strong>of</strong> <strong>Water</strong> Resources, Nor<strong>the</strong>rn District,<br />
variously paginated.<br />
Fetter, C.W., 1980, Applied hydrogeology: Columbus, Ohio,<br />
Charles E. Merrill Publishing Co. 488 p.<br />
Forcella, L.S., 1982, Whisky Creek aquifer test, <strong>Klamath</strong><br />
County, <strong>Oregon</strong>: <strong>Oregon</strong> <strong>Water</strong> Resources Department<br />
unpublished report, 21 p., plus figures <strong>and</strong> tables.<br />
Freeze, R. A., <strong>and</strong> Cherry, J. A., 1979, <strong>Ground</strong>water: Prentice-<br />
Hall, Englewood Cliffs, N.J., 604 p.<br />
Gannett, M.W., Lite, K.E., Jr., Morgan, D.S., <strong>and</strong> Collins,<br />
C.A., 2001, <strong>Ground</strong>-water hydrology <strong>of</strong> <strong>the</strong> <strong>Upper</strong><br />
Deschutes <strong>Basin</strong>, <strong>Oregon</strong>: U.S. Geological Survey <strong>Water</strong>-<br />
Resources Investigations Report 00-4162, 77 p.<br />
Gates, E.B., 2001, <strong>Ground</strong> water hydrology <strong>of</strong> four proposed<br />
project areas in <strong>the</strong> <strong>Klamath</strong> <strong>Basin</strong>, <strong>Oregon</strong>: State <strong>of</strong> <strong>Oregon</strong><br />
<strong>Water</strong> Resources Department <strong>Ground</strong> <strong>Water</strong> Open File<br />
Report 01-01, 56 p. plus appendices, 4 plates, <strong>and</strong> 2 maps.<br />
Gay, T.E., Jr., <strong>and</strong> Aune, Q.A., 1958, Geologic map <strong>of</strong><br />
California, Olaf P. Jenkins edition, Alturas sheet: California<br />
Division <strong>of</strong> Mines <strong>and</strong> Geology, 2 sheets, scale 1:250,000.<br />
Golder Associates, Inc., 2002, <strong>Ground</strong>water development<br />
Lower <strong>Klamath</strong> National Wildlife Refuge: Redmond,<br />
Washington, Golder Associates, Inc., prepared for <strong>Water</strong><br />
<strong>and</strong> Energy Services (WESCORP), Mercer Isl<strong>and</strong>,<br />
Washington, 993-1683-004.002 (0219mk1.doc), February<br />
19, 2002, 20 p. plus tables, figures, <strong>and</strong> appendices.<br />
Grondin, G.H., 2004. <strong>Ground</strong> water in <strong>the</strong> eastern Lost River<br />
sub-basin, Langell, Yonna, Swan Lake, <strong>and</strong> Poe Valleys <strong>of</strong><br />
Sou<strong>the</strong>astern <strong>Klamath</strong> County, <strong>Oregon</strong><br />
Hammond, P.E., 1983, Volcanic formations along <strong>the</strong> <strong>Klamath</strong><br />
River near Copco Lake, Siskiyou County: California<br />
Geology, v. 36. no. 5, p. 99-109.<br />
Heath, R.C., 1983, Basic ground-water hydrology: U.S.<br />
Geological Survey <strong>Water</strong>-Supply Paper 2220, 84 p.<br />
Hubbard, L.E., Herrett, T.A., Kraus, R.L., Ruppert, G.P., <strong>and</strong><br />
Courte, M.L., 1993,<strong>Water</strong> resources data, <strong>Oregon</strong>, water<br />
year 1992: U.S. Geological Survey <strong>Water</strong>-Data Report OR-<br />
92-1, 474 p.<br />
Hubbard, L.E., Herrett, T.A., Kraus, R.L., Ruppert, G.P., <strong>and</strong><br />
Courte, M.L., 1994, <strong>Water</strong> resources data, <strong>Oregon</strong>, water<br />
year 1993: U.S. Geological Survey <strong>Water</strong>-Data Report OR-<br />
93-1, 498 p.<br />
Hubbard, L.H., 1970, <strong>Water</strong> budget <strong>of</strong> <strong>Upper</strong> <strong>Klamath</strong> Lake<br />
southwestern <strong>Oregon</strong>: U.S Geological Survey Hydrologic<br />
Investigations Atlas HA-351.<br />
King, L.D., Hellickson, M.L., Schmisseur, W.E., <strong>and</strong> Shearer,<br />
M.N., 1978, Projected energy <strong>and</strong> water consumption <strong>of</strong><br />
Pacific Northwest irrigation systems: Corvallis, <strong>Oregon</strong>,<br />
Prepared by <strong>Oregon</strong> State University for U.S. Department<br />
<strong>of</strong> Energy through Battelle Pacific Northwest Laboratories,<br />
PNL-RAP-33, 112 p.<br />
Konrad, C.P., Drost, B.W., <strong>and</strong> Wagner, R.J., 2003,<br />
Hydrogeology <strong>of</strong> <strong>the</strong> unconsolidated sediments, water<br />
quality, <strong>and</strong> ground-water/surface-water exchanges in <strong>the</strong><br />
Methow River <strong>Basin</strong>, Okanogan County, Washington: U.S.<br />
Geological Survey <strong>Water</strong>-Resources Investigations Report<br />
03-4244, 137 p.<br />
La Marche, J.L., 2001, <strong>Water</strong> imports <strong>and</strong> exports between<br />
<strong>the</strong> Rogue <strong>and</strong> upper <strong>Klamath</strong> <strong>Basin</strong>s: Unpublished report<br />
prepared for <strong>the</strong> <strong>Klamath</strong> Alternative Dispute Resolution<br />
<strong>Hydrology</strong> Steering Committee, 7 p.<br />
La Marche, 2002, Big Springs hydrologic field study:<br />
<strong>Oregon</strong> <strong>Water</strong> Resources Department unpublished report,<br />
September 2, 2002, 21 p.<br />
La Rue, E.C., 1922, <strong>Klamath</strong> River <strong>and</strong> its utilization: Report<br />
to <strong>the</strong> Office <strong>of</strong> <strong>the</strong> State Engineer, Salem, <strong>Oregon</strong>, 204 p.<br />
Leonard, A.R., <strong>and</strong> Harris, A.B., 1974, <strong>Ground</strong> water in<br />
selected areas in <strong>the</strong> <strong>Klamath</strong> <strong>Basin</strong>, <strong>Oregon</strong>: <strong>Oregon</strong> State<br />
Engineer <strong>Ground</strong> <strong>Water</strong> Report No. 21, 104 p.<br />
Loy, W.G., Allan, Stuart, Buckley, Aileen, <strong>and</strong> Meacham, Jim,<br />
2001, Atlas <strong>of</strong> <strong>Oregon</strong>: University <strong>of</strong> <strong>Oregon</strong> Press, Eugene,<br />
320 p.<br />
MacLeod, N.L., <strong>and</strong> Sherrod, D.R., 1992, Reconnaissance<br />
geologic map <strong>of</strong> <strong>the</strong> west half <strong>of</strong> <strong>the</strong> Crescent 1° by 2°<br />
quadrangle, central <strong>Oregon</strong>, U.S. Geological Survey<br />
Miscellaneous Investigations Series Map I-2215.<br />
Meinzer, O.E., 1927, Large springs in <strong>the</strong> United States: U.S.<br />
Geological Survey <strong>Water</strong>-Supply Paper 557, 94 p.<br />
Mertzman, S.A., Jr., 2000, K-Ar results from <strong>the</strong> sou<strong>the</strong>rn<br />
<strong>Oregon</strong>-nor<strong>the</strong>rn California Cascade Range: <strong>Oregon</strong><br />
Geology, v. 62, no. 4, p. 99-122.
68 <strong>Ground</strong>-<strong>Water</strong> <strong>Hydrology</strong> <strong>of</strong> <strong>the</strong> <strong>Upper</strong> <strong>Klamath</strong> <strong>Basin</strong>, <strong>Oregon</strong> <strong>and</strong> California<br />
Moench, A.F., 1984, Double-porosity models for a fissured<br />
groundwater reservoir with fracture skin: <strong>Water</strong> Resources<br />
Research, v. 20, n. 7, p. 831-846.<br />
National Marine Fisheries Service, 2002, Biological opinion—<br />
<strong>Klamath</strong> project operations: http://swr.nmfs.noaa.gov/psd/<br />
klamath/KpopBO2002finalMay31.PDF, accessed January<br />
5, 2007.<br />
Natural Resources Conservation Service, 2004, Summary<br />
<strong>of</strong> <strong>the</strong> upper <strong>Klamath</strong> <strong>Basin</strong> rapid subbasin assessment <strong>of</strong><br />
private l<strong>and</strong>s: U.S. Department <strong>of</strong> Agriculture, Natural<br />
Resources Conservation Service, variously paginated.<br />
Newcomb, R.C., <strong>and</strong> Hart, D.H., 1958, Preliminary report<br />
on <strong>the</strong> ground water resources <strong>of</strong> <strong>the</strong> <strong>Klamath</strong> River<br />
<strong>Basin</strong>, <strong>Oregon</strong>: U.S. Geological Survey Open-File Report<br />
[unnumbered], 248 p.<br />
Northwest Geophysical Associates, Inc., 2002, Gravity survey<br />
groundwater investigation Lower <strong>Klamath</strong> Lake <strong>Basin</strong><br />
<strong>Klamath</strong> County, <strong>Oregon</strong>: Corvallis, <strong>Oregon</strong>, Northwest<br />
Geophysical Associates, Inc., prepared for <strong>Klamath</strong><br />
Drainage District, May, 2002, 13 p. plus 11 sheets.<br />
<strong>Oregon</strong> Blue Book: http://bluebook.state.or.us/, accessed<br />
February 27, 2006<br />
<strong>Oregon</strong> State University PRISM Group, 2006, PRISM Group<br />
data website: www.ocs.oregonstate.edu/prism, accessed<br />
9/2006.<br />
<strong>Oregon</strong> <strong>Water</strong> Resources Department, 1987, Information<br />
Report—Well reconstruction in <strong>the</strong> Whisky Creek area,<br />
near Sprague River: Memor<strong>and</strong>um from <strong>the</strong> Director to <strong>the</strong><br />
<strong>Water</strong> Resources Commission regarding Agenda Item L,<br />
June 5, 1987 <strong>Water</strong> Resources Commission Meeting, 6 p.<br />
Orr, E.L., Orr, W.N., <strong>and</strong> Baldwin, E.M., 1992, Geology <strong>of</strong><br />
<strong>Oregon</strong>: Kendall/Hunt Publishing Co., 254 p.<br />
Palmer, P.C., Gannett, M.W., <strong>and</strong> Hinkle, S.R., 2007, Isotopic<br />
characterization <strong>of</strong> three groundwater recharge sources <strong>and</strong><br />
inferences for selected aquifers in <strong>the</strong> upper <strong>Klamath</strong> <strong>Basin</strong><br />
<strong>of</strong> <strong>Oregon</strong> <strong>and</strong> California, USA: Journal <strong>of</strong> <strong>Hydrology</strong>, v.<br />
336, p. 17-29.<br />
Priestly, C.H.B., <strong>and</strong> Taylor, R.B., 1972, On <strong>the</strong> assessment<br />
<strong>of</strong> surface heat flux <strong>and</strong> evaporation using large-scale<br />
parameters: Monthly Wea<strong>the</strong>r Review, v. 100, p. 81-92.<br />
Risley, J.C., <strong>and</strong> Gannett, M.W., 2006, An evaluation <strong>and</strong><br />
review <strong>of</strong> water-use estimates <strong>and</strong> flow data for <strong>the</strong> Lower<br />
<strong>Klamath</strong> <strong>and</strong> Tule Lake National Wildlife Refuges,<br />
<strong>Oregon</strong> <strong>and</strong> California: U.S. Geological Survey Scientific<br />
Investigations Report 2006-5036, 18.<br />
Risley, J.C., Gannett, M.W., Lea, J.K., <strong>and</strong> Roehl, E.A., Jr.,<br />
2005, An analysis <strong>of</strong> statistical methods for seasonal flow<br />
forecasting in <strong>the</strong> upper <strong>Klamath</strong> <strong>Basin</strong> <strong>of</strong> <strong>Oregon</strong> <strong>and</strong><br />
California: U.S. Geological Survey Scientific Investigations<br />
Report 2005-5177, 44 p.<br />
Russell, R.J., 1928, <strong>Basin</strong> range structure <strong>and</strong> stratigraphy<br />
<strong>of</strong> <strong>the</strong> Warner Range, nor<strong>the</strong>astern California: University<br />
<strong>of</strong> California, Bulletin <strong>of</strong> <strong>the</strong> Department <strong>of</strong> Geological<br />
Sciences, v. 17, n. 11, p. 387-496.<br />
Sammel, E.A., <strong>and</strong> Peterson, D.L., 1976, Hydrologic<br />
reconnaissance <strong>of</strong> <strong>the</strong> geo<strong>the</strong>rmal area near <strong>Klamath</strong> Falls,<br />
<strong>Oregon</strong>, with a section on Preliminary interpretation <strong>of</strong><br />
geophysical data: U.S. Geological Survey <strong>Water</strong>-Resources<br />
Investigations Report 76-127, 137 p.<br />
Sherrod, D.R., 1991, Geologic map <strong>of</strong> a part <strong>of</strong> <strong>the</strong> Cascade<br />
Range between latitudes 43°-44°, central, <strong>Oregon</strong>: U.S.<br />
Geological Survey Map I-1891, 14 p., scale 1:125,000, 1<br />
sheet.<br />
Sherrod, D.R., <strong>and</strong> Pickthorn, L.G., 1992, Geologic map <strong>of</strong> <strong>the</strong><br />
west half <strong>of</strong> <strong>the</strong> <strong>Klamath</strong> Falls 1° by 2° Quadrangle, southcentral<br />
<strong>Oregon</strong>: U.S. Geological Survey Miscellaneous<br />
Investigations Series, Map I-2182, scale 1:250,000, 1 sheet.<br />
Sherrod, D.R., <strong>and</strong> Smith, J.G., 2000, Geologic map <strong>of</strong><br />
upper Eocene to Holocene volcanic <strong>and</strong> related rocks<br />
<strong>of</strong> <strong>the</strong> Cascade Range <strong>Oregon</strong>: U.S. Geological Survey<br />
Miscellaneous Investigations Map I-2569, scale 1:500,000.<br />
Siskiyou County, 2003, Annual report <strong>of</strong> estimated crop <strong>and</strong><br />
livestock production, year ending December 31, 2003:<br />
Siskiyou County Department <strong>of</strong> Agriculture, unpaginated.<br />
Smith, J.G., Page, N.J., Johnson, M.G., Moring, B.C., <strong>and</strong><br />
Gray, Floyd, 1982, Preliminary geologic map <strong>of</strong> <strong>the</strong><br />
Medford 1° by 2° quadrangle, <strong>Oregon</strong> <strong>and</strong> California:<br />
U.S. Geological Survey Open-File Report 82-955, scale<br />
1:250,000, 1 sheet.<br />
Snyder, D.T., <strong>and</strong> Morace, J.L., 1997, Nitrogen <strong>and</strong><br />
phosphorous loading from drained wetl<strong>and</strong>s adjacent<br />
to <strong>Upper</strong> <strong>Klamath</strong> <strong>and</strong> Agency Lakes, <strong>Oregon</strong>: U.S.<br />
Geological Survey <strong>Water</strong>-Resources Investigations Report<br />
97-4059, 67p.<br />
Stonestrom, D.A., Prudic, D.E., Laczniak, R.J., Akstin, K.C.,<br />
Boyd, R.A., <strong>and</strong> Henkelman, K.K., 2003, estimates <strong>of</strong><br />
deep percolation beneath native vegetation, irrigated fields,<br />
<strong>and</strong> <strong>the</strong> Amargosa-River channel, Amargosa Desert, Nye<br />
County, Nevada: U.S. Geological Survey Open File Report<br />
03-14, 83 p.
References Cited 69<br />
Theis, C.V., 1935, The relation between <strong>the</strong> lowering <strong>of</strong><br />
<strong>the</strong> piezometric surface <strong>and</strong> <strong>the</strong> rate <strong>and</strong> duration <strong>of</strong><br />
discharge <strong>of</strong> a well using ground-water storage: American<br />
Geophysical Union Transactions, 16 th Annual Meeting, part<br />
2, p. 518-524.<br />
U.S. Department <strong>of</strong> Agriculture, 2004, Statistics by state—<br />
<strong>Oregon</strong>: http://www.nass.usda.gov/Statistics_by_State/<br />
<strong>Oregon</strong>, accessed January 5, 2007.<br />
U.S. Geological Survey, 1956, Surface water supply <strong>of</strong><br />
<strong>the</strong> United States, 1954, Part 11, Pacific slope basins in<br />
California: U.S. Geological Survey <strong>Water</strong>-Supply Paper<br />
1345, 574 p.<br />
U.S. Geological Survey, 1960a, Surface water supply <strong>of</strong><br />
<strong>the</strong> United States, 1959, Part 11, Pacific slope basins in<br />
California: U.S. Geological Survey <strong>Water</strong>-Supply Paper<br />
1635, 748 p.<br />
U.S. Geological Survey, 1960b, Compilation <strong>of</strong> records <strong>of</strong><br />
surface waters <strong>of</strong> <strong>the</strong> United States through September<br />
1950. Part 11-A, Pacific slope basins in California, except<br />
Central Valley: U.S. Geological Survey <strong>Water</strong>-Supply Paper<br />
1315-B, p. 471-864.<br />
U.S. Geological Survey, [various dates], Surface water supply<br />
<strong>of</strong> <strong>the</strong> United States, Pacific slope basins in California: U.S.<br />
Geological Survey <strong>Water</strong>-Supply Paper, various parts.<br />
Vance, J.A., 1984, The lower Western Cascades Volcanic<br />
Group in nor<strong>the</strong>rn California, in Nilsen, T.H. ed., Geology<br />
<strong>of</strong> <strong>the</strong> <strong>Upper</strong> Cretaceous Hornbrook Formation, <strong>Oregon</strong><br />
<strong>and</strong> California: Society <strong>of</strong> Economic Paleontologists <strong>and</strong><br />
Mineralogists, Pacific Section, Field Trip Guidebook v. 42,<br />
p. 195-196.<br />
Veen, C.A., 1981, Gravity anomalies <strong>and</strong> <strong>the</strong>ir structural<br />
implications for sou<strong>the</strong>rn <strong>Oregon</strong> Cascade Mountains <strong>and</strong><br />
adjoining <strong>Basin</strong> <strong>and</strong> Range province: Corvallis, <strong>Oregon</strong>,<br />
<strong>Oregon</strong> State University, M.S. <strong>the</strong>sis, 86 p.<br />
Wagner, D.L., <strong>and</strong> Saucedo, G.J., compilers, 1987, Geologic<br />
map <strong>of</strong> <strong>the</strong> Weed Quadrangle: California Division <strong>of</strong> Mines<br />
<strong>and</strong> Geology Regional Geologic Map Series Map No. 4A<br />
(Geology), 15 p., scale 1:250,000, 4 sheets.<br />
<strong>Water</strong>shed Sciences, 2002, Aerial survey in <strong>the</strong> <strong>Klamath</strong><br />
<strong>and</strong> Lost River <strong>Basin</strong>s—Thermal infrared <strong>and</strong> color<br />
videography, <strong>Water</strong>shed Sciences, LLC, Corvallis, OR, 29<br />
p., plus appendices.<br />
Weber, Bruce, <strong>and</strong> Sorte, Bruce, 2003, The upper <strong>Klamath</strong><br />
<strong>Basin</strong> economy <strong>and</strong> <strong>the</strong> role <strong>of</strong> agriculture: in Braunworth,<br />
W.S., Jr., Welch, Teresa, <strong>and</strong> Hathaway, Ron, eds. <strong>Water</strong><br />
allocation in <strong>the</strong> <strong>Klamath</strong> Reclamation Project: an<br />
assessment <strong>of</strong> natural resource, economic, social, <strong>and</strong><br />
institutional issues with a focus on <strong>the</strong> upper <strong>Klamath</strong><br />
<strong>Basin</strong>, <strong>Oregon</strong> State University Extension Service Special<br />
Report 1037, p. 213-229.<br />
Weddell, B.J., 2000, Relationship between flows in <strong>the</strong><br />
<strong>Klamath</strong> River <strong>and</strong> Lower <strong>Klamath</strong> Lake prior to 1910:<br />
Report to U.S. Fish <strong>and</strong> Wildlife Service <strong>Klamath</strong> <strong>Basin</strong><br />
Refuges, Tulelake California, 10 p.<br />
Weeks, E.P., 2005, Hydrologic properties <strong>of</strong> coal-beds in <strong>the</strong><br />
powder River <strong>Basin</strong>, Montana. II. Aquifer test analysis:<br />
Journal <strong>of</strong> <strong>Hydrology</strong>, v. 308, p. 242-257.<br />
WESCORP (<strong>and</strong> Golder Associates), 2003, Lower<br />
<strong>Klamath</strong> NWR groundwater program-2002 groundwater<br />
development report-U.S. Fish <strong>and</strong> Wildlife Service: Mercer<br />
Isl<strong>and</strong>, Washington, WESCORP (<strong>Water</strong> <strong>and</strong> Energy<br />
Services Corporation), January, 2003, variously paged.<br />
Western Regional Climate Center, 2006, Historical climate<br />
data: http://www.wrcc.dri.edu, accessed 9/2006.<br />
William E. Nork, Inc., 1992, Analysis <strong>of</strong> pumping tests on<br />
OIT Injection Well No. 2: Prepared for <strong>Oregon</strong> Institute <strong>of</strong><br />
Technology by William E. Nork, Inc., Reno, Report 92-421<br />
[PSC-P 58777], 9 p. plus figures <strong>and</strong> tables.<br />
Wood, P.R., 1960, Geology <strong>and</strong> ground-water features <strong>of</strong> <strong>the</strong><br />
Butte Valley region, Siskiyou County, California: U.S.<br />
Geological Survey <strong>Water</strong>-Supply Paper 1491, 150 p.<br />
Zwart, M.J., <strong>and</strong> Gates, E.B., 2002, Results <strong>of</strong> a long-term<br />
aquifer test at <strong>the</strong> Ron McVay irrigation well, <strong>Klamath</strong><br />
County, <strong>Oregon</strong>: State <strong>of</strong> <strong>Oregon</strong> <strong>Water</strong> Resources<br />
Department <strong>Ground</strong> <strong>Water</strong> Open File Report 02-004, 35 p.<br />
plus 3 appendices.<br />
Walker, G.W., 1963, Reconnaissance geologic map <strong>of</strong> <strong>the</strong><br />
eastern half <strong>of</strong> <strong>the</strong> <strong>Klamath</strong> Falls (AMS) quadrangle, Lake<br />
<strong>and</strong> <strong>Klamath</strong> counties, <strong>Oregon</strong>: U.S. Geological Survey<br />
Mineral Investigations Field Studies Map MF-260, scale<br />
1:250,000, 1 sheet.
70 <strong>Ground</strong>-<strong>Water</strong> <strong>Hydrology</strong> <strong>of</strong> <strong>the</strong> <strong>Upper</strong> <strong>Klamath</strong> <strong>Basin</strong>, <strong>Oregon</strong> <strong>and</strong> California<br />
This page intentionally left blank.
Appendix A. 71<br />
Appendix A. L<strong>and</strong>sat Analysis<br />
Methods<br />
The imagery classification was based on two levels <strong>of</strong><br />
resolution: (1) a generalized nonirrigated level that consisted<br />
<strong>of</strong> four Anderson Level I/II classes: ice <strong>and</strong> snow, evergreen<br />
forest, water, <strong>and</strong> shrub l<strong>and</strong>s that represented a combination<br />
<strong>of</strong> bare soil, rock, sagebrush <strong>and</strong> o<strong>the</strong>r nonirrigated vegetation<br />
(Anderson <strong>and</strong> o<strong>the</strong>rs, 1976); <strong>and</strong> (2) irrigated l<strong>and</strong>s clustered<br />
into five vegetative classes based on <strong>the</strong>ir spectral similarity<br />
<strong>and</strong> potential crop water needs. These classes were labeled<br />
alfalfa <strong>and</strong> irrigated grasses, small grains, onions-garlic,<br />
potatoes-corn, <strong>and</strong> strawberries. Although it would have been<br />
desirable, identification <strong>of</strong> individual crop types proved to be<br />
impossible because <strong>of</strong> <strong>the</strong> lack <strong>of</strong> unique spectral signatures<br />
(Paul Seevers, EROS Data Center, written commun., 2000).<br />
The use <strong>of</strong> three satellite images from different times during<br />
<strong>the</strong> growing season increased <strong>the</strong> probability that certain croptypes<br />
could be distinguished based on <strong>the</strong> development <strong>of</strong> <strong>the</strong>ir<br />
spectral signatures. To aid in <strong>the</strong> classification <strong>of</strong> <strong>the</strong> imagery,<br />
field work was conducted to map directly crop types in areas<br />
totaling about 17,000 acres. A variety <strong>of</strong> representative l<strong>and</strong>cover<br />
types were observed, including native trees, pasture<br />
<strong>and</strong> most <strong>of</strong> <strong>the</strong> agricultural crops. Most data were collected<br />
in mid-July. Data on crop type <strong>and</strong> height, percentage <strong>of</strong> crop<br />
cover, sprinkler type, <strong>and</strong> o<strong>the</strong>r parameters also were collected.<br />
The three images were processed in succession. The May<br />
21, 2000, scene (from L<strong>and</strong>sat 5) showed full canopy cover <strong>of</strong><br />
<strong>the</strong> perennial crops such as alfalfa, irrigated grasses, <strong>and</strong> any<br />
winter wheat that may have been planted <strong>the</strong> previous fall.<br />
The timing <strong>of</strong> <strong>the</strong> scene put it before any annual row crops<br />
had enough growth to show a vegetative signature. Areas<br />
with vigorous growth in <strong>the</strong> May scene served to mask over<br />
<strong>the</strong> same areas in <strong>the</strong> August scene. This step reduced <strong>the</strong><br />
amount <strong>of</strong> data in <strong>the</strong> August scene that required analysis. The<br />
irrigation district boundaries were used to segregate irrigated<br />
areas outside <strong>of</strong> <strong>the</strong> <strong>Klamath</strong> Project. The August 1 scene<br />
(from L<strong>and</strong>sat 7) revealed <strong>the</strong> full canopy <strong>of</strong> <strong>the</strong> annual row<br />
crops planted during <strong>the</strong> spring. The September 18 scene (also<br />
from L<strong>and</strong>sat 7) was used to show any crops that might have a<br />
vigorous vegetative signature beyond <strong>the</strong> harvest dates <strong>of</strong> <strong>the</strong><br />
small grains.<br />
A review was performed on <strong>the</strong> results <strong>of</strong> <strong>the</strong> final l<strong>and</strong>cover<br />
classification by creating an error matrix to evaluate<br />
how well <strong>the</strong> classification <strong>of</strong> <strong>the</strong> imagery matched what was<br />
actually mapped on <strong>the</strong> ground. The review looked at how<br />
accurately <strong>the</strong> classification identified specific crop-types<br />
<strong>and</strong> how accurately <strong>the</strong> classification did with respect to all<br />
irrigated crop-classes. To do this, <strong>the</strong> new l<strong>and</strong>-cover map<br />
created from <strong>the</strong> classified L<strong>and</strong>sat imagery was converted<br />
to a polygon dataset, with each polygon being 30 meters, <strong>the</strong><br />
resolution <strong>of</strong> <strong>the</strong> original imagery. Each polygon contained a<br />
code for crop class determined by <strong>the</strong> classification process.<br />
The ground reference boundaries were <strong>the</strong>n used to clip out<br />
<strong>the</strong> same areas in <strong>the</strong> classified l<strong>and</strong> cover. The clipped l<strong>and</strong>cover<br />
polygons were <strong>the</strong>n evaluated by crop class against <strong>the</strong><br />
ground reference. For example, if a ground reference area<br />
was identified as alfalfa, <strong>the</strong>n <strong>the</strong> same area was compared in<br />
<strong>the</strong> l<strong>and</strong> cover. The results <strong>of</strong> <strong>the</strong> review showed that largeacreage<br />
crops such as alfalfa had a correct classification ratio<br />
<strong>of</strong> about 64 percent. However, if all irrigated crop classes were<br />
included <strong>the</strong>n <strong>the</strong> accuracy <strong>of</strong> identifying irrigated l<strong>and</strong>s within<br />
that area increased to about 73 percent. For crops grown on<br />
smaller fields, <strong>the</strong> accuracy <strong>of</strong> <strong>the</strong> classification to identify<br />
specific crop class decreased to a range <strong>of</strong> 20 to 30 percent. If<br />
all irrigated l<strong>and</strong>s were included <strong>the</strong>n <strong>the</strong> accuracy increased to<br />
<strong>the</strong> 50 to 70 percent range. Sugar beet fields for example, were<br />
correctly classified 34 percent <strong>of</strong> <strong>the</strong> time, but if all irrigated<br />
l<strong>and</strong>s for <strong>the</strong> same area were included <strong>the</strong>n <strong>the</strong> accuracy<br />
increased to 62 percent. All mint <strong>and</strong> strawberry fields were<br />
located during <strong>the</strong> ground truth <strong>and</strong> were included in <strong>the</strong> final<br />
classification.
72 <strong>Ground</strong>-<strong>Water</strong> <strong>Hydrology</strong> <strong>of</strong> <strong>the</strong> <strong>Upper</strong> <strong>Klamath</strong> <strong>Basin</strong>, <strong>Oregon</strong> <strong>and</strong> California<br />
Table 6. Estimated ground-water discharge to principal stream reaches in <strong>the</strong> upper <strong>Klamath</strong> <strong>Basin</strong>, <strong>Oregon</strong> <strong>and</strong> California.<br />
[Reach: River miles in Reach column are from <strong>Oregon</strong> <strong>Water</strong> Resources Department <strong>Klamath</strong> Drainage <strong>Basin</strong> Map, Map No. 14.6, 1971. Confidence level: Confidence levels represent a subjective assessment<br />
<strong>of</strong> <strong>the</strong> interval (plus or minus) that has a 95 percent probability <strong>of</strong> containing <strong>the</strong> true value. Confidence level categories are: 1, 10 percent; 2, 20 percent; 3, 30 percent; 4, 50 percent; 5, data insufficient to assess<br />
uncertainty. Subtotals rounded to two significant figures. Unless o<strong>the</strong>rwise noted, values were derived by taking <strong>the</strong> average <strong>of</strong> estimated discharge in <strong>the</strong> fall (Sept, Oct, Nov). USGS synoptic measurement<br />
data from Leonard <strong>and</strong> Harris (1974). Abbreviations: BOR, Bureau <strong>of</strong> Reclamation; CDWR, California Department <strong>of</strong> <strong>Water</strong> Resources; Cr, Creek; ft 3 /s, cubic feet per second; Hwy, Highway; mi, mile; NA,<br />
not applicable; NPS, National Park Service; OWRD, <strong>Oregon</strong> <strong>Water</strong> Resources Department; R, River; Res, Reservoir; RM, river mile; RR, rail road; USFS, U.S. Forest Service; USGS, U.S. Geological Survey]<br />
Number Stream name Reach<br />
Estimated gain<br />
(+) or loss (-)<br />
(ft 3 /s)<br />
Data source<br />
Period <strong>of</strong><br />
record<br />
Methods Remarks<br />
Confidence<br />
level<br />
1 South Fork<br />
Sprague River<br />
2 Brownsworth<br />
Creek<br />
3 Fritz <strong>and</strong><br />
Deming<br />
Creeks<br />
1 4 South Fork<br />
Sprague<br />
River<br />
Headwaters to above<br />
Brownsworth Cr<br />
(RM 15.2)<br />
14 USFS gage 10/1992-<br />
09/1997<br />
Entire drainage 5 USFS<br />
measurements<br />
(46)<br />
Entire drainage <strong>of</strong> both<br />
creeks<br />
Brownsworth Cr (RM<br />
15.2) to picnic area<br />
(RM 10.2)<br />
Subtotal for South Fork Sprague River 24<br />
12/1991-<br />
04/1997<br />
Index regression to Chewaucan<br />
near Paisley, Oreg. (USGS site<br />
10384000)<br />
Miscellaneous measurement<br />
regression to Chewaucan near<br />
Paisley, Oreg. (USGS site<br />
10384000)<br />
OWRD site 61420208 3<br />
OWRD site 21420206 3<br />
5 N/A N/A Regional regression 5<br />
0 USFS<br />
measurements<br />
(34)<br />
1/1992–<br />
3/1996<br />
Miscellaneous measurement<br />
regression to Chewaucan near<br />
Paisley, Oreg. (USGS site<br />
10384000). Mass balance.<br />
OWRD site 21420201. Gains<br />
calculated from difference<br />
with upstream inflows.<br />
3<br />
5 North Fork<br />
Sprague<br />
River<br />
6 North Fork<br />
Sprague<br />
River<br />
Headwaters to above<br />
S<strong>and</strong>hill Crossing<br />
(RM 23.5)<br />
S<strong>and</strong>hill Crossing to<br />
The Elbow (RM<br />
23.5 to RM 12.2)<br />
7 Meryl Creek Headwaters to<br />
approximately 1.5<br />
mi above mouth<br />
8 Fivemile<br />
Creek<br />
Headwaters to<br />
approximately 4.0<br />
mi above mouth<br />
16 USFS gage 10/1992–<br />
9/1997<br />
43 USFS<br />
measurements<br />
(46)<br />
13 USGS/OWRD<br />
measurements<br />
(5)<br />
20 USGS/OWRD<br />
measurements<br />
(280)<br />
01/1992–<br />
05/1997<br />
09/1915,<br />
09/1954,<br />
10/1970,<br />
09/1983,<br />
11/2000<br />
08/1917–<br />
09/1973<br />
Index regression to Chewaucan<br />
near Paisley, Oreg. (USGS site<br />
10384000)<br />
Miscellaneous measurement<br />
regression to Chewaucan near<br />
Paisley (USGS site 10384000).<br />
Mass balance.<br />
OWRD site 61420206 3<br />
OWRD site 21420202. Gains<br />
calculated from difference<br />
with upstream inflows.<br />
Average Majority <strong>of</strong> measurements<br />
approximately 1.5 mi from<br />
mouth.<br />
Miscellaneous measurement<br />
regression to Williamson R<br />
below Sprague R near Chiloquin,<br />
Oreg. (USGS site 11502500).<br />
Measurements at USGS site<br />
11497000. Used data as<br />
miscellaneous measurement<br />
site due to large amounts <strong>of</strong><br />
missing data.<br />
2<br />
4<br />
1
Table 6 73<br />
Table 6. Estimated ground-water discharge to principal stream reaches in <strong>the</strong> upper <strong>Klamath</strong> <strong>Basin</strong>, <strong>Oregon</strong> <strong>and</strong> California.—Continued<br />
[Reach: River miles in Reach column are from <strong>Oregon</strong> <strong>Water</strong> Resources Department <strong>Klamath</strong> Drainage <strong>Basin</strong> Map, Map No. 14.6, 1971. Confidence level: Confidence levels represent a subjective assessment<br />
<strong>of</strong> <strong>the</strong> interval (plus or minus) that has a 95 percent probability <strong>of</strong> containing <strong>the</strong> true value. Confidence level categories are: 1, 10 percent; 2, 20 percent; 3, 30 percent; 4, 50 percent; 5, data insufficient to assess<br />
uncertainty. Subtotals rounded to two significant figures. Unless o<strong>the</strong>rwise noted, values were derived by taking <strong>the</strong> average <strong>of</strong> estimated discharge in <strong>the</strong> fall (Sept, Oct, Nov). USGS synoptic measurement<br />
data from Leonard <strong>and</strong> Harris (1974). Abbreviations: BOR, Bureau <strong>of</strong> Reclamation; CDWR, California Department <strong>of</strong> <strong>Water</strong> Resources; Cr, Creek; ft 3 /s, cubic feet per second; Hwy, Highway; mi, mile; NA,<br />
not applicable; NPS, National Park Service; OWRD, <strong>Oregon</strong> <strong>Water</strong> Resources Department; R, River; Res, Reservoir; RM, river mile; RR, rail road; USFS, U.S. Forest Service; USGS, U.S. Geological Survey]<br />
Number Stream name Reach<br />
Estimated gain<br />
(+) or loss (-)<br />
(ft 3 /s)<br />
Data source<br />
Period <strong>of</strong><br />
record<br />
Methods Remarks<br />
Confidence<br />
level<br />
1 9 North Fork<br />
Sprague<br />
River<br />
The Elbow (RM 12.2)<br />
to RM 1.5<br />
Subtotal for North Fork Sprague River 92<br />
0 OWRD synoptic<br />
measurement<br />
11/2000 Synoptic measurement No gains o<strong>the</strong>r than tributary<br />
inflows.<br />
3<br />
10 <strong>Upper</strong> Sprague<br />
River<br />
11 <strong>Upper</strong> Sprague<br />
River<br />
South Fork Sprague<br />
at Picnic Area (RM<br />
10.2) to Sprague<br />
at Cinder Pit (RM<br />
77.5)<br />
Cinder Pit (RM 77.5)<br />
to OWRD gage at<br />
Beatty Gap (RM 75)<br />
Subtotal for upper Sprague River 52<br />
26 OWRD/USGS<br />
synoptic<br />
measurements<br />
(2)<br />
26 OWRD/USGS<br />
synoptic<br />
measurements<br />
(2)<br />
11/2000,<br />
10/1970<br />
11/2000,<br />
10/1970<br />
Average Good agreement between<br />
seepage measurements.<br />
Discharge recorded at<br />
Beatty gage during synoptic<br />
measurements was close to<br />
long term average.<br />
Average Large difference between<br />
synoptic measurements.<br />
3<br />
4<br />
1 12 Lower Sprague<br />
River<br />
OWRD gage at Beatty<br />
Gap (RM 75) to<br />
below old RR<br />
crossing (RM 74.2)<br />
1 13 Spring Creek Headwater to mouth<br />
(Sprague RM 73.2).<br />
Note: Spring Creek<br />
is too short to show<br />
on figures; enters<br />
Sprague near Brown<br />
Creek.<br />
14 Brown Creek Headwater to 1 mi<br />
above confluence<br />
(Sprague RM 73)<br />
34 OWRD/USGS<br />
synoptic<br />
measurements<br />
(3)<br />
18 OWRD synoptic<br />
measurements<br />
(2)<br />
3 OWRD synoptic<br />
measurements<br />
(2)<br />
10/1970,<br />
11/2000,<br />
10/2002<br />
11/2000,<br />
10/2002<br />
11/2000,<br />
10/2002<br />
Average Estimate includes gains from<br />
Medicine Springs (14 ft 3 /s<br />
from seven measurements).<br />
Average Good agreement between<br />
synoptic measurements.<br />
Average Good agreement between<br />
synoptic measurements.<br />
3<br />
4<br />
4
74 <strong>Ground</strong>-<strong>Water</strong> <strong>Hydrology</strong> <strong>of</strong> <strong>the</strong> <strong>Upper</strong> <strong>Klamath</strong> <strong>Basin</strong>, <strong>Oregon</strong> <strong>and</strong> California<br />
Table 6. Estimated ground-water discharge to principal stream reaches in <strong>the</strong> upper <strong>Klamath</strong> <strong>Basin</strong>, <strong>Oregon</strong> <strong>and</strong> California.—Continued<br />
[Reach: River miles in Reach column are from <strong>Oregon</strong> <strong>Water</strong> Resources Department <strong>Klamath</strong> Drainage <strong>Basin</strong> Map, Map No. 14.6, 1971. Confidence level: Confidence levels represent a subjective assessment<br />
<strong>of</strong> <strong>the</strong> interval (plus or minus) that has a 95 percent probability <strong>of</strong> containing <strong>the</strong> true value. Confidence level categories are: 1, 10 percent; 2, 20 percent; 3, 30 percent; 4, 50 percent; 5, data insufficient to assess<br />
uncertainty. Subtotals rounded to two significant figures. Unless o<strong>the</strong>rwise noted, values were derived by taking <strong>the</strong> average <strong>of</strong> estimated discharge in <strong>the</strong> fall (Sept, Oct, Nov). USGS synoptic measurement<br />
data from Leonard <strong>and</strong> Harris (1974). Abbreviations: BOR, Bureau <strong>of</strong> Reclamation; CDWR, California Department <strong>of</strong> <strong>Water</strong> Resources; Cr, Creek; ft 3 /s, cubic feet per second; Hwy, Highway; mi, mile; NA,<br />
not applicable; NPS, National Park Service; OWRD, <strong>Oregon</strong> <strong>Water</strong> Resources Department; R, River; Res, Reservoir; RM, river mile; RR, rail road; USFS, U.S. Forest Service; USGS, U.S. Geological Survey]<br />
Number Stream name Reach<br />
Estimated gain<br />
(+) or loss (-)<br />
(ft 3 /s)<br />
Data source<br />
Period <strong>of</strong><br />
record<br />
Methods Remarks<br />
Confidence<br />
level<br />
15 Sprague River Near old RR crossing<br />
(RM 74.2) to<br />
Watchdog Butte<br />
(RM 49)<br />
16 Whisky Creek Headwaters to<br />
approximately 1.0<br />
mi above mouth<br />
1 17 Sprague River Watchdog Butte (RM<br />
49) to below Trout<br />
Cr confluence (RM<br />
37)<br />
1 18 Sprague River Trout Cr confluence<br />
(RM 37) to bridge<br />
near Lone Pine (RM<br />
33)<br />
1 19 Sprague River Bridge near Lone Pine<br />
(RM 33) to above<br />
Wolff Ranch (RM<br />
28.5)<br />
20 Sprague River above Wolff Ranch<br />
(RM 28.5) to below<br />
Kamkaun Springs<br />
(RM 23.2)<br />
7 OWRD/USGS<br />
synoptic<br />
measurements<br />
(2)<br />
13 OWRD/USGS<br />
synoptic<br />
measurements<br />
(3)<br />
11/2000,<br />
10/1970<br />
10/1970,<br />
11/2000,<br />
10/2002<br />
Average Gains within measurement<br />
error. However, some<br />
springs in <strong>the</strong> vicinity<br />
RM 69 <strong>and</strong> 70. Springs<br />
measured 4 ft 3 /s in 10/2002.<br />
Synoptic measurements<br />
made when flows recorded<br />
at USGS gage near<br />
Chiloquin were similar to<br />
long term average.<br />
Average 1970 measurement about 10<br />
ft 3 /s larger than o<strong>the</strong>rs.<br />
0 OWRD 11/1/2000 Synoptic measurement Synoptic measurements made<br />
when flows recorded at<br />
USGS gage near Chiloquin<br />
were similar to long-term<br />
average fall flow.<br />
0 OWRD synoptic<br />
measurements<br />
(2)<br />
4 OWRD/USGS<br />
synoptic<br />
measurements<br />
(3)<br />
50 OWRD synoptic<br />
measurements<br />
11/2000,<br />
10/2002<br />
10/1970,<br />
11/2000,<br />
10/2002<br />
Average Synoptic measurements on<br />
10/1970 demonstrate gain<br />
<strong>of</strong> 30 ft 3 /s. Recent results<br />
do not concur with this<br />
finding.<br />
Average Gains within measurement<br />
error.<br />
11/2000 Synoptic measurement Good agreement with average<br />
<strong>of</strong> 26 direct measurements<br />
on Kamkaun/McReady<br />
springs made from 04/1920<br />
to 09/1973<br />
4<br />
4<br />
3<br />
4<br />
3<br />
2
Table 6 75<br />
Table 6. Estimated ground-water discharge to principal stream reaches in <strong>the</strong> upper <strong>Klamath</strong> <strong>Basin</strong>, <strong>Oregon</strong> <strong>and</strong> California.—Continued<br />
[Reach: River miles in Reach column are from <strong>Oregon</strong> <strong>Water</strong> Resources Department <strong>Klamath</strong> Drainage <strong>Basin</strong> Map, Map No. 14.6, 1971. Confidence level: Confidence levels represent a subjective assessment<br />
<strong>of</strong> <strong>the</strong> interval (plus or minus) that has a 95 percent probability <strong>of</strong> containing <strong>the</strong> true value. Confidence level categories are: 1, 10 percent; 2, 20 percent; 3, 30 percent; 4, 50 percent; 5, data insufficient to assess<br />
uncertainty. Subtotals rounded to two significant figures. Unless o<strong>the</strong>rwise noted, values were derived by taking <strong>the</strong> average <strong>of</strong> estimated discharge in <strong>the</strong> fall (Sept, Oct, Nov). USGS synoptic measurement<br />
data from Leonard <strong>and</strong> Harris (1974). Abbreviations: BOR, Bureau <strong>of</strong> Reclamation; CDWR, California Department <strong>of</strong> <strong>Water</strong> Resources; Cr, Creek; ft 3 /s, cubic feet per second; Hwy, Highway; mi, mile; NA,<br />
not applicable; NPS, National Park Service; OWRD, <strong>Oregon</strong> <strong>Water</strong> Resources Department; R, River; Res, Reservoir; RM, river mile; RR, rail road; USFS, U.S. Forest Service; USGS, U.S. Geological Survey]<br />
Number Stream name Reach<br />
Estimated gain<br />
(+) or loss (-)<br />
(ft 3 /s)<br />
Data source<br />
Period <strong>of</strong><br />
record<br />
Methods Remarks<br />
Confidence<br />
level<br />
21 Sprague River Kamkaun Springs (RM<br />
23.2) to Hwy Bridge<br />
near Braymill (RM<br />
10.1)<br />
1 22 Sprague River Braymill (RM 10.1) to<br />
Chiloquin (RM 5.2)<br />
Subtotal for lower Sprague River 150<br />
19 OWRD synoptic<br />
measurement<br />
0 OWRD synoptic<br />
measurement<br />
11/2000 Synoptic measurement Gains probably near<br />
Whitehorse Spring<br />
11/2000 Synoptic measurement 3<br />
3<br />
1 23 Long Creek Headwaters to T31S,<br />
R12E, S5<br />
24 Long Creek T31S, R12E, S5 to<br />
mouth (Sycan<br />
Marsh)<br />
25 Sycan River Headwaters to Sycan<br />
Marsh (RM 46.5)<br />
Subtotal for upper Sycan River 24<br />
9 USFS gage 10/1992–<br />
09/1997<br />
Index regression to Eagle Cr<br />
above Skull Cr, near New Bridge,<br />
Oreg. (USGS Site 13288200)<br />
OWRD site 61420205 1<br />
7 N/A N/A Regional regression Ungaged drainage area below<br />
USFS gage (OWRD site<br />
61420205)<br />
8 USFS gage 10/1992–<br />
09/1997<br />
Index regression to Deep Cr<br />
above Adel, Oreg. (USGS Site<br />
10371500).<br />
OWRD site 61420209 2<br />
5<br />
1 26 Sycan Marsh Sycan Marsh -10 to -20 USFS gages 10/1992–<br />
09/1997<br />
Subtotal for Sycan Marsh -10 to -20<br />
Mass balance <strong>and</strong> index regression<br />
<strong>of</strong> USFS gage below Sycan<br />
Marsh to Chewaucan R near<br />
Paisley (USGS Site 10384000).<br />
OWRD site 61420210. Gains<br />
calculated from mass<br />
balance with upstream<br />
estimates during <strong>the</strong> fall.<br />
5<br />
1 27 Sycan River Sycan Marsh Outlet<br />
(RM 35) to RM<br />
30 (above Torrent<br />
Spring)<br />
0 OWRD synoptic<br />
measurement<br />
08/2000 Synoptic measurement Overall gains from synoptic<br />
measurements below Sycan<br />
Marsh in 08/2000 is similar<br />
to average difference in fall<br />
flows from gages at OWRD<br />
site 61420210 to USGS Site<br />
11499100.<br />
3
76 <strong>Ground</strong>-<strong>Water</strong> <strong>Hydrology</strong> <strong>of</strong> <strong>the</strong> <strong>Upper</strong> <strong>Klamath</strong> <strong>Basin</strong>, <strong>Oregon</strong> <strong>and</strong> California<br />
Table 6. Estimated ground-water discharge to principal stream reaches in <strong>the</strong> upper <strong>Klamath</strong> <strong>Basin</strong>, <strong>Oregon</strong> <strong>and</strong> California.—Continued<br />
[Reach: River miles in Reach column are from <strong>Oregon</strong> <strong>Water</strong> Resources Department <strong>Klamath</strong> Drainage <strong>Basin</strong> Map, Map No. 14.6, 1971. Confidence level: Confidence levels represent a subjective assessment<br />
<strong>of</strong> <strong>the</strong> interval (plus or minus) that has a 95 percent probability <strong>of</strong> containing <strong>the</strong> true value. Confidence level categories are: 1, 10 percent; 2, 20 percent; 3, 30 percent; 4, 50 percent; 5, data insufficient to assess<br />
uncertainty. Subtotals rounded to two significant figures. Unless o<strong>the</strong>rwise noted, values were derived by taking <strong>the</strong> average <strong>of</strong> estimated discharge in <strong>the</strong> fall (Sept, Oct, Nov). USGS synoptic measurement<br />
data from Leonard <strong>and</strong> Harris (1974). Abbreviations: BOR, Bureau <strong>of</strong> Reclamation; CDWR, California Department <strong>of</strong> <strong>Water</strong> Resources; Cr, Creek; ft 3 /s, cubic feet per second; Hwy, Highway; mi, mile; NA,<br />
not applicable; NPS, National Park Service; OWRD, <strong>Oregon</strong> <strong>Water</strong> Resources Department; R, River; Res, Reservoir; RM, river mile; RR, rail road; USFS, U.S. Forest Service; USGS, U.S. Geological Survey]<br />
Number Stream name Reach<br />
Estimated gain<br />
(+) or loss (-)<br />
(ft 3 /s)<br />
Data source<br />
Period <strong>of</strong><br />
record<br />
Methods Remarks<br />
Confidence<br />
level<br />
28 Torrent Spring Above <strong>and</strong> below<br />
Torrent Spring on<br />
Sycan R (RM 30 to<br />
RM 24)<br />
1 29 Sycan River Below Torrent<br />
Springs (RM 24)<br />
to confluence with<br />
Blue Cr (RM 11)<br />
12 OWRD/USFS<br />
synoptic<br />
measurements<br />
(5)<br />
0 OWRD synoptic<br />
measurement<br />
1 30 Brown Creek 1/4 mi below spring 4 OWRD synoptic<br />
measurement<br />
31 Sycan River Blue Cr confluence<br />
(RM 11) to OWRD<br />
gage (RM 3)<br />
Subtotal for lower Sycan River 21<br />
5 OWRD synoptic<br />
measurement<br />
10/1997,<br />
10/1998,<br />
08/1999,<br />
10/1999,<br />
08/2000<br />
Average Synoptic measurement in<br />
08/2000, plus additional<br />
synoptic measurements<br />
taken at RM 35 <strong>and</strong> RM 24.<br />
Overall gains from synoptic<br />
measurements below Sycan<br />
Marsh in 08/2000 is similar<br />
to average difference in fall<br />
flows from gages.<br />
08/2000 Synoptic measurement Overall gains from synoptic<br />
measurements below Sycan<br />
Marsh in 08/2000 is similar<br />
to average difference in fall<br />
flows from gages at OWRD<br />
site 61420210 to USGS Site<br />
11499100.<br />
08/2000 Synoptic measurement Overall gains from synoptic<br />
measurements below Sycan<br />
Marsh in 08/2000 is similar<br />
to average difference in fall<br />
flows from gages at OWRD<br />
site 61420210 to USGS Site<br />
11499100.<br />
08/2000 Synoptic measurement Overall gains from synoptic<br />
measurements below Sycan<br />
Marsh in 08/2000 is similar<br />
to average difference in fall<br />
flows from gages at OWRD<br />
site 61420210 to USGS Site<br />
11499100.<br />
3<br />
3<br />
3<br />
3
Table 6 77<br />
Table 6. Estimated ground-water discharge to principal stream reaches in <strong>the</strong> upper <strong>Klamath</strong> <strong>Basin</strong>, <strong>Oregon</strong> <strong>and</strong> California.—Continued<br />
[Reach: River miles in Reach column are from <strong>Oregon</strong> <strong>Water</strong> Resources Department <strong>Klamath</strong> Drainage <strong>Basin</strong> Map, Map No. 14.6, 1971. Confidence level: Confidence levels represent a subjective assessment<br />
<strong>of</strong> <strong>the</strong> interval (plus or minus) that has a 95 percent probability <strong>of</strong> containing <strong>the</strong> true value. Confidence level categories are: 1, 10 percent; 2, 20 percent; 3, 30 percent; 4, 50 percent; 5, data insufficient to assess<br />
uncertainty. Subtotals rounded to two significant figures. Unless o<strong>the</strong>rwise noted, values were derived by taking <strong>the</strong> average <strong>of</strong> estimated discharge in <strong>the</strong> fall (Sept, Oct, Nov). USGS synoptic measurement<br />
data from Leonard <strong>and</strong> Harris (1974). Abbreviations: BOR, Bureau <strong>of</strong> Reclamation; CDWR, California Department <strong>of</strong> <strong>Water</strong> Resources; Cr, Creek; ft 3 /s, cubic feet per second; Hwy, Highway; mi, mile; NA,<br />
not applicable; NPS, National Park Service; OWRD, <strong>Oregon</strong> <strong>Water</strong> Resources Department; R, River; Res, Reservoir; RM, river mile; RR, rail road; USFS, U.S. Forest Service; USGS, U.S. Geological Survey]<br />
Number Stream name Reach<br />
Estimated gain<br />
(+) or loss (-)<br />
(ft 3 /s)<br />
Data source<br />
Period <strong>of</strong><br />
record<br />
Methods Remarks<br />
Confidence<br />
level<br />
32 Williamson<br />
River<br />
33 Williamson<br />
River<br />
34 Williamson<br />
River<br />
35 Wickiup<br />
Spring<br />
1 36 Williamson<br />
River<br />
37 Jackson<br />
Creek<br />
Head <strong>of</strong> River Springs<br />
(RM 86)<br />
Head <strong>of</strong> River (RM 86)<br />
to downstream side<br />
<strong>of</strong> reservoir below<br />
Bull Pasture (RM<br />
81)<br />
Reservoir (RM 81)<br />
to above Wickiup<br />
Spring (RM 79.8)<br />
8 OWRD synoptic<br />
measurement<br />
8 OWRD synoptic<br />
measurement<br />
14 OWRD synoptic<br />
measurement<br />
RM 79.8 24 OWRD synoptic<br />
measurement<br />
Below Wickiup Spring<br />
(RM 79.8) to<br />
OWRD gage below<br />
Sheep Cr (RM 67.7)<br />
Headwaters to road<br />
crossing<br />
0 OWRD synoptic<br />
measurement<br />
6 USFS<br />
measurements<br />
(68)<br />
11/2002 Synoptic measurement Dry conditions. Synoptic<br />
measurements made when<br />
OWRD gage below Sheep<br />
Cr (USGS Site 11491400)<br />
at 85 percent <strong>of</strong> average fall<br />
flows.<br />
11/2002 Synoptic measurement Dry conditions. Synoptic<br />
measurements made when<br />
OWRD gage below Sheep<br />
Cr (USGS Site 11491400)<br />
at 85 percent <strong>of</strong> average fall<br />
flows.<br />
11/2002 Synoptic measurement Dry conditions. Synoptic<br />
measurements made when<br />
OWRD gage below Sheep<br />
Cr (USGS Site 11491400)<br />
at 85 percent <strong>of</strong> average fall<br />
flows.<br />
11/2002 Synoptic measurement Dry conditions. Synoptic<br />
measurements made when<br />
OWRD gage below Sheep<br />
Cr (USGS Site 11491400)<br />
at 85 percent <strong>of</strong> average fall<br />
flows.<br />
11/2002 Synoptic measurement Dry conditions. Synoptic<br />
measurements made when<br />
OWRD gage below Sheep<br />
Cr (USGS Site 11491400)<br />
at 85 percent <strong>of</strong> average fall<br />
flows.<br />
11/1991-<br />
04/1997<br />
Miscellaneous measurement<br />
regression to Chewaucan near<br />
Paisley, Oreg. (USGS Site<br />
10384000).<br />
OWRD site 21420110 4<br />
2<br />
2<br />
2<br />
2<br />
2
78 <strong>Ground</strong>-<strong>Water</strong> <strong>Hydrology</strong> <strong>of</strong> <strong>the</strong> <strong>Upper</strong> <strong>Klamath</strong> <strong>Basin</strong>, <strong>Oregon</strong> <strong>and</strong> California<br />
Table 6. Estimated ground-water discharge to principal stream reaches in <strong>the</strong> upper <strong>Klamath</strong> <strong>Basin</strong>, <strong>Oregon</strong> <strong>and</strong> California.—Continued<br />
[Reach: River miles in Reach column are from <strong>Oregon</strong> <strong>Water</strong> Resources Department <strong>Klamath</strong> Drainage <strong>Basin</strong> Map, Map No. 14.6, 1971. Confidence level: Confidence levels represent a subjective assessment<br />
<strong>of</strong> <strong>the</strong> interval (plus or minus) that has a 95 percent probability <strong>of</strong> containing <strong>the</strong> true value. Confidence level categories are: 1, 10 percent; 2, 20 percent; 3, 30 percent; 4, 50 percent; 5, data insufficient to assess<br />
uncertainty. Subtotals rounded to two significant figures. Unless o<strong>the</strong>rwise noted, values were derived by taking <strong>the</strong> average <strong>of</strong> estimated discharge in <strong>the</strong> fall (Sept, Oct, Nov). USGS synoptic measurement<br />
data from Leonard <strong>and</strong> Harris (1974). Abbreviations: BOR, Bureau <strong>of</strong> Reclamation; CDWR, California Department <strong>of</strong> <strong>Water</strong> Resources; Cr, Creek; ft 3 /s, cubic feet per second; Hwy, Highway; mi, mile; NA,<br />
not applicable; NPS, National Park Service; OWRD, <strong>Oregon</strong> <strong>Water</strong> Resources Department; R, River; Res, Reservoir; RM, river mile; RR, rail road; USFS, U.S. Forest Service; USGS, U.S. Geological Survey]<br />
Number Stream name Reach<br />
Estimated gain<br />
(+) or loss (-)<br />
(ft 3 /s)<br />
Data source<br />
Period <strong>of</strong><br />
record<br />
Methods Remarks<br />
Confidence<br />
level<br />
38 Jack Creek Headwaters to Silver<br />
Lake Road<br />
39 Williamson<br />
River<br />
OWRD gage below<br />
Sheep Cr (RM 67.7)<br />
to above Cholo<br />
Ditch (RM 58.3)<br />
Subtotal for upper Williamson River 80<br />
2 OWRD synoptic<br />
measurement<br />
18 OWRD synoptic<br />
measurement<br />
03/2000 Synoptic measurement Wet conditions. Synoptic<br />
measurements made when<br />
OWRD gage below Sheep<br />
Cr (USGS Site 11491400)<br />
at 120 percent <strong>of</strong> average<br />
fall flows.<br />
03/2000 Synoptic measurement Wet conditions. Synoptic<br />
measurements made when<br />
OWRD gage below Sheep<br />
Cr (USGS Site 11491400)<br />
at 120 percent <strong>of</strong> average<br />
fall flows.<br />
4<br />
4<br />
40 <strong>Klamath</strong><br />
Marsh<br />
Cholo Ditch (RM 58.3)<br />
to Kirks Reef (RM<br />
27)<br />
Subtotal for <strong>Klamath</strong> Marsh 50<br />
50 USFWS<br />
marsh stage<br />
measurements<br />
<strong>and</strong> OWRD,<br />
USGS, USFWS<br />
gage data<br />
1971–2000 Mass balance. Annual Average Mass balance used gaged<br />
inflows <strong>and</strong> outflows,<br />
precipitation recorded<br />
at Chemult, <strong>and</strong> marsh<br />
evapotranspiration rates<br />
from USFWS rates coupled<br />
with ungaged tributary flow<br />
estimates<br />
5<br />
41 Big Springs<br />
Creek<br />
Headwaters to<br />
confluence with<br />
Lenz Cr<br />
42 Miller Creek Headwaters to National<br />
Forest Boundary<br />
(RM 8.3)<br />
34 OWRD<br />
measurements<br />
(33)<br />
10/1916–<br />
09/1987<br />
8 USFS gage 10/1992–<br />
09/1997<br />
Average Synoptic measurements<br />
demonstrate some gains<br />
to creek below confluence<br />
with Lenz Cr <strong>and</strong> above<br />
mouth<br />
Index regression to Eagle Cr<br />
above Skull Cr, near New<br />
Bridge, Oreg. (USGS Site<br />
13288200)<br />
OWRD site 61420102 3<br />
4
Table 6 79<br />
Table 6. Estimated ground-water discharge to principal stream reaches in <strong>the</strong> upper <strong>Klamath</strong> <strong>Basin</strong>, <strong>Oregon</strong> <strong>and</strong> California.—Continued<br />
[Reach: River miles in Reach column are from <strong>Oregon</strong> <strong>Water</strong> Resources Department <strong>Klamath</strong> Drainage <strong>Basin</strong> Map, Map No. 14.6, 1971. Confidence level: Confidence levels represent a subjective assessment<br />
<strong>of</strong> <strong>the</strong> interval (plus or minus) that has a 95 percent probability <strong>of</strong> containing <strong>the</strong> true value. Confidence level categories are: 1, 10 percent; 2, 20 percent; 3, 30 percent; 4, 50 percent; 5, data insufficient to assess<br />
uncertainty. Subtotals rounded to two significant figures. Unless o<strong>the</strong>rwise noted, values were derived by taking <strong>the</strong> average <strong>of</strong> estimated discharge in <strong>the</strong> fall (Sept, Oct, Nov). USGS synoptic measurement<br />
data from Leonard <strong>and</strong> Harris (1974). Abbreviations: BOR, Bureau <strong>of</strong> Reclamation; CDWR, California Department <strong>of</strong> <strong>Water</strong> Resources; Cr, Creek; ft 3 /s, cubic feet per second; Hwy, Highway; mi, mile; NA,<br />
not applicable; NPS, National Park Service; OWRD, <strong>Oregon</strong> <strong>Water</strong> Resources Department; R, River; Res, Reservoir; RM, river mile; RR, rail road; USFS, U.S. Forest Service; USGS, U.S. Geological Survey]<br />
Number Stream name Reach<br />
Estimated gain<br />
(+) or loss (-)<br />
(ft 3 /s)<br />
Data source<br />
Period <strong>of</strong><br />
record<br />
43 Sink Creek Headwaters to RM 6.2 4 USFS gage 10/1995–<br />
09/1997<br />
44 Scott Creek Headwaters to above<br />
Highway 232 (RM<br />
4.6)<br />
45 S<strong>and</strong> Creek Headwaters to above<br />
Highway 232 (RM<br />
5.8)<br />
Subtotal for <strong>Klamath</strong> Marsh tributaries 78<br />
9 OWRD(52) <strong>and</strong><br />
USFS(50)<br />
measurements<br />
06/1929–<br />
05/1993<br />
(OWRD)<br />
<strong>and</strong><br />
08/1991–<br />
05/1997<br />
(USFS)<br />
23 USFS gage 10/1992–<br />
09/1997<br />
Methods Remarks<br />
Index regression to Eagle Cr<br />
above Skull Cr, near New<br />
Bridge, Oreg. (USGS Site<br />
13288200)<br />
Miscellaneous measurement<br />
regression to Deschutes River<br />
below Snow Cr, near Lapine,<br />
Oreg. (USGS Site 14050000)<br />
Index regression to Deschutes<br />
River below Snow Cr, near<br />
Lapine,<br />
Oreg. (USGS Site 14050000)<br />
Confidence<br />
level<br />
OWRD site 61420104 2<br />
OWRD site 21420107 3<br />
OWRD site 61420103 3<br />
1 46 Williamson<br />
River<br />
47 Williamson<br />
River<br />
Kirks Reef (RM 27)<br />
to base <strong>of</strong> falls near<br />
Calimus (RM 22.2)<br />
Calimus (RM 22.2) to<br />
old USGS Station<br />
11494000 (RM 19.7)<br />
1 48 Larkin Creek At Williamson<br />
confluence (RM<br />
19.2)<br />
1 49 Larkin Springs At Williamson<br />
confluence (RM<br />
17.5)<br />
0 OWRD synoptic<br />
measurement<br />
22 OWRD<br />
measurements<br />
(16)<br />
10 OWRD<br />
measurements<br />
(27)<br />
10 OWRD synoptic<br />
measurement<br />
10/2002 Synoptic measurement 4<br />
10/1955–<br />
09/1973<br />
10/1923–<br />
11/1985<br />
Average Average <strong>of</strong> difference in<br />
concurrent flows recorded<br />
at Kirk (USGS Site<br />
11493500) <strong>and</strong> below<br />
Road 9730 (USGS Site<br />
11494000). From synoptic<br />
measurements on 10/2002,<br />
gains appear to occur below<br />
Calimus.<br />
Average OWRD site 21420105 3<br />
10/2002 Synoptic measurement 4<br />
3
80 <strong>Ground</strong>-<strong>Water</strong> <strong>Hydrology</strong> <strong>of</strong> <strong>the</strong> <strong>Upper</strong> <strong>Klamath</strong> <strong>Basin</strong>, <strong>Oregon</strong> <strong>and</strong> California<br />
Table 6. Estimated ground-water discharge to principal stream reaches in <strong>the</strong> upper <strong>Klamath</strong> <strong>Basin</strong>, <strong>Oregon</strong> <strong>and</strong> California.—Continued<br />
[Reach: River miles in Reach column are from <strong>Oregon</strong> <strong>Water</strong> Resources Department <strong>Klamath</strong> Drainage <strong>Basin</strong> Map, Map No. 14.6, 1971. Confidence level: Confidence levels represent a subjective assessment<br />
<strong>of</strong> <strong>the</strong> interval (plus or minus) that has a 95 percent probability <strong>of</strong> containing <strong>the</strong> true value. Confidence level categories are: 1, 10 percent; 2, 20 percent; 3, 30 percent; 4, 50 percent; 5, data insufficient to assess<br />
uncertainty. Subtotals rounded to two significant figures. Unless o<strong>the</strong>rwise noted, values were derived by taking <strong>the</strong> average <strong>of</strong> estimated discharge in <strong>the</strong> fall (Sept, Oct, Nov). USGS synoptic measurement<br />
data from Leonard <strong>and</strong> Harris (1974). Abbreviations: BOR, Bureau <strong>of</strong> Reclamation; CDWR, California Department <strong>of</strong> <strong>Water</strong> Resources; Cr, Creek; ft 3 /s, cubic feet per second; Hwy, Highway; mi, mile; NA,<br />
not applicable; NPS, National Park Service; OWRD, <strong>Oregon</strong> <strong>Water</strong> Resources Department; R, River; Res, Reservoir; RM, river mile; RR, rail road; USFS, U.S. Forest Service; USGS, U.S. Geological Survey]<br />
Number Stream name Reach<br />
50 Williamson<br />
River<br />
USGS gage<br />
(11494000) (RM<br />
19.7) to Larkin<br />
Springs confluence<br />
(RM 17.5)<br />
Estimated gain<br />
(+) or loss (-)<br />
(ft 3 /s)<br />
Data source<br />
6 OWRD synoptic<br />
measurement<br />
Period <strong>of</strong><br />
record<br />
Methods Remarks<br />
Confidence<br />
level<br />
10/2002 Synoptic measurement 4<br />
51 Spring Creek Just above Williamson<br />
confluence at RM<br />
16.5<br />
Subtotal for lower Williamson River 350<br />
300 OWRD<br />
measurements<br />
(39)<br />
09/1908–<br />
09/1993<br />
Average Small year to year variability 1<br />
52 Wood River Headwater springs to<br />
Dixon Road (RM<br />
16.2)<br />
53 Annie Creek Headwaters to National<br />
Park Boundary (RM<br />
5.7)<br />
54 Sun Creek Headwaters to National<br />
Park Boundary (RM<br />
5.0)<br />
55 Fort Creek Headwaters to near<br />
Hwy 62 (RM 1.0)<br />
56 Crooked Creek Headwaters to above<br />
Tecumseh Springs<br />
(RM 5.4) near Hwy<br />
62<br />
1 57 Tecumseh<br />
Springs<br />
250 OWRD<br />
measurements<br />
(68)<br />
11/1925–<br />
09/1989<br />
56 USFS gage 10/1992–<br />
09/1997<br />
13 NPS<br />
measurements<br />
(99)<br />
84 OWRD<br />
measurements<br />
(22)<br />
43 OWRD<br />
measurements<br />
(16)<br />
Tecumseh Springs 27 USGS/OWRD<br />
measurements<br />
(7)<br />
58 Agency Creek Headwaters to mouth 21 USGS/OWRD<br />
measurements<br />
(5)<br />
Subtotal for Wood River <strong>and</strong> tributaries 490<br />
07/1989–<br />
09/1997<br />
11/1954–<br />
03/1981<br />
11/1983–<br />
09/1987<br />
08/1907–<br />
10/1909<br />
04/1924–<br />
08/1954<br />
Index regression to Fall River<br />
near Lapine, Oreg. (USGS Site<br />
14057500)<br />
Index regression to Deschutes<br />
River below Snow Cr, near<br />
Lapine,<br />
Oreg. (USGS Site 14050000)<br />
Miscellaneous measurement<br />
regression to Deschutes River<br />
below Snow Cr, near Lapine,<br />
Oreg. (USGS Site 14050000)<br />
Index regression to Fall River<br />
near Lapine, Oreg. (USGS Site<br />
14057500)<br />
OWRD site 21420395 1<br />
OWRD site 61420301 2<br />
OWRD site 21420310 2<br />
OWRD site 21420398 1<br />
Average <strong>of</strong> all measurements 2<br />
Average <strong>of</strong> all measurements 3<br />
Average <strong>of</strong> all measurements 3
Table 6 81<br />
Table 6. Estimated ground-water discharge to principal stream reaches in <strong>the</strong> upper <strong>Klamath</strong> <strong>Basin</strong>, <strong>Oregon</strong> <strong>and</strong> California.—Continued<br />
[Reach: River miles in Reach column are from <strong>Oregon</strong> <strong>Water</strong> Resources Department <strong>Klamath</strong> Drainage <strong>Basin</strong> Map, Map No. 14.6, 1971. Confidence level: Confidence levels represent a subjective assessment<br />
<strong>of</strong> <strong>the</strong> interval (plus or minus) that has a 95 percent probability <strong>of</strong> containing <strong>the</strong> true value. Confidence level categories are: 1, 10 percent; 2, 20 percent; 3, 30 percent; 4, 50 percent; 5, data insufficient to assess<br />
uncertainty. Subtotals rounded to two significant figures. Unless o<strong>the</strong>rwise noted, values were derived by taking <strong>the</strong> average <strong>of</strong> estimated discharge in <strong>the</strong> fall (Sept, Oct, Nov). USGS synoptic measurement<br />
data from Leonard <strong>and</strong> Harris (1974). Abbreviations: BOR, Bureau <strong>of</strong> Reclamation; CDWR, California Department <strong>of</strong> <strong>Water</strong> Resources; Cr, Creek; ft 3 /s, cubic feet per second; Hwy, Highway; mi, mile; NA,<br />
not applicable; NPS, National Park Service; OWRD, <strong>Oregon</strong> <strong>Water</strong> Resources Department; R, River; Res, Reservoir; RM, river mile; RR, rail road; USFS, U.S. Forest Service; USGS, U.S. Geological Survey]<br />
Number Stream name Reach<br />
Estimated gain<br />
(+) or loss (-)<br />
(ft 3 /s)<br />
Data source<br />
Period <strong>of</strong><br />
record<br />
Methods Remarks<br />
Confidence<br />
level<br />
59 Sevenmile<br />
Creek<br />
1 60 Crane Creek Headwaters to<br />
Sevenmile Road<br />
1 61 Mares Egg<br />
Spring<br />
62 Sevenmile<br />
Creek<br />
Headwaters to RM 17 18 USFS gage 10/1992–<br />
09/1997<br />
11 USGS<br />
measurements<br />
(3)<br />
Headwaters to mouth 12 OWRD<br />
RM 17 to Sevenmile<br />
Road<br />
63 Cherry Creek Headwaters to West<br />
Side Road Crossing<br />
64 Fourmile<br />
Creek<br />
Headwaters to West<br />
Side Road Crossing<br />
Subtotal for o<strong>the</strong>r upper <strong>Klamath</strong> Lake<br />
tributaries<br />
measurement<br />
(1)<br />
60 OWRD<br />
measurements<br />
(9)<br />
05/1905–<br />
08/1911<br />
Index regression to North Umpqua<br />
River above Copel<strong>and</strong> Cr near<br />
Toketee Falls, Oreg. (USGS Site<br />
14316500)<br />
OWRD site 61420303 2<br />
Average <strong>of</strong> all measurements 4<br />
10/1954 Four measurements averaged<br />
2.4 ft 3 /s during summer <strong>of</strong><br />
1992 <strong>and</strong> 1994<br />
10/1908–<br />
10/1959<br />
12 USFS gage 10/1992–<br />
09/1997<br />
120<br />
2 USGS gage 10/1964–<br />
09/1967<br />
Average Unknown upstream diversions.<br />
OWRD Site 21420393<br />
Index regression to Rogue R above<br />
Prospect, Oreg. (USGS<br />
Site 14328000)<br />
Index regression to Deer Cr above<br />
Crane Prairie Res, near La Pine,<br />
Oreg. (USGS Site 14052000)<br />
OWRD site 61420302 <strong>and</strong> site<br />
21420397<br />
USGS Site 11505600,<br />
regulated at Fourmile Lake<br />
4<br />
2<br />
2<br />
4<br />
65 <strong>Upper</strong> <strong>Klamath</strong><br />
Lake<br />
<strong>Upper</strong> <strong>Klamath</strong><br />
Lake<br />
Subtotal for upper <strong>Klamath</strong> Lake 350<br />
350 USGS gages 10/1964–<br />
09/1967<br />
Mass balance. Annual average<br />
(rounded).<br />
Published water balanced<br />
study from Hubbard (1970).<br />
Analysis used measured<br />
inflows, outflows, lake<br />
elevations, <strong>and</strong> evaporation<br />
estimates. Agrees with<br />
o<strong>the</strong>r estimates (Cooper,<br />
2004)<br />
3<br />
66 Clear Lake Drainage to Clear Lake<br />
Reservoir Dam (RM<br />
78)<br />
40 USGS gage,<br />
BOR data<br />
10/1904–<br />
09/1951<br />
Average 10/1904–05/1909 USGS gage,<br />
06/1909–09/1951 (Bureau<br />
<strong>of</strong> Reclamation, 1954)<br />
4
82 <strong>Ground</strong>-<strong>Water</strong> <strong>Hydrology</strong> <strong>of</strong> <strong>the</strong> <strong>Upper</strong> <strong>Klamath</strong> <strong>Basin</strong>, <strong>Oregon</strong> <strong>and</strong> California<br />
Table 6. Estimated ground-water discharge to principal stream reaches in <strong>the</strong> upper <strong>Klamath</strong> <strong>Basin</strong>, <strong>Oregon</strong> <strong>and</strong> California.—Continued<br />
[Reach: River miles in Reach column are from <strong>Oregon</strong> <strong>Water</strong> Resources Department <strong>Klamath</strong> Drainage <strong>Basin</strong> Map, Map No. 14.6, 1971. Confidence level: Confidence levels represent a subjective assessment<br />
<strong>of</strong> <strong>the</strong> interval (plus or minus) that has a 95 percent probability <strong>of</strong> containing <strong>the</strong> true value. Confidence level categories are: 1, 10 percent; 2, 20 percent; 3, 30 percent; 4, 50 percent; 5, data insufficient to assess<br />
uncertainty. Subtotals rounded to two significant figures. Unless o<strong>the</strong>rwise noted, values were derived by taking <strong>the</strong> average <strong>of</strong> estimated discharge in <strong>the</strong> fall (Sept, Oct, Nov). USGS synoptic measurement<br />
data from Leonard <strong>and</strong> Harris (1974). Abbreviations: BOR, Bureau <strong>of</strong> Reclamation; CDWR, California Department <strong>of</strong> <strong>Water</strong> Resources; Cr, Creek; ft 3 /s, cubic feet per second; Hwy, Highway; mi, mile; NA,<br />
not applicable; NPS, National Park Service; OWRD, <strong>Oregon</strong> <strong>Water</strong> Resources Department; R, River; Res, Reservoir; RM, river mile; RR, rail road; USFS, U.S. Forest Service; USGS, U.S. Geological Survey]<br />
Number Stream name Reach<br />
67 Lost River Clear Lake Reservoir<br />
(RM 78) to Malone<br />
Dam (64.5)<br />
68 Gerber<br />
Reservoir<br />
Drainage to Gerber<br />
Reservoir<br />
69 Lost River Malone Dam (RM<br />
64.5) to Gift Road<br />
(RM 58)<br />
70 Lost River Gift Road (RM 58) to<br />
Keller Bridge (RM<br />
50.3)<br />
71 Lost River Keller Bridge (RM<br />
50.3) to east<br />
Bonanza (RM 45.1)<br />
72 Lost River East Bonanza (RM<br />
45.1) to Harpold<br />
Bridge (RM 43.9)<br />
73 Lost River Harpold Bridge (RM<br />
43.9) to Harpold<br />
Dam (RM 40.8)<br />
74 Lost River Harpold Dam (RM<br />
40.8) to Kirsh<br />
Bridge (RM 34.8)<br />
Estimated gain<br />
(+) or loss (-)<br />
(ft 3 /s)<br />
Data source<br />
Period <strong>of</strong><br />
record<br />
2 BOR data 08/1987–<br />
08/2002<br />
10 USGS gage,<br />
BOR data<br />
11 OWRD synoptic<br />
measurement<br />
16 OWRD synoptic<br />
measurement<br />
9 OWRD synoptic<br />
measurement<br />
61 OWRD synoptic<br />
measurement<br />
3 OWRD synoptic<br />
measurement<br />
10 OWRD synoptic<br />
measurement<br />
10/1904–<br />
09/1951<br />
Methods Remarks<br />
Mass balance. Only November<br />
average used due to missing<br />
data in o<strong>the</strong>r months.<br />
Discharge in river <strong>and</strong> canals<br />
below Malone Dam minus<br />
Clear Lake mean monthly<br />
releases. Gains within<br />
uncertainty <strong>of</strong> estimate.<br />
Average Flows at Gerber reported by<br />
Bureau <strong>of</strong> Reclamation<br />
(1954)<br />
Confidence<br />
level<br />
12/1997 Synoptic measurement 4<br />
12/1997 Synoptic measurement 4<br />
12/1997 Synoptic measurement Synoptic overall gains (73<br />
ft 3 /s) from Keller Bridge<br />
to Harpold Dam is close to<br />
<strong>the</strong> average (82 ft 3 /s) <strong>of</strong> 13<br />
measurements taken from<br />
11/1925–12/2001<br />
12/1997 Synoptic measurement Synoptic overall gains (73<br />
ft 3 /s) from Keller Bridge<br />
to Harpold Dam is close to<br />
<strong>the</strong> average (82 ft 3 /s) <strong>of</strong> 13<br />
measurements taken from<br />
11/1925–12/2001<br />
12/1997 Synoptic measurement Synoptic overall gains (73<br />
ft 3 /s) from Keller Bridge<br />
to Harpold Dam is close to<br />
<strong>the</strong> average (82 ft 3 /s) <strong>of</strong> 13<br />
measurements taken from<br />
11/1925–12/2001<br />
12/1997 Synoptic measurement 4<br />
4<br />
4<br />
3<br />
3<br />
3
Table 6 83<br />
Table 6. Estimated ground-water discharge to principal stream reaches in <strong>the</strong> upper <strong>Klamath</strong> <strong>Basin</strong>, <strong>Oregon</strong> <strong>and</strong> California.—Continued<br />
[Reach: River miles in Reach column are from <strong>Oregon</strong> <strong>Water</strong> Resources Department <strong>Klamath</strong> Drainage <strong>Basin</strong> Map, Map No. 14.6, 1971. Confidence level: Confidence levels represent a subjective assessment<br />
<strong>of</strong> <strong>the</strong> interval (plus or minus) that has a 95 percent probability <strong>of</strong> containing <strong>the</strong> true value. Confidence level categories are: 1, 10 percent; 2, 20 percent; 3, 30 percent; 4, 50 percent; 5, data insufficient to assess<br />
uncertainty. Subtotals rounded to two significant figures. Unless o<strong>the</strong>rwise noted, values were derived by taking <strong>the</strong> average <strong>of</strong> estimated discharge in <strong>the</strong> fall (Sept, Oct, Nov). USGS synoptic measurement<br />
data from Leonard <strong>and</strong> Harris (1974). Abbreviations: BOR, Bureau <strong>of</strong> Reclamation; CDWR, California Department <strong>of</strong> <strong>Water</strong> Resources; Cr, Creek; ft 3 /s, cubic feet per second; Hwy, Highway; mi, mile; NA,<br />
not applicable; NPS, National Park Service; OWRD, <strong>Oregon</strong> <strong>Water</strong> Resources Department; R, River; Res, Reservoir; RM, river mile; RR, rail road; USFS, U.S. Forest Service; USGS, U.S. Geological Survey]<br />
Number Stream name Reach<br />
75 Lost River Kirsh Bridge (RM<br />
34.8) to Stevenson<br />
Park (RM 30.5)<br />
76 Miller Creek Gerber Reservoir to<br />
mouth<br />
Estimated gain<br />
(+) or loss (-)<br />
(ft 3 /s)<br />
Subtotal for Lost River 200<br />
Data source<br />
29 OWRD synoptic<br />
measurement<br />
4 OWRD<br />
measurement<br />
<strong>and</strong> BOR<br />
reservoir<br />
outflow data<br />
Period <strong>of</strong><br />
record<br />
Methods Remarks<br />
Confidence<br />
level<br />
12/1997 Synoptic measurement 4<br />
12/1997 Mass balance from measurement<br />
<strong>and</strong> reservoir release data.<br />
4<br />
77 Williow Creek Measured at bridge<br />
crossing about 3 mi<br />
from headwater<br />
springs<br />
78 Cottonwood<br />
Creek<br />
Combined<br />
measurements <strong>of</strong><br />
headwaters<br />
springs<br />
79 Sheepy Creek Measured at road<br />
crossing (48N/1E-<br />
35) about 1 mi north<br />
<strong>of</strong> headwater springs<br />
80 Hot Creek Measured at outlet <strong>of</strong><br />
empty reservoir<br />
47N/1E-3 about 0.5<br />
mi from headwater<br />
springs<br />
Subtotal for lower <strong>Klamath</strong> Lake 35<br />
5.8 USGS<br />
measurements<br />
(4)<br />
10 USGS<br />
measurements<br />
(4)<br />
16 USGS<br />
measurements<br />
(5)<br />
3.4 CDWR <strong>and</strong><br />
USGS<br />
measurements<br />
12/1954–<br />
3/1955<br />
12/1954–<br />
5/1955<br />
11/1954–<br />
5/1955<br />
12/1954<br />
(stream)<br />
6/1954<br />
(wells)<br />
Average Wood, 1960 4<br />
Average Wood, 1960 4<br />
Average Wood, 1960 4<br />
Flow <strong>of</strong> spring-fed stream with<br />
probable contributions from<br />
flowing artesian wells<br />
subtracted<br />
Wood, 1960 4
84 <strong>Ground</strong>-<strong>Water</strong> <strong>Hydrology</strong> <strong>of</strong> <strong>the</strong> <strong>Upper</strong> <strong>Klamath</strong> <strong>Basin</strong>, <strong>Oregon</strong> <strong>and</strong> California<br />
Table 6. Estimated ground-water discharge to principal stream reaches in <strong>the</strong> upper <strong>Klamath</strong> <strong>Basin</strong>, <strong>Oregon</strong> <strong>and</strong> California.—Continued<br />
[Reach: River miles in Reach column are from <strong>Oregon</strong> <strong>Water</strong> Resources Department <strong>Klamath</strong> Drainage <strong>Basin</strong> Map, Map No. 14.6, 1971. Confidence level: Confidence levels represent a subjective assessment<br />
<strong>of</strong> <strong>the</strong> interval (plus or minus) that has a 95 percent probability <strong>of</strong> containing <strong>the</strong> true value. Confidence level categories are: 1, 10 percent; 2, 20 percent; 3, 30 percent; 4, 50 percent; 5, data insufficient to assess<br />
uncertainty. Subtotals rounded to two significant figures. Unless o<strong>the</strong>rwise noted, values were derived by taking <strong>the</strong> average <strong>of</strong> estimated discharge in <strong>the</strong> fall (Sept, Oct, Nov). USGS synoptic measurement<br />
data from Leonard <strong>and</strong> Harris (1974). Abbreviations: BOR, Bureau <strong>of</strong> Reclamation; CDWR, California Department <strong>of</strong> <strong>Water</strong> Resources; Cr, Creek; ft 3 /s, cubic feet per second; Hwy, Highway; mi, mile; NA,<br />
not applicable; NPS, National Park Service; OWRD, <strong>Oregon</strong> <strong>Water</strong> Resources Department; R, River; Res, Reservoir; RM, river mile; RR, rail road; USFS, U.S. Forest Service; USGS, U.S. Geological Survey]<br />
Number Stream name Reach<br />
Estimated gain<br />
(+) or loss (-)<br />
(ft 3 /s)<br />
Data source<br />
Period <strong>of</strong><br />
record<br />
Methods Remarks<br />
Confidence<br />
level<br />
81 <strong>Klamath</strong><br />
River<br />
82 Spencer<br />
Creek<br />
Keno Dam (RM 230.5)<br />
to below JC Boyle<br />
powerplant (RM<br />
218.1)<br />
190 USGS gage <strong>and</strong><br />
Pacific Corp.<br />
Reservoir data<br />
10/1967–<br />
10/1987,<br />
10/1989–<br />
09/2001<br />
Headwaters to mouth 27 USGS gage 10/1925–<br />
09/1931<br />
83 Fall Creek Headwaters to mouth 36 USGS gage 07/1928–<br />
09/1959<br />
84 Jenny Creek Headwaters to mouth 9 USGS gage 10/1922–<br />
09/1928<br />
85 <strong>Klamath</strong> River Below JC Boyle<br />
powerplant (RM<br />
218.1) to<br />
Iron Gate Dam<br />
92 USGS gage <strong>and</strong><br />
Pacific Corp.<br />
Reservoir data<br />
10/1967–<br />
09/2000<br />
Average (rounded). Mass balance.<br />
Derived from monthly mean<br />
discharge <strong>and</strong> reservoir content<br />
data. Excludes gains from<br />
Spencer Cr.<br />
Index regression to Rogue River<br />
above Prospect, Oreg. (USGS<br />
Site 14328000)<br />
Index regression to McCloud R<br />
near McCloud CA (USGS Site<br />
11367500)<br />
Index regression to South Fork Little<br />
Butte Cr near Lake Creek, Oreg.<br />
(USGS Site 14341500)<br />
Average. Mass balance from<br />
monthly mean discharge, reservoir<br />
content data, <strong>and</strong> tributary flow<br />
listed in table. Excludes gains<br />
from tributaries listed in table.<br />
USGS gages: (11509500)<br />
<strong>Klamath</strong> River at Keno,<br />
Oreg. <strong>and</strong> (11510700)<br />
<strong>Klamath</strong> River below JC<br />
Boyle powerplant near<br />
Keno, Oreg. Minus gains<br />
estimate from Spencer<br />
Creek.<br />
USGS Site 11510000.<br />
Restarted in 2002 by<br />
OWRD<br />
USGS Site 11512000 2<br />
USGS Site 11516500 3<br />
<strong>Klamath</strong> River below JC<br />
Boyle powerplant near<br />
Keno, Oreg. (USGS Site<br />
11510700) to <strong>Klamath</strong><br />
River below Iron Gate<br />
Dam, Calif. (USGS Site<br />
11516530). Minus gain<br />
estimates from tributaries.<br />
2<br />
3<br />
3<br />
Subtotal for <strong>Klamath</strong> River below Keno 350
Manuscript approved for publication, April 4, 2007<br />
Prepared by <strong>the</strong> USGS Publishing Network,<br />
Publishing Service Center, Tacoma,<br />
Bill Gibbs<br />
Donita Parker<br />
Linda Rogers<br />
Debra Grillo<br />
Ginger Renslow<br />
Bobbie Jo Richey<br />
For more information concerning <strong>the</strong> research in this report, contact <strong>the</strong><br />
<strong>Oregon</strong> <strong>Water</strong> Science Center Director<br />
U.S. Geological Survey<br />
10615 S.E. Cherry Blossom Dr.<br />
Portl<strong>and</strong>, OR 97216<br />
http://or.water.usgs.gov
Printed on recycled paper<br />
<strong>Ground</strong>-<strong>Water</strong> <strong>Hydrology</strong> <strong>of</strong> <strong>the</strong> <strong>Upper</strong> <strong>Klamath</strong> <strong>Basin</strong>,<br />
Gannett <strong>and</strong> o<strong>the</strong>rs SIR 2007–5050<br />
<strong>Oregon</strong> <strong>and</strong> California