Ground-Water Hydrology of the Upper Klamath Basin, Oregon and ...
Ground-Water Hydrology of the Upper Klamath Basin, Oregon and ...
Ground-Water Hydrology of the Upper Klamath Basin, Oregon and ...

You also want an ePaper? Increase the reach of your titles
YUMPU automatically turns print PDFs into web optimized ePapers that Google loves.
Prepared in cooperation with <strong>the</strong> <strong>Oregon</strong> <strong>Water</strong> Resources Department<br />
<strong>Ground</strong>-<strong>Water</strong> <strong>Hydrology</strong> <strong>of</strong> <strong>the</strong> <strong>Upper</strong> <strong>Klamath</strong> <strong>Basin</strong>,<br />
<strong>Oregon</strong> <strong>and</strong> California<br />
Scientific Investigations Report 2007–5050<br />
U.S. Department <strong>of</strong> <strong>the</strong> Interior<br />
U.S. Geological Survey
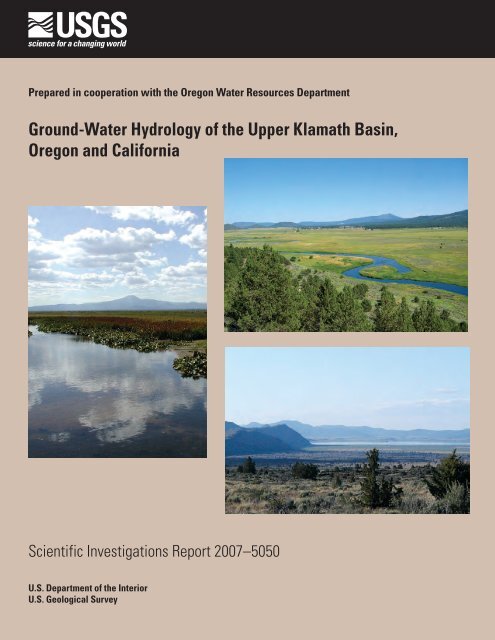
Cover photographs: left, <strong>Klamath</strong> Marsh at Military Crossing, looking west, (photo by Marshall Gannett);<br />
upper right, Sprague River Valley from Knot Tablel<strong>and</strong>, looking sou<strong>the</strong>ast (photo by Ken Lite); lower right,<br />
Sheepy Ridge (on <strong>the</strong> left) <strong>and</strong> <strong>the</strong> Tule Lake subbasin from Lava Beds National Monument, looking north<br />
(photo by Marshall Gannett).
<strong>Ground</strong>-<strong>Water</strong> <strong>Hydrology</strong> <strong>of</strong> <strong>the</strong> <strong>Upper</strong><br />
<strong>Klamath</strong> <strong>Basin</strong>, <strong>Oregon</strong> <strong>and</strong> California<br />
By Marshall W. Gannett, Kenneth E. Lite Jr., Jonathan L. La Marche,<br />
Bruce J. Fisher, <strong>and</strong> Danial J. Polette<br />
Prepared in cooperation with <strong>the</strong> <strong>Oregon</strong> <strong>Water</strong> Resources Department<br />
Scientific Investigations Report 2007–5050<br />
U.S. Department <strong>of</strong> <strong>the</strong> Interior<br />
U.S. Geological Survey
U.S. Department <strong>of</strong> <strong>the</strong> Interior<br />
DIRK KEMPTHORNE, Secretary<br />
U.S. Geological Survey<br />
Mark D. Myers, Director<br />
U.S. Geological Survey, Reston, Virginia: 2007<br />
For product <strong>and</strong> ordering information:<br />
World Wide Web: http://www.usgs.gov/pubprod<br />
Telephone: 1-888-ASK-USGS<br />
For more information on <strong>the</strong> USGS--<strong>the</strong> Federal source for science about <strong>the</strong> Earth, its natural <strong>and</strong> living resources,<br />
natural hazards, <strong>and</strong> <strong>the</strong> environment:<br />
World Wide Web: http://www.usgs.gov<br />
Telephone: 1-888-ASK-USGS<br />
Any use <strong>of</strong> trade, product, or firm names is for descriptive purposes only <strong>and</strong> does not imply endorsement by <strong>the</strong><br />
U.S. Government.<br />
Although this report is in <strong>the</strong> public domain, permission must be secured from <strong>the</strong> individual copyright owners to<br />
reproduce any copyrighted materials contained within this report.<br />
Suggested citation:<br />
Gannett, M.W., Lite, K.E. Jr., La Marche, J.L., Fisher, B.J., <strong>and</strong> Polette, D.J., 2007, <strong>Ground</strong>-water hydrology <strong>of</strong> <strong>the</strong><br />
upper <strong>Klamath</strong> <strong>Basin</strong>, <strong>Oregon</strong> <strong>and</strong> California: U.S. Geological Survey Scientific Investigations Report 2007-5050, 84 p.
iii<br />
Contents<br />
Abstract............................................................................................................................................................1<br />
Introduction.....................................................................................................................................................2<br />
Study Area..............................................................................................................................................2<br />
Purpose <strong>and</strong> Scope...............................................................................................................................8<br />
Geologic Framework......................................................................................................................................8<br />
Geologic Controls on <strong>Ground</strong>-<strong>Water</strong> Flow........................................................................................8<br />
General Geology....................................................................................................................................8<br />
Hydrogeologic Units............................................................................................................................10<br />
Effects <strong>of</strong> Geologic Structure............................................................................................................12<br />
Hydraulic Characteristics <strong>of</strong> Regional Hydrogeologic Units........................................................12<br />
Aquifer Tests...............................................................................................................................13<br />
Well-Yield Tests..........................................................................................................................16<br />
<strong>Ground</strong>-<strong>Water</strong> <strong>Hydrology</strong>............................................................................................................................17<br />
Hydrologic Budget...............................................................................................................................18<br />
<strong>Ground</strong>-<strong>Water</strong> Recharge....................................................................................................................20<br />
<strong>Ground</strong>-<strong>Water</strong> Discharge to Streams..............................................................................................22<br />
Geographic Distribution <strong>of</strong> <strong>Ground</strong>-<strong>Water</strong> Discharge to Streams.....................................23<br />
Temporal Fluctuations in <strong>Ground</strong>-<strong>Water</strong> Discharge to Streams........................................23<br />
<strong>Ground</strong>-<strong>Water</strong> Discharge to Streams by Subbasin..............................................................23<br />
Sprague River Subbasin—Geographic Distribution <strong>of</strong><br />
<strong>Ground</strong>-<strong>Water</strong> Discharge...................................................................................23<br />
Sprague River Subbasin—Temporal Variations in<br />
<strong>Ground</strong>-<strong>Water</strong> Discharge...................................................................................26<br />
Williamson River Subbasin—Geographic Distribution <strong>of</strong><br />
<strong>Ground</strong>-<strong>Water</strong> Discharge...................................................................................27<br />
Williamson River Subbasin—Temporal Variations in<br />
<strong>Ground</strong>-<strong>Water</strong> Discharge...................................................................................28<br />
<strong>Upper</strong> <strong>Klamath</strong> Lake Subbasin—Geographic Distribution <strong>of</strong><br />
<strong>Ground</strong>-<strong>Water</strong> Discharge...................................................................................29<br />
<strong>Upper</strong> <strong>Klamath</strong> Lake Subbasin—Temporal Variations in<br />
<strong>Ground</strong>-<strong>Water</strong> Discharge...................................................................................31<br />
Lost River Subbasin—Geographic Distribution <strong>of</strong> <strong>Ground</strong>-<strong>Water</strong> Discharge........32<br />
Lost River Subbasin—Temporal Variations in <strong>Ground</strong>-<strong>Water</strong> Discharge................33<br />
<strong>Klamath</strong> River Subbasin—Geographic Distribution <strong>of</strong><br />
<strong>Ground</strong>-<strong>Water</strong> Discharge...................................................................................34<br />
<strong>Klamath</strong> River Subbasin—Temporal Variations in <strong>Ground</strong>-<strong>Water</strong> Discharge........35<br />
Summary <strong>of</strong> Geographic <strong>and</strong> Temporal Variations <strong>of</strong> <strong>Ground</strong>-<strong>Water</strong> Discharge<br />
to Streams......................................................................................................................37
iv<br />
Contents—Continued<br />
<strong>Ground</strong>-<strong>Water</strong> <strong>Hydrology</strong>—Continued<br />
<strong>Ground</strong>-<strong>Water</strong> Discharge to Wells...................................................................................................38<br />
Methods.......................................................................................................................................38<br />
<strong>Ground</strong>-<strong>Water</strong> Pumpage for Public-Supply Use...................................................................38<br />
<strong>Ground</strong>-<strong>Water</strong> Pumping for Irrigation.....................................................................................38<br />
Recent Increases in <strong>the</strong> Rate <strong>of</strong> <strong>Ground</strong>-<strong>Water</strong> Pumping...................................................41<br />
Hydraulic Head Distribution <strong>and</strong> <strong>Ground</strong>-<strong>Water</strong> Flow Directions...............................................42<br />
Sprague River Subbasin............................................................................................................46<br />
Williamson River Subbasin.......................................................................................................46<br />
<strong>Upper</strong> <strong>Klamath</strong> Lake Subbasin.................................................................................................46<br />
<strong>Upper</strong> Lost River Subbasin........................................................................................................47<br />
<strong>Klamath</strong> Valley............................................................................................................................47<br />
Butte Valley/Red Rock Valley Area..........................................................................................47<br />
Lower <strong>Klamath</strong> Lake Subbasin.................................................................................................48<br />
Tule Lake Subbasin....................................................................................................................48<br />
<strong>Klamath</strong> Canyon Area................................................................................................................48<br />
Fluctuations in Hydraulic Head.........................................................................................................48<br />
Climate-Induced Fluctuations..................................................................................................50<br />
Pumping-Induced Fluctuations................................................................................................51<br />
Response to Canal Leakage.....................................................................................................51<br />
Response to Lake Stage............................................................................................................53<br />
Long-Term <strong>Water</strong>-Table Fluctuations......................................................................................53<br />
Fluctuations in Hydraulic Head in Response to Recent Increases in<br />
<strong>Ground</strong>-<strong>Water</strong> Pumping...............................................................................................59<br />
Summary <strong>and</strong> Discussion............................................................................................................................64<br />
Acknowledgments........................................................................................................................................65<br />
References Cited..........................................................................................................................................66<br />
Appendix A. L<strong>and</strong>sat Analysis Methods..................................................................................................71
Figures<br />
Figure 1. Map showing <strong>the</strong> upper <strong>Klamath</strong> <strong>Basin</strong>, <strong>Oregon</strong> <strong>and</strong> California, <strong>and</strong> major<br />
geographic features… ……………………………………………………………… 3<br />
Figure 2. Map showing distribution <strong>of</strong> precipitation in <strong>the</strong> upper <strong>Klamath</strong> <strong>Basin</strong>, <strong>Oregon</strong><br />
<strong>and</strong> California, <strong>and</strong> mean monthly precipitation at selected precipitation<br />
measurement stations… …………………………………………………………… 5<br />
Figure 3. Map showing irrigated areas in <strong>the</strong> Bureau <strong>of</strong> Reclamation <strong>Klamath</strong> Project,<br />
<strong>Oregon</strong> <strong>and</strong> California… …………………………………………………………… 7<br />
Figure 4. Map showing hydrogeologic units <strong>of</strong> <strong>the</strong> upper <strong>Klamath</strong> <strong>Basin</strong>, <strong>Oregon</strong> <strong>and</strong><br />
California… ………………………………………………………………………… 11<br />
Figure 5. Graph showing cumulative distribution <strong>of</strong> transmissivity values estimated<br />
from specific-capacity tests for wells producing from Quaternary sediment,<br />
Tertiary sedimentary rock, <strong>and</strong> Tertiary volcanic rock in <strong>the</strong> upper <strong>Klamath</strong><br />
<strong>Basin</strong>, <strong>Oregon</strong> <strong>and</strong> California……………………………………………………… 17<br />
Figure 6. Schematic representation <strong>of</strong> sources <strong>of</strong> ground-water recharge, flow paths,<br />
<strong>and</strong> mechanisms <strong>of</strong> ground-water discharge in <strong>the</strong> upper <strong>Klamath</strong> <strong>Basin</strong>,<br />
<strong>Oregon</strong> <strong>and</strong> California… …………………………………………………………… 20<br />
Figure 7. Map showing principal areas <strong>of</strong> ground-water discharge to streams <strong>and</strong><br />
major springs in <strong>the</strong> upper <strong>Klamath</strong> <strong>Basin</strong>, <strong>Oregon</strong> <strong>and</strong> California, <strong>and</strong><br />
selected stream-gaging stations… ………………………………………………… 24<br />
Figure 8. Graph showing annual precipitation at Crater Lake National Park, <strong>Oregon</strong>,<br />
<strong>and</strong> <strong>the</strong> cumulative departure from average precipitation from 1932 to 2005… …… 25<br />
Figure 9. Graph showing September mean discharge <strong>of</strong> <strong>the</strong> Sprague River near<br />
Chiloquin, <strong>Oregon</strong> (USGS gaging station number 11501000), <strong>and</strong> <strong>the</strong><br />
cumulative departure from average precipitation at Crater Lake, <strong>Oregon</strong>… ……… 27<br />
Figure 10. Graph showing monthly mean discharge <strong>and</strong> September mean discharge <strong>of</strong><br />
<strong>the</strong> Williamson River below Sheep Creek near Lenz, <strong>Oregon</strong> (USGS gaging<br />
station number 11491400), <strong>and</strong> <strong>the</strong> cumulative departure from average<br />
precipitation at Crater Lake, <strong>Oregon</strong>………………………………………………… 28<br />
Figure 11. Graph showing relation between <strong>the</strong> September mean discharge <strong>of</strong> <strong>the</strong><br />
Williamson River below Sheep Creek near Lenz, <strong>Oregon</strong> (USGS gaging<br />
station number 11491400), <strong>and</strong> <strong>the</strong> cumulative departure from average<br />
precipitation at Crater Lake, <strong>Oregon</strong>………………………………………………… 29<br />
Figure 12. Graph showing discharge measurements <strong>of</strong> Spring Creek, estimated<br />
ground-water discharge to <strong>the</strong> lower Williamson River between Kirk <strong>and</strong><br />
Chiloquin, <strong>and</strong> cumulative departure from average precipitation at Crater<br />
Lake, <strong>Oregon</strong>………………………………………………………………………… 30<br />
Figure 13. Graph showing monthly mean discharge <strong>and</strong> January to March mean<br />
discharge <strong>of</strong> Annie Spring near Crater Lake, <strong>Oregon</strong> (USGS gaging station<br />
number 11503000), <strong>and</strong> <strong>the</strong> cumulative departure from average precipitation<br />
at Crater Lake… …………………………………………………………………… 31
vi<br />
Figures—Continued<br />
Figure 14. Graph showing discharge <strong>of</strong> <strong>the</strong> Wood River as measured or estimated at<br />
various sites, <strong>and</strong> <strong>the</strong> cumulative departure from average precipitation at<br />
Crater Lake, <strong>Oregon</strong>… ……………………………………………………………… 32<br />
Figure 15. Graph showing discharge <strong>of</strong> Bonanza Springs <strong>and</strong> cumulative departure from<br />
average precipitation at Crater Lake, <strong>Oregon</strong>… …………………………………… 34<br />
Figure 16. Graph showing August mean gains in flow (a proxy for ground-water<br />
discharge) between Keno (USGS gaging station number 11509500) <strong>and</strong> <strong>the</strong><br />
John C. Boyle power plant (11510700), estimates <strong>of</strong> inflow by PacifiCorp, <strong>and</strong><br />
<strong>the</strong> cumulative departure from average precipitation at Crater Lake, <strong>Oregon</strong>… …… 36<br />
Figure 17. Graph showing September to November mean gains in flow (a proxy for<br />
ground-water discharge) between <strong>the</strong> John C. Boyle power plant (USGS<br />
station number 11510700) <strong>and</strong> Iron Gate Dam (11516530), <strong>and</strong> <strong>the</strong> cumulative<br />
departure from average precipitation at Crater Lake, <strong>Oregon</strong>… …………………… 37<br />
Figure 18. Map showing areas irrigated with ground water in <strong>the</strong> upper <strong>Klamath</strong> <strong>Basin</strong>,<br />
<strong>Oregon</strong> <strong>and</strong> California, during <strong>the</strong> 2000 water year, <strong>and</strong> areas with primary<br />
ground-water irrigation rights in <strong>Oregon</strong>… ………………………………………… 40<br />
Figure 19. Graph showing growth in total acreage with ground-water irrigation rights<br />
(primary <strong>and</strong> supplemental) in <strong>the</strong> upper <strong>Klamath</strong> <strong>Basin</strong> in <strong>Oregon</strong> through<br />
2005… ……………………………………………………………………………… 41<br />
Figure 20. Maps showing distribution <strong>of</strong> ground-water pumping for <strong>the</strong> Bureau <strong>of</strong><br />
Reclamation pilot water bank during water years 2003 <strong>and</strong> 2004, upper<br />
<strong>Klamath</strong> <strong>Basin</strong>, <strong>Oregon</strong> <strong>and</strong> California… …………………………………………… 43<br />
Figure 21. Map showing generalized water-level contours <strong>and</strong> approximate directions<br />
<strong>of</strong> regional ground-water flow in <strong>the</strong> upper <strong>Klamath</strong> <strong>Basin</strong>, <strong>Oregon</strong> <strong>and</strong><br />
California… ………………………………………………………………………… 45<br />
Figure 22. Map showing selected observation wells in <strong>the</strong> upper <strong>Klamath</strong> <strong>Basin</strong>, <strong>Oregon</strong><br />
<strong>and</strong> California… …………………………………………………………………… 49<br />
Figure 23. Graph showing water-level fluctuations in well 30S/07E-06AAA near Bear<br />
Creek nor<strong>the</strong>ast <strong>of</strong> Crater Lake, <strong>Oregon</strong>… ………………………………………… 50<br />
Figure 24. Graph showing water-level fluctuations in well 36S/14E-25BCB near Bly <strong>and</strong><br />
<strong>the</strong> cumulative departure from average precipitation at Crater Lake, <strong>Oregon</strong>… …… 51<br />
Figure 25. Graph showing water-level fluctuations in well 35S/12E-26DCD north <strong>of</strong><br />
Beatty, <strong>Oregon</strong>… …………………………………………………………………… 52<br />
Figure 26. Graph showing water-level fluctuations in well 40S/12E-32CDB northwest <strong>of</strong><br />
Malin, <strong>Oregon</strong>… …………………………………………………………………… 52<br />
Figure 27. Graph showing water-level fluctuations in well 40S/09E-28ADB on <strong>the</strong><br />
southwest side <strong>of</strong> <strong>the</strong> <strong>Klamath</strong> Hills, <strong>Oregon</strong>, <strong>and</strong> monthly discharge in <strong>the</strong><br />
nearby North Canal… ……………………………………………………………… 53<br />
Figure 28. Graph showing water-level fluctuations in shallow <strong>and</strong> deep water-bearing<br />
zones in double-completion well 39S/12E-35ABB near Lorella, <strong>Oregon</strong>… ………… 54<br />
Figure 29. Graph showing water-level fluctuations in shallow <strong>and</strong> deep water-bearing<br />
zones in double-completion well 39S/12E-35ABB near Lorella, <strong>Oregon</strong>, with<br />
time scale exp<strong>and</strong>ed to show effects <strong>of</strong> nearby ground-water pumping… ………… 54
vii<br />
Figures—Continued<br />
Figure 30. Graph showing water-level fluctuations in well 35S/06E-10ACC near Pelican<br />
Butte <strong>and</strong> stage in <strong>Upper</strong> <strong>Klamath</strong> Lake, <strong>Oregon</strong>… ………………………………… 55<br />
Figure 31. Graph showing water-level fluctuations in well 38S/09E-17CBC in <strong>the</strong> north<br />
part <strong>of</strong> <strong>Klamath</strong> Falls <strong>and</strong> stage in <strong>Upper</strong> <strong>Klamath</strong> Lake, <strong>Oregon</strong>… ………………… 55<br />
Figure 32. Graphs showing water-level fluctuations in wells 36S/14E-25BCB near Bly,<br />
39S/11E-20AAD near Bonanza, <strong>and</strong> 41S/14E-08CCA in <strong>the</strong> sou<strong>the</strong>rn Langell<br />
Valley, <strong>Oregon</strong>… …………………………………………………………………… 56<br />
Figure 33. Graphs showing water-level fluctuations in wells 36S/10E-14ACC <strong>and</strong><br />
36S/11E-20DCA in <strong>the</strong> Sprague River Valley, <strong>Oregon</strong>……………………………… 57<br />
Figure 34. Graph showing water-level fluctuations in well 46N/01E-06N01 in Butte<br />
Valley, California… ………………………………………………………………… 58<br />
Figure 35. Graphs showing water-level fluctuations in wells 40S/11E-11BAD in <strong>the</strong><br />
sou<strong>the</strong>rn Poe Valley <strong>and</strong> well 40S/12E-30DCB north <strong>of</strong> Malin, <strong>Oregon</strong>… …………… 58<br />
Figure 36. Graphs showing water-level fluctuations in wells 39S/11E-26ABD <strong>and</strong><br />
39S/12E-35ADD in <strong>the</strong> western Langell Valley, <strong>Oregon</strong>……………………………… 59<br />
Figure 37. Graph showing water-level fluctuations in well 41S/09E-12AAB at <strong>the</strong><br />
sou<strong>the</strong>rn end <strong>of</strong> <strong>the</strong> <strong>Klamath</strong> Hills, <strong>Oregon</strong>… ……………………………………… 60<br />
Figure 38. Map showing water-level decline between spring <strong>and</strong> fall 2004 in <strong>the</strong> <strong>Klamath</strong><br />
Valley <strong>and</strong> Tule Lake areas, upper <strong>Klamath</strong> <strong>Basin</strong>, <strong>Oregon</strong> <strong>and</strong> California… ……… 61<br />
Figure 39. Graph showing water-level fluctuations in well 48N/04E-35L02 near <strong>the</strong> town<br />
<strong>of</strong> Tulelake, California… …………………………………………………………… 62<br />
Figure 40. Map showing water-level decline between spring 2001 <strong>and</strong> spring 2004 in <strong>the</strong><br />
<strong>Klamath</strong> Valley <strong>and</strong> Tule Lake areas, <strong>Oregon</strong> <strong>and</strong> California………………………… 63<br />
Tables<br />
Table 1. Generalized hydrogeologic units in <strong>the</strong> upper <strong>Klamath</strong> <strong>Basin</strong>, <strong>Oregon</strong> <strong>and</strong><br />
California… ………………………………………………………………………… 12<br />
Table 2. Summary <strong>of</strong> selected aquifer tests, upper <strong>Klamath</strong> <strong>Basin</strong>, <strong>Oregon</strong> <strong>and</strong> California 14<br />
Table 3. Estimates <strong>of</strong> major hydrologic budget elements <strong>of</strong> <strong>the</strong> upper <strong>Klamath</strong> <strong>Basin</strong>,<br />
<strong>Oregon</strong> <strong>and</strong> California… …………………………………………………………… 19<br />
Table 4. Estimated ground-water pumping for irrigation in <strong>the</strong> upper <strong>Klamath</strong> <strong>Basin</strong>,<br />
<strong>Oregon</strong> <strong>and</strong> California, during water year 2000……………………………………… 39<br />
Table 5. <strong>Ground</strong>-water pumping for <strong>the</strong> Bureau <strong>of</strong> Reclamation pilot water bank <strong>and</strong><br />
ground-water acquisition program, upper <strong>Klamath</strong> <strong>Basin</strong>, <strong>Oregon</strong> <strong>and</strong> California 42<br />
Table 6. Estimated ground-water discharge to principal stream reaches in <strong>the</strong> upper<br />
<strong>Klamath</strong> <strong>Basin</strong>, <strong>Oregon</strong> <strong>and</strong> California… …………………………………………… 72
viii<br />
Conversion Factors <strong>and</strong> Datums<br />
Conversion Factors<br />
Multiply By To obtain<br />
acre 0.004047 square kilometer (km 2 )<br />
acre-foot (acre-ft) 1,233 cubic meter (m 3 )<br />
acre-foot per year (acre-ft/yr) 1,233 cubic meter per year (m 3 /yr)<br />
cubic foot (ft 3 ) 0.02832 cubic meter (m 3 )<br />
cubic foot per second (ft 3 /s) 0.02832 cubic meter per second (m 3 /s)<br />
cubic foot per second per mile<br />
[(ft 3 /s)/mi]<br />
0.0176 cubic meter per second per kilometer<br />
[(m 3 /s)/km]<br />
foot (ft) 0.3048 meter (m)<br />
foot per day (ft/d) 0.3048 meter per day (m/d)<br />
foot per mile (ft/mi) 0.1894 meter per kilometer (m/km)<br />
foot squared per day (ft 2 /d) 0.09290 meter squared per day (m 2 /d)<br />
gallon (gal) 3.785 liter (L)<br />
gallon per day per foot [(gal/d)/ft] 0.01242 cubic meter per day per meter<br />
[(m 3 /d)/m]<br />
gallon per minute (gal/min) 0.06309 liter per second (L/s)<br />
inch (in.) 2.54 centimeter (cm)<br />
inch per year (in/yr) 25.4 millimeter per year (mm/yr)<br />
mile (mi) 1.609 kilometer (km)<br />
million gallons (Mgal) 3,785 cubic meter (m 3 )<br />
million gallons per day (Mgal/d) 0.04381 cubic meter per second (m 3 /s)<br />
square foot (ft 2 ) 0.09290 square meter (m 2 )<br />
square mile (mi 2 ) 2.590 square kilometer (km 2 )<br />
Temperature in degrees Fahrenheit (°F) may be converted to degrees Celsius (°C) as follows:<br />
Datums<br />
°C = (°F-32)/1.8.<br />
Horizontal coordinate information is referenced to <strong>the</strong> North American Datum <strong>of</strong> 1927 (NAD 27).<br />
Vertical coordinate information is referenced to <strong>the</strong> National Geodetic Vertical Datum <strong>of</strong> 1929<br />
(NGVD 29). In this report, “altitude” refers to <strong>the</strong> distance above <strong>the</strong> vertical datum.<br />
*Transmissivity: The st<strong>and</strong>ard unit for transmissivity is cubic foot per day per square foot times<br />
foot <strong>of</strong> aquifer thickness [(ft 3 /d)/ft 2 ]ft. In this report, <strong>the</strong> ma<strong>the</strong>matically reduced form, foot<br />
squared per day (ft 2 /d), is used for convenience.
ix<br />
Location System<br />
The system used for locating wells <strong>and</strong> springs in this report is based on <strong>the</strong> rectangular system<br />
for subdivision <strong>of</strong> public l<strong>and</strong>. The States <strong>of</strong> <strong>Oregon</strong> <strong>and</strong> California are divided into 36 squaremile<br />
townships numbered according to <strong>the</strong>ir location relative to an east-west baseline <strong>and</strong> a<br />
north-south meridian. In <strong>Oregon</strong>, <strong>the</strong> Willamette base line <strong>and</strong> meridian are used, <strong>and</strong> in California,<br />
<strong>the</strong> Mount Diablo baseline <strong>and</strong> meridian are used. The position <strong>of</strong> a township is given by<br />
its north-south “Township” position relative to <strong>the</strong> baseline <strong>and</strong> its east-west “Range” position<br />
relative to <strong>the</strong> meridian. Each township is divided into 36 sections approximately 1 square mile<br />
(640-acre) in area <strong>and</strong> numbered from 1 to 36. For example, a well designated as 36S/11E-<br />
20DCA is located in Township 36 south, Range 11 east, section 20. The three letters following<br />
<strong>the</strong> section number (A,B,C, or D) correspond to <strong>the</strong> location within <strong>the</strong> section; <strong>the</strong> first<br />
letter identifies <strong>the</strong> quarter section (160 acres), <strong>the</strong> second letter identifies <strong>the</strong> quarter-quarter<br />
section (40 acres), <strong>and</strong> <strong>the</strong> third letter identifies <strong>the</strong> quarter-quarter-quarter section (10 acres).<br />
Thus, well 20DCA is located in <strong>the</strong> NE quarter <strong>of</strong> <strong>the</strong> SW quarter <strong>of</strong> <strong>the</strong> SE quarter <strong>of</strong> section<br />
20. When more than one designated well occurs in <strong>the</strong> quarter-quarter-quarter section, a serial<br />
number is appended. For some wells that were field located during previous studies or by <strong>the</strong><br />
California Department <strong>of</strong> <strong>Water</strong> Resources, a different system <strong>of</strong> letters following <strong>the</strong> section<br />
number was used for <strong>the</strong> location within <strong>the</strong> section. This system assigns a letter to one <strong>of</strong> 16<br />
quarter-quarter sections (40 acres) that divide <strong>the</strong> section. The location 20DCA corresponds to<br />
<strong>the</strong> location 20Q. When more than one designated well occurs in <strong>the</strong> quarter-quarter section, a<br />
serial number is appended.<br />
R. 8 E. R. 10 E. R. 12 E. R. 14 E.<br />
T. 34 S.<br />
T. 36 S.<br />
6<br />
5<br />
4<br />
3<br />
2<br />
1<br />
7 8 9 10 11 12<br />
18<br />
17<br />
16<br />
15<br />
14<br />
13<br />
19 20 21 22 23<br />
24<br />
30<br />
29<br />
28<br />
27<br />
26<br />
25<br />
31 32 33 34 35 36<br />
B<br />
20<br />
A<br />
D<br />
E<br />
C<br />
F<br />
B<br />
G<br />
20<br />
A<br />
H<br />
C<br />
B<br />
D<br />
B A<br />
C<br />
C D<br />
A<br />
D<br />
M<br />
N<br />
L<br />
P<br />
K<br />
Q<br />
J<br />
R<br />
36S/11E-20DCA<br />
36S/11E-20Q
Mapping Sources<br />
Base modified from U.S. Geological Survey 1:100,000 <strong>and</strong> 1:24,000 scale quadrangle maps.<br />
Relief from U.S. Geological Survey National Elevation Data Set 30 meter digital elevation<br />
model. <strong>Klamath</strong> Reclamation Project boundaries are from Bureau <strong>of</strong> Reclamation, <strong>Klamath</strong><br />
<strong>Basin</strong> Area Office GIS data.<br />
Vertical datum: National Geodetic Vertical Datum <strong>of</strong> 1929 (NGVD29)<br />
Projection: Universal Transverse Mercator, Zone 10, 1927 North American Datum<br />
<strong>Ground</strong>-<strong>Water</strong> <strong>Hydrology</strong> <strong>of</strong> <strong>the</strong> <strong>Upper</strong> <strong>Klamath</strong> <strong>Basin</strong>, <strong>Oregon</strong> <strong>and</strong> California
<strong>Ground</strong>-<strong>Water</strong> <strong>Hydrology</strong> <strong>of</strong> <strong>the</strong> <strong>Upper</strong> <strong>Klamath</strong> <strong>Basin</strong>,<br />
<strong>Oregon</strong> <strong>and</strong> California<br />
By Marshall W. Gannett, Kenneth E. Lite Jr., Jonathan L. La Marche, Bruce J. Fisher, <strong>and</strong> Danial J.<br />
Polette<br />
Abstract<br />
The upper <strong>Klamath</strong> <strong>Basin</strong> spans <strong>the</strong> California-<strong>Oregon</strong><br />
border from <strong>the</strong> flank <strong>of</strong> <strong>the</strong> Cascade Range eastward to <strong>the</strong><br />
<strong>Basin</strong> <strong>and</strong> Range Province, <strong>and</strong> encompasses <strong>the</strong> <strong>Klamath</strong><br />
River drainage basin above Iron Gate Dam. Most <strong>of</strong> <strong>the</strong> basin<br />
is semiarid, but <strong>the</strong> Cascade Range <strong>and</strong> upl<strong>and</strong>s in <strong>the</strong> interior<br />
<strong>and</strong> eastern parts <strong>of</strong> <strong>the</strong> basin receive on average more than<br />
30 inches <strong>of</strong> precipitation per year. The basin has several<br />
perennial streams with mean annual discharges <strong>of</strong> hundreds<br />
<strong>of</strong> cubic feet per second, <strong>and</strong> <strong>the</strong> <strong>Klamath</strong> River at Iron Gate<br />
Dam, which represents drainage from <strong>the</strong> entire upper basin,<br />
has a mean annual discharge <strong>of</strong> about 2,100 cubic feet per<br />
second. The basin once contained three large lakes: <strong>Upper</strong> <strong>and</strong><br />
Lower <strong>Klamath</strong> Lakes <strong>and</strong> Tule Lake, each <strong>of</strong> which covered<br />
areas <strong>of</strong> 100 to 150 square miles, including extensive marginal<br />
wetl<strong>and</strong>s. Lower <strong>Klamath</strong> Lake <strong>and</strong> Tule Lake have been<br />
mostly drained, <strong>and</strong> <strong>the</strong> former lake beds are now cultivated.<br />
<strong>Upper</strong> <strong>Klamath</strong> Lake remains, <strong>and</strong> is an important source<br />
<strong>of</strong> irrigation water. Much <strong>of</strong> <strong>the</strong> wetl<strong>and</strong> surrounding <strong>Upper</strong><br />
<strong>Klamath</strong> Lake has been diked <strong>and</strong> drained, although efforts<br />
are underway to restore large areas. <strong>Upper</strong> <strong>Klamath</strong> Lake <strong>and</strong><br />
<strong>the</strong> remaining parts <strong>of</strong> Lower <strong>Klamath</strong> <strong>and</strong> Tule Lakes provide<br />
important wildlife habitat, <strong>and</strong> parts <strong>of</strong> each are included in <strong>the</strong><br />
<strong>Klamath</strong> <strong>Basin</strong> National Wildlife Refuges Complex.<br />
The upper <strong>Klamath</strong> <strong>Basin</strong> has a substantial regional<br />
ground-water flow system. The late Tertiary to Quaternary<br />
volcanic rocks that underlie <strong>the</strong> region are generally<br />
permeable, with transmissivity estimates ranging from 1,000<br />
to 100,000 feet squared per day, <strong>and</strong> compose a system <strong>of</strong><br />
variously interconnected aquifers. Interbedded with <strong>the</strong><br />
volcanic rocks are late Tertiary sedimentary rocks composed<br />
primarily <strong>of</strong> fine-grained lake sediments <strong>and</strong> basin-filling<br />
deposits. These sedimentary deposits have generally low<br />
permeability, are not good aquifers, <strong>and</strong> probably restrict<br />
ground-water movement in some areas. The regional groundwater<br />
system is underlain <strong>and</strong> bounded on <strong>the</strong> east <strong>and</strong> west<br />
by older Tertiary volcanic <strong>and</strong> sedimentary rocks that have<br />
generally low permeability. Eight regional-scale hydrogeologic<br />
units are defined in <strong>the</strong> upper <strong>Klamath</strong> <strong>Basin</strong> on <strong>the</strong> basis <strong>of</strong><br />
surficial geology <strong>and</strong> subsurface data.<br />
<strong>Ground</strong> water flows from recharge areas in <strong>the</strong> Cascade<br />
Range <strong>and</strong> upl<strong>and</strong> areas in <strong>the</strong> basin interior <strong>and</strong> eastern<br />
margins toward stream valleys <strong>and</strong> interior subbasins. <strong>Ground</strong><br />
water discharges to streams throughout <strong>the</strong> basin, <strong>and</strong> most<br />
streams have some component <strong>of</strong> ground water (baseflow).<br />
Some streams, however, are predominantly ground-water<br />
fed <strong>and</strong> have relatively constant flows throughout <strong>the</strong> year.<br />
Large amounts <strong>of</strong> ground water discharge in <strong>the</strong> Wood River<br />
subbasin, <strong>the</strong> lower Williamson River area, <strong>and</strong> along <strong>the</strong><br />
margin <strong>of</strong> <strong>the</strong> Cascade Range. Much <strong>of</strong> <strong>the</strong> inflow to <strong>Upper</strong><br />
<strong>Klamath</strong> Lake can be attributed to ground-water discharge<br />
to streams <strong>and</strong> major spring complexes within a dozen or so<br />
miles from <strong>the</strong> lake. This large component <strong>of</strong> ground water<br />
buffers <strong>the</strong> lake somewhat from climate cycles. There are<br />
also ground-water discharge areas in <strong>the</strong> eastern parts <strong>of</strong> <strong>the</strong><br />
basin, for example in <strong>the</strong> upper Williamson <strong>and</strong> Sprague River<br />
subbasins <strong>and</strong> in <strong>the</strong> Lost River subbasin at Bonanza Springs.<br />
Irrigated agriculture is an integral part <strong>of</strong> <strong>the</strong> economy <strong>of</strong><br />
<strong>the</strong> upper <strong>Klamath</strong> <strong>Basin</strong>. Although estimates vary somewhat,<br />
roughly 500,000 acres are irrigated in <strong>the</strong> upper <strong>Klamath</strong><br />
<strong>Basin</strong>, about 190,000 acres <strong>of</strong> which are part <strong>of</strong> <strong>the</strong> Bureau <strong>of</strong><br />
Reclamation <strong>Klamath</strong> Project. Most <strong>of</strong> this l<strong>and</strong> is irrigated<br />
with surface water. <strong>Ground</strong> water has been used for many<br />
decades to irrigate areas where surface water is not available,<br />
for example outside <strong>of</strong> irrigation districts <strong>and</strong> stream valleys.<br />
<strong>Ground</strong> water has also been used as a supplemental source<br />
<strong>of</strong> water in areas where surface water supplies are limited<br />
<strong>and</strong> during droughts. <strong>Ground</strong> water use for irrigation has<br />
increased in recent years due to drought <strong>and</strong> shifts in surfacewater<br />
allocation from irrigation to instream uses. The shifts in<br />
surface-water allocation have resulted from efforts to improve<br />
habitat for fish listed under <strong>the</strong> Federal Endangered Species<br />
Act.<br />
The ground-water system in <strong>the</strong> upper <strong>Klamath</strong> <strong>Basin</strong><br />
responds to external stresses such as climate cycles, pumping,<br />
lake stage variations, <strong>and</strong> canal operation. This response is<br />
manifest as fluctuations in hydraulic head (as represented<br />
by fluctuations in <strong>the</strong> water-table surface) <strong>and</strong> variations in<br />
ground-water discharge to springs. <strong>Basin</strong>wide, decadal-scale<br />
climate cycles are <strong>the</strong> largest factor controlling head <strong>and</strong><br />
discharge fluctuations. Climate-driven water-table fluctuations<br />
<strong>of</strong> more than 12 feet have been observed near <strong>the</strong> Cascade
<strong>Ground</strong>-<strong>Water</strong> <strong>Hydrology</strong> <strong>of</strong> <strong>the</strong> <strong>Upper</strong> <strong>Klamath</strong> <strong>Basin</strong>, <strong>Oregon</strong> <strong>and</strong> California<br />
Range, <strong>and</strong> decadal-scale fluctuations <strong>of</strong> 5 feet are common<br />
throughout <strong>the</strong> basin. <strong>Ground</strong>-water discharge to springs <strong>and</strong><br />
streams varies basinwide in response to decadal-scale climate<br />
cycles.<br />
The response <strong>of</strong> <strong>the</strong> ground-water system to pumping<br />
is generally largest in areas where pumping occurs. Annual<br />
drawdown <strong>and</strong> recovery cycles <strong>of</strong> 1 to 10 feet are common<br />
in pumping areas. Long-term drawdown effects, where <strong>the</strong><br />
water table has reached or is attempting to reach a new level<br />
in equilibrium with <strong>the</strong> pumping, are apparent in parts <strong>of</strong> <strong>the</strong><br />
basin.<br />
Since 2001, ground-water use in <strong>the</strong> upper <strong>Klamath</strong> <strong>Basin</strong><br />
has increased by about 50 percent. Much <strong>of</strong> this increase has<br />
occurred in <strong>the</strong> area in <strong>and</strong> around <strong>the</strong> Bureau <strong>of</strong> Reclamation<br />
<strong>Klamath</strong> Project, roughly tripling ground-water pumping in<br />
that area. This focused increase in pumping has resulted in<br />
ground-water level declines in <strong>the</strong> pumped aquifer in excess<br />
<strong>of</strong> 10 to 15 feet over a large part <strong>of</strong> <strong>the</strong> Project between 2001<br />
<strong>and</strong> 2004. If pumping rates <strong>of</strong> recent years are continued,<br />
<strong>the</strong> aquifer could achieve a new equilibrium; however, <strong>the</strong><br />
final configuration <strong>of</strong> <strong>the</strong> water table (depth to water) <strong>and</strong> <strong>the</strong><br />
spatial <strong>and</strong> temporal distribution <strong>of</strong> <strong>the</strong> resulting effects to<br />
streams are unknown. Historical water-level data suggest that<br />
<strong>the</strong> water table should recover from recent declines if pumping<br />
is reduced to pre-2001 rates.<br />
Introduction<br />
The upper <strong>Klamath</strong> <strong>Basin</strong> spans <strong>the</strong> <strong>Oregon</strong>-California<br />
border from <strong>the</strong> flank <strong>of</strong> <strong>the</strong> Cascade Range eastward to <strong>the</strong><br />
high desert. Although much <strong>of</strong> <strong>the</strong> basin is high desert, <strong>the</strong><br />
region receives considerable run<strong>of</strong>f from <strong>the</strong> Cascade Range<br />
<strong>and</strong> upl<strong>and</strong>s to <strong>the</strong> east. As a result, <strong>the</strong> area has numerous<br />
perennial streams, large shallow lakes, <strong>and</strong> extensive wetl<strong>and</strong>s,<br />
<strong>and</strong> <strong>the</strong> <strong>Klamath</strong> River has historically supported anadromous<br />
fish runs. <strong>Water</strong> in <strong>the</strong> basin is used for agricultural<br />
irrigation, for extensive waterfowl refuges, <strong>and</strong> to support<br />
aquatic wildlife in lakes <strong>and</strong> streams in <strong>the</strong> upper basin <strong>and</strong><br />
downstream.<br />
The agricultural economy <strong>of</strong> <strong>the</strong> upper <strong>Klamath</strong> <strong>Basin</strong><br />
relies on irrigation water. Just over 500,000 acres are irrigated<br />
in <strong>the</strong> upper <strong>Klamath</strong> <strong>Basin</strong>, about 190,000 acres <strong>of</strong> which<br />
are within <strong>the</strong> <strong>Klamath</strong> Project developed <strong>and</strong> operated by <strong>the</strong><br />
Bureau <strong>of</strong> Reclamation (Reclamation) (Burt <strong>and</strong> Freeman,<br />
2003; Natural Resources Conservation Service, 2004). The<br />
principal source <strong>of</strong> water for <strong>the</strong> Bureau <strong>of</strong> Reclamation<br />
<strong>Klamath</strong> Project is <strong>Upper</strong> <strong>Klamath</strong> Lake. In recent years,<br />
Endangered Species Act biological opinions have required<br />
Reclamation to maintain certain lake levels in <strong>Upper</strong> <strong>Klamath</strong><br />
Lake to protect habitat for endangered fish (specifically<br />
<strong>the</strong> Lost River <strong>and</strong> shortnose suckers) <strong>and</strong> at <strong>the</strong> same time<br />
maintain specified flows in <strong>the</strong> <strong>Klamath</strong> River below <strong>the</strong> lake<br />
<strong>and</strong> project diversions to provide habitat for listed salmon.<br />
This shift in water management has resulted in increased<br />
dem<strong>and</strong>s for water. Owing to <strong>the</strong> limitations <strong>of</strong> o<strong>the</strong>r options,<br />
<strong>the</strong> increased dem<strong>and</strong> has resulted in increased use <strong>of</strong> ground<br />
water in <strong>the</strong> basin. The problems associated with increased<br />
dem<strong>and</strong>s are exacerbated by drought.<br />
The upper <strong>Klamath</strong> <strong>Basin</strong> has a substantial regional<br />
ground-water system, <strong>and</strong> ground water traditionally has<br />
been used for irrigation for many decades in certain areas.<br />
The changes in water management described above coupled<br />
with a series <strong>of</strong> dryer than average years have resulted in an<br />
approximately 50 percent increase in ground-water pumping<br />
in <strong>the</strong> basin since 2001. Most <strong>of</strong> this increase is focused in <strong>the</strong><br />
area <strong>of</strong> <strong>the</strong> <strong>Klamath</strong> Project. Increased pumping has caused<br />
local water-level declines that have been problematic for some<br />
ground-water users <strong>and</strong> generated concern among resource<br />
management agencies <strong>and</strong> <strong>the</strong> community. In addition to <strong>the</strong><br />
measured effects, <strong>the</strong> basic principles <strong>of</strong> hydrology require that<br />
<strong>the</strong> volume <strong>of</strong> ground-water pumped <strong>and</strong> used consumptively<br />
must be <strong>of</strong>fset by changes in flow to or from o<strong>the</strong>r boundaries<br />
including streams.<br />
The effects <strong>of</strong> large-scale ground-water pumping can<br />
spread beyond <strong>the</strong> pumping centers to o<strong>the</strong>r parts <strong>of</strong> <strong>the</strong><br />
regional ground-water system. Prior to this study, <strong>the</strong> groundwater<br />
hydrology had been studied only in separate parts <strong>of</strong> <strong>the</strong><br />
basin, with many areas left undescribed. Therefore, <strong>the</strong>re was<br />
no basic framework with which to underst<strong>and</strong> <strong>the</strong> potential<br />
regional effects <strong>of</strong> ground-water development in <strong>the</strong> basin<br />
<strong>and</strong> <strong>the</strong> broad ramifications <strong>of</strong> water-management decisions.<br />
In 1999, <strong>the</strong> U.S. Geological Survey (USGS) <strong>and</strong> <strong>the</strong> <strong>Oregon</strong><br />
<strong>Water</strong> Resources Department (OWRD) began a cooperative<br />
study to (1) quantitatively characterize <strong>the</strong> regional groundwater<br />
flow system in <strong>the</strong> upper <strong>Klamath</strong> <strong>Basin</strong> <strong>and</strong> (2) develop<br />
a computer model to simulate regional ground-water flow<br />
that can be used to help underst<strong>and</strong> <strong>the</strong> resource <strong>and</strong> test<br />
management scenarios. This report summarizes efforts to<br />
quantitatively characterize <strong>the</strong> ground-water hydrology.<br />
Study Area<br />
The upper <strong>Klamath</strong> <strong>Basin</strong> (fig. 1) comprises <strong>the</strong><br />
entire drainage basin above Iron Gate Dam, including <strong>the</strong><br />
internally drained Lost River <strong>and</strong> Butte Creek subbasins,<br />
<strong>and</strong> encompasses about 8,000 mi 2 (square miles). Studyarea<br />
boundaries were defined to correspond to hydrologic<br />
boundaries across which ground-water flow can be estimated<br />
or assumed negligible. The southwestern boundary near<br />
Iron Gate Dam was selected because it corresponds with <strong>the</strong><br />
transition from a geologic terrane dominated by permeable<br />
volcanic rock to a terrane dominated by older rock with much<br />
lower permeability. It is not likely that significant regional<br />
ground-water flow crosses this geologic boundary. The<br />
boundary between <strong>the</strong> regional flow systems in <strong>the</strong> upper<br />
<strong>Klamath</strong> <strong>Basin</strong> <strong>and</strong> <strong>the</strong> Deschutes <strong>and</strong> Fort Rock <strong>Basin</strong>s to<br />
<strong>the</strong> north (not shown on fig. 1) is defined by a surface-water<br />
divide that roughly corresponds to <strong>the</strong> ground-water divide.
Creek<br />
Introduction<br />
<br />
43°15'<br />
43°00'<br />
45'<br />
30'<br />
15'<br />
42°00'<br />
45'<br />
122°30' 15'<br />
D O U G L A S<br />
Camp Cr<br />
Scotch Cr<br />
Dry Cr<br />
138<br />
62<br />
Butte<br />
Falls<br />
66<br />
Prospect<br />
J A C K S O N<br />
Mt<br />
McLoughlin<br />
Mill Cr<br />
Jenny<br />
Cr<br />
Little<br />
Fall<br />
Cr<br />
<strong>Klamath</strong><br />
Iron<br />
Gate<br />
Res<br />
Bogus<br />
Cr<br />
Shasta<br />
Annie<br />
Spring<br />
Pinehurst<br />
Diamond<br />
Lake<br />
Copco<br />
Lake<br />
230<br />
R A N G E<br />
Crater<br />
Lake<br />
C A S C A D E<br />
Spencer<br />
Edge Cr<br />
Shovel<br />
River<br />
Cr<br />
Crater<br />
Lake<br />
Annie<br />
Creek<br />
Mares<br />
Egg<br />
Spring<br />
Cherry<br />
Creek<br />
Pelican<br />
Butte<br />
Rocky<br />
Point<br />
Fourmile<br />
Cr<br />
Crane<br />
Lake<br />
<strong>of</strong> <strong>the</strong><br />
Woods<br />
Creek<br />
Sevenmile<br />
122°00'<br />
Scott<br />
Creek<br />
S<strong>and</strong><br />
Creek<br />
Sun<br />
Creek<br />
Cr<br />
Fourmile<br />
Creek<br />
Rock<br />
Creek<br />
River<br />
Creek<br />
Aspen<br />
Lake<br />
John C. Boyle<br />
Reservoir<br />
Mount<br />
Thielsen<br />
Wood<br />
River<br />
<strong>Upper</strong><br />
Spring<br />
Creek<br />
Agency<br />
Lake<br />
Keno<br />
Dam<br />
<strong>Klamath</strong><br />
Strait<br />
John C. Boyle<br />
Power Plant<br />
Larkin<br />
Creek<br />
<strong>Klamath</strong><br />
Lake<br />
Big<br />
Springs<br />
Creek<br />
45'<br />
Lower<br />
<strong>Klamath</strong><br />
Lake<br />
S I S K I Y O U<br />
Jack<br />
30'<br />
K L A M AT H<br />
Sprague<br />
Trout Cr<br />
Creek<br />
Fort<br />
<strong>Klamath</strong><br />
Kirk<br />
Solomon<br />
Butte<br />
<strong>Klamath</strong><br />
Agency<br />
Whitehorse<br />
Spring<br />
McReady<br />
62 Chiloquin Spring<br />
Narrows<br />
Chiloquin Kamkaun<br />
Spring<br />
140<br />
Keno<br />
Dorris<br />
Miller<br />
Creek<br />
Sink<br />
Creek<br />
138<br />
Butte<br />
Valley<br />
Macdoel<br />
Lenz<br />
Modoc<br />
Point<br />
66<br />
97<br />
<strong>Klamath</strong> Valley<br />
<strong>Klamath</strong> Hills<br />
North Canal<br />
Chemult<br />
Silver<br />
<strong>Klamath</strong><br />
Red Rock Valley<br />
Marsh<br />
Lake<br />
Wildhorse<br />
Ridge<br />
Olene<br />
Lost River<br />
Diversion<br />
Channel<br />
Merrill<br />
Yonna Valley<br />
Lost<br />
River<br />
Sheepy Ridge<br />
Williamson<br />
Buck<br />
Cr<br />
Tule<br />
Lake<br />
Sump<br />
Sheep<br />
Creek<br />
River<br />
Taylor<br />
Butte<br />
Rocky<br />
Ford<br />
Knot Tablel<strong>and</strong><br />
Sprague<br />
River<br />
Swan Lake Valley<br />
Dairy<br />
<strong>Klamath</strong> Falls<br />
Lake Ewauna The<br />
Gap<br />
Poe Valley<br />
Stukel<br />
Mountain<br />
River<br />
Lost<br />
Road<br />
Jackson<br />
Creek<br />
Wickiup<br />
Spring<br />
Whisky<br />
Creek<br />
Bly<br />
Mt<br />
70<br />
Malin<br />
River<br />
Tulelake<br />
Long<br />
Sycan<br />
Brown<br />
Spring<br />
15'<br />
Yamsay<br />
Mountain<br />
Torrent<br />
Spring<br />
Bonanza<br />
Area shown in figures 3, 20, 38, <strong>and</strong> 40<br />
Study<br />
Spodue<br />
Mountain<br />
Bryant Mountain<br />
Creek<br />
River<br />
Brown<br />
Creek<br />
Yainax<br />
Butte<br />
Lorella<br />
Fivemile<br />
Miller Cr<br />
Langell<br />
Valley<br />
Clear<br />
Lake<br />
Res<br />
Silver<br />
Lake<br />
area<br />
Sycan<br />
Marsh<br />
Creek<br />
Meryl<br />
Bly Ridge<br />
121°00'<br />
Fork<br />
N<br />
Beatty<br />
Beatty<br />
Gap<br />
Bly<br />
<strong>Upper</strong><br />
<strong>Klamath</strong><br />
<strong>Basin</strong><br />
L A K E<br />
Creek<br />
Fritz<br />
Creek<br />
S Fork<br />
Gerber<br />
Reservoir<br />
Willow<br />
Boles<br />
31<br />
M O D O C<br />
River<br />
Sprague<br />
Summer<br />
Lake<br />
boundary<br />
Deming<br />
Creek<br />
Creek<br />
Cr<br />
OREGON<br />
Winter Ridge<br />
River<br />
Sprague<br />
CALIFORNIA<br />
120°<br />
45'<br />
Summer Lake<br />
Barns Rim<br />
Modoc Plateau<br />
Gearhart<br />
Mountain<br />
Brownsworth<br />
Creek<br />
140<br />
Coleman Rim<br />
OREGON<br />
CALIFORNIA<br />
41°30'<br />
Shasta River<br />
5<br />
Whitney<br />
Creek<br />
97<br />
Butte<br />
Medicine<br />
139<br />
Lake<br />
Volcano<br />
Scale 1:1,000,000<br />
5 0 5 10 15 20 MILES<br />
5 0 5 10 15 20 KILOMETERS<br />
299<br />
Pit<br />
River<br />
See table <strong>of</strong> contents for mapping sources<br />
Figure 1.<br />
The upper <strong>Klamath</strong> <strong>Basin</strong>, <strong>Oregon</strong> <strong>and</strong> California, <strong>and</strong> major geographic features.<br />
OR19-0048_fig01
<strong>Ground</strong>-<strong>Water</strong> <strong>Hydrology</strong> <strong>of</strong> <strong>the</strong> <strong>Upper</strong> <strong>Klamath</strong> <strong>Basin</strong>, <strong>Oregon</strong> <strong>and</strong> California<br />
This boundary is likely permeable. The boundary between <strong>the</strong><br />
ground-water system <strong>of</strong> <strong>the</strong> upper <strong>Klamath</strong> <strong>Basin</strong> <strong>and</strong> that <strong>of</strong><br />
<strong>the</strong> Pit River <strong>Basin</strong> to <strong>the</strong> south also is defined by a surfacewater<br />
divide in most places. The sou<strong>the</strong>rn surface-water divide<br />
does not correspond to a ground-water divide in all places, as<br />
hydraulic head data indicate that <strong>the</strong>re is southward flow <strong>of</strong><br />
ground water from <strong>the</strong> upper <strong>Klamath</strong> <strong>Basin</strong> south <strong>of</strong> <strong>the</strong> Tule<br />
Lake subbasin toward <strong>the</strong> Pit River <strong>Basin</strong>. The eastern studyarea<br />
boundary corresponds to a surface-water divide <strong>and</strong> is<br />
characterized in many places by a transition to older geologic<br />
strata.<br />
The upper <strong>Klamath</strong> <strong>Basin</strong> occupies a broad, faulted,<br />
volcanic plateau that spans <strong>the</strong> boundary between <strong>the</strong> Cascade<br />
Range <strong>and</strong> <strong>Basin</strong> <strong>and</strong> Range geologic provinces. The basin<br />
is bounded by <strong>the</strong> volcanic arc <strong>of</strong> <strong>the</strong> Cascade Range on <strong>the</strong><br />
west, <strong>the</strong> Deschutes <strong>Basin</strong> to <strong>the</strong> north, <strong>the</strong> internally drained<br />
Silver Lake, Summer Lake, <strong>and</strong> Goose Lake <strong>Basin</strong>s to <strong>the</strong><br />
east, <strong>and</strong> <strong>the</strong> Pit River <strong>Basin</strong> to <strong>the</strong> south. The altitude <strong>of</strong> <strong>the</strong><br />
Cascade Range along <strong>the</strong> western margin ranges from 5,000<br />
to 7,000 ft (feet) with major peaks such as Mount McLoughlin<br />
<strong>and</strong> Mount Thielsen exceeding 9,000 ft. The interior parts <strong>of</strong><br />
<strong>the</strong> basin are dominated by northwest-trending fault-bounded<br />
basins, typically several miles wide, with intervening upl<strong>and</strong>s.<br />
<strong>Basin</strong> floors range in altitude from roughly 4,000 to 4,500 ft,<br />
<strong>and</strong> adjoining fault-block upl<strong>and</strong> altitudes range from 4,500 to<br />
more than 5,000 ft. The nor<strong>the</strong>rn <strong>and</strong> eastern parts <strong>of</strong> <strong>the</strong> upper<br />
<strong>Klamath</strong> <strong>Basin</strong> consist <strong>of</strong> a volcanic upl<strong>and</strong> with numerous<br />
eruptive centers, including Yamsay <strong>and</strong> Gearhart Mountains,<br />
both <strong>of</strong> which exceed 8,000 ft. The sou<strong>the</strong>astern margin <strong>of</strong><br />
<strong>the</strong> upper <strong>Klamath</strong> <strong>Basin</strong> consists <strong>of</strong> a broad, rugged, volcanic<br />
upl<strong>and</strong> known as <strong>the</strong> Modoc Plateau, where most <strong>of</strong> <strong>the</strong> l<strong>and</strong><br />
surface ranges from 4,500 to 5,000 ft. The sou<strong>the</strong>rn margin<br />
<strong>of</strong> <strong>the</strong> basin is marked by <strong>the</strong> broad shield <strong>of</strong> Medicine Lake<br />
Volcano, which reaches an altitude <strong>of</strong> 7,913 ft.<br />
The upper <strong>Klamath</strong> <strong>Basin</strong> is semiarid because <strong>the</strong><br />
Cascade Range intercepts much <strong>of</strong> <strong>the</strong> moisture from <strong>the</strong><br />
predominantly eastward moving Pacific wea<strong>the</strong>r systems.<br />
Mean annual precipitation (1961–90) ranges from 65.4 inches<br />
at Crater Lake National Park in <strong>the</strong> Cascade Range to 13.5<br />
inches at <strong>Klamath</strong> Falls (fig. 2). Most precipitation occurs in<br />
<strong>the</strong> fall <strong>and</strong> winter. November through March precipitation<br />
accounts for 71 percent <strong>of</strong> <strong>the</strong> total at Crater Lake <strong>and</strong> 64<br />
percent <strong>of</strong> <strong>the</strong> total at <strong>Klamath</strong> Falls. Most precipitation falls<br />
as snow at higher elevations. The interior parts <strong>of</strong> <strong>the</strong> basin<br />
are very dry during <strong>the</strong> spring <strong>and</strong> summer; mean monthly<br />
precipitation at <strong>Klamath</strong> Falls is less than 1 inch from April<br />
through October. Winters are generally cold, with January<br />
mean minimum <strong>and</strong> maximum temperatures <strong>of</strong> 20.3°F <strong>and</strong><br />
38.8°F, respectively, at <strong>Klamath</strong> Falls <strong>and</strong> 17.5°F <strong>and</strong> 34.5°F,<br />
respectively, at Crater Lake. Summers, in contrast, are warm,<br />
with July mean minimum <strong>and</strong> maximum temperatures <strong>of</strong><br />
50.8°F <strong>and</strong> 84.6°F, respectively, at <strong>Klamath</strong> Falls <strong>and</strong> 39.8°F<br />
<strong>and</strong> 68.0°F, respectively, at Crater Lake.<br />
Principal streams in <strong>the</strong> upper <strong>Klamath</strong> <strong>Basin</strong> include <strong>the</strong><br />
Williamson River, which drains <strong>the</strong> nor<strong>the</strong>rn <strong>and</strong> eastern parts<br />
<strong>of</strong> <strong>the</strong> basin; <strong>the</strong> Sprague River (a tributary to <strong>the</strong> Williamson)<br />
which drains part <strong>of</strong> <strong>the</strong> eastern side <strong>of</strong> <strong>the</strong> basin; <strong>the</strong> Lost<br />
River, which drains <strong>the</strong> sou<strong>the</strong>astern part <strong>of</strong> <strong>the</strong> basin; <strong>and</strong> <strong>the</strong><br />
<strong>Klamath</strong> River (fig. 1). The Lost River subbasin is actually a<br />
closed stream basin. Prior to development, <strong>the</strong> river flowed to<br />
internally drained Tule Lake, although it occasionally received<br />
flow from <strong>the</strong> <strong>Klamath</strong> River during floods. The Lost River<br />
is now diverted just below Olene into a channel across a low<br />
divide to <strong>the</strong> <strong>Klamath</strong> River. Generally, little water from <strong>the</strong><br />
Lost River drainage above <strong>the</strong> diversion channel now flows to<br />
<strong>the</strong> Tule Lake subbasin. The largest lake in <strong>the</strong> basin is <strong>Upper</strong><br />
<strong>Klamath</strong> Lake, which has a surface area between 100 <strong>and</strong> 140<br />
mi 2 (including non-drained fringe wetl<strong>and</strong>s) depending on<br />
stage (Hubbard, 1970; Snyder <strong>and</strong> Morace, 1997). Principal<br />
tributaries to <strong>Upper</strong> <strong>Klamath</strong> Lake include <strong>the</strong> Williamson<br />
River, <strong>the</strong> Wood River (which originates at a series <strong>of</strong> large<br />
springs north <strong>of</strong> <strong>the</strong> lake), <strong>and</strong> several streams emanating from<br />
<strong>the</strong> Cascade Range.<br />
The 250-mi (mile)-long <strong>Klamath</strong> River begins at <strong>the</strong><br />
outlet <strong>of</strong> <strong>Upper</strong> <strong>Klamath</strong> Lake, which is controlled by a dam.<br />
For <strong>the</strong> first mile downstream <strong>of</strong> <strong>the</strong> lake, <strong>the</strong> river is known<br />
as <strong>the</strong> Link River. About 1 mi below <strong>the</strong> dam, <strong>the</strong> river flows<br />
into a 20-mi-long narrow reservoir behind Keno Dam known<br />
as Lake Ewauna. The dam for ano<strong>the</strong>r impoundment, John<br />
C. Boyle Reservoir, is about 10 mi below Keno Dam. Below<br />
John C. Boyle Dam, <strong>the</strong> river enters a narrow canyon <strong>and</strong><br />
flows freely about 20 mi to Copco Lake (a reservoir) <strong>and</strong><br />
immediately below that, Iron Gate Reservoir. Iron Gate Dam,<br />
at about river mile 190, marks <strong>the</strong> downstream boundary <strong>of</strong><br />
<strong>the</strong> upper <strong>Klamath</strong> <strong>Basin</strong>. There are no impoundments on <strong>the</strong><br />
<strong>Klamath</strong> River below Iron Gate Dam.<br />
The surface hydrology <strong>of</strong> <strong>the</strong> upper <strong>Klamath</strong> <strong>Basin</strong><br />
has been extensively modified by drainage <strong>of</strong> lakes <strong>and</strong><br />
wetl<strong>and</strong>s for agriculture <strong>and</strong> routing <strong>of</strong> irrigation water.<br />
Prior to development, <strong>the</strong> Tule Lake <strong>and</strong> Lower <strong>Klamath</strong><br />
Lake subbasins contained large lakes fringed by extensive<br />
wetl<strong>and</strong>s. Under natural conditions, <strong>the</strong> Lost River flowed<br />
from <strong>the</strong> upper Lost River subbasin through <strong>the</strong> gap near<br />
Olene <strong>and</strong> <strong>the</strong>n south to Tule Lake. The Lost River system<br />
received flow from <strong>the</strong> <strong>Klamath</strong> River system during periods<br />
<strong>of</strong> flood. Prior to development <strong>of</strong> <strong>the</strong> Bureau <strong>of</strong> Reclamation<br />
<strong>Klamath</strong> Project, <strong>the</strong> high stage <strong>of</strong> Tule Lake was about 4,060<br />
ft (La Rue, 1922). At this stage, <strong>the</strong> lake would cover an area<br />
exceeding 96,000 acres. Historical accounts indicate that at<br />
high stage Tule Lake drained into <strong>the</strong> lava flows along <strong>the</strong><br />
sou<strong>the</strong>rn margin. In <strong>the</strong> early 1900s, <strong>the</strong> U.S. Reclamation<br />
Service (predecessor to <strong>the</strong> Bureau <strong>of</strong> Reclamation)<br />
experimented with augmenting this subsurface drainage in<br />
early attempts to drain <strong>the</strong> lake. La Rue (1922) argued that<br />
<strong>the</strong> fact that <strong>the</strong> water <strong>of</strong> Tule Lake was fresh, <strong>and</strong> not saline,<br />
was pro<strong>of</strong> that <strong>the</strong> lake “in <strong>the</strong> past had an outlet.” Subsurface<br />
drainage is also suggested by <strong>the</strong> hydraulic head gradient that<br />
slopes southward away from <strong>the</strong> Tule Lake subbasin toward<br />
<strong>the</strong> Pit River <strong>Basin</strong>. In 1912, a canal <strong>and</strong> dam were completed<br />
that allowed <strong>the</strong> diversion <strong>of</strong> water from <strong>the</strong> Lost River to<br />
<strong>the</strong> <strong>Klamath</strong> River, cutting <strong>of</strong>f <strong>the</strong> supply <strong>of</strong> water to Tule<br />
Lake. Most <strong>of</strong> <strong>the</strong> Tule Lake <strong>Basin</strong> was drained <strong>and</strong> is now
Introduction<br />
<br />
MEAN MONTHLY PRECIPITATION,<br />
IN INCHES<br />
MEAN MONTHLY PRECIPITATION,<br />
IN INCHES<br />
12<br />
10<br />
12<br />
10<br />
MEAN MONTHLY PRECIPITATION,<br />
IN INCHES<br />
MEAN MONTHLY PRECIPITATION,<br />
IN INCHES<br />
12<br />
10<br />
8<br />
6<br />
4<br />
2<br />
CRATER LAKE<br />
1961–90 mean<br />
annual total,<br />
65.4 inches<br />
0<br />
O N D J F M A M J J A S<br />
8<br />
6<br />
4<br />
2<br />
8<br />
6<br />
4<br />
2<br />
HOWARD PRAIRIE DAM<br />
1961–90 mean<br />
annual total,<br />
32.8 inches<br />
0<br />
O N D J F M A M J J A S<br />
12<br />
10<br />
8<br />
6<br />
4<br />
2<br />
MEAN MONTHLY PRECIPITATION,<br />
IN INCHES<br />
12<br />
10<br />
42°00'<br />
122°30'<br />
MOUNT HEBRON<br />
1961–90 mean<br />
annual total,<br />
12.6 inches<br />
0<br />
O N D J F M A M J J A S<br />
8<br />
6<br />
4<br />
2<br />
40<br />
140<br />
66<br />
<strong>Klamath</strong><br />
!.<br />
Crater<br />
Lake<br />
62<br />
<strong>Upper</strong><br />
<strong>Klamath</strong><br />
Lake<br />
River<br />
Dorris<br />
!.<br />
97<br />
138<br />
97<br />
!.<br />
Chiloquin<br />
!. !.<br />
20<br />
43°00'<br />
42°30'<br />
40<br />
30<br />
50<br />
41°30'<br />
60<br />
70<br />
60<br />
50<br />
60<br />
TULE LAKE<br />
1961–90 mean<br />
annual total,<br />
11.1 inches<br />
0<br />
O N D J F M A M J J A S<br />
CHEMULT<br />
1961–90 mean<br />
annual total,<br />
24.9 inches<br />
0<br />
O N D J F M A M J J A S<br />
50<br />
60<br />
5040<br />
122°00'<br />
20<br />
40<br />
20<br />
50<br />
20<br />
30<br />
40<br />
30<br />
30<br />
20<br />
MEAN MONTHLY PRECIPITATION,<br />
IN INCHES<br />
30<br />
Lower<br />
<strong>Klamath</strong><br />
Lake<br />
20<br />
40<br />
30<br />
12<br />
10<br />
8<br />
6<br />
4<br />
2<br />
20<br />
<strong>Klamath</strong><br />
Falls<br />
30<br />
20<br />
30<br />
121°30'<br />
!.<br />
Williamson River<br />
Sprague<br />
!.<br />
Tule<br />
Lake<br />
KLAMATH FALLS<br />
1961–90 mean<br />
annual total,<br />
13.5 inches<br />
0<br />
O N D J F M A M J J A S<br />
40<br />
20<br />
Bonanza<br />
Malin<br />
30<br />
Sycan<br />
140<br />
20<br />
River<br />
Lost River<br />
Clear<br />
Lake<br />
139<br />
River<br />
121°00'<br />
30<br />
North Fork<br />
South Fork<br />
0 10 20 30 40 50 MILES<br />
0 10 20 30 40 50 KILOMETERS<br />
20<br />
30<br />
MEAN MONTHLY PRECIPITATION,<br />
IN INCHES<br />
30<br />
!.<br />
OREGON<br />
CALIFORNIA<br />
12<br />
10<br />
8<br />
6<br />
4<br />
2<br />
30<br />
20<br />
20<br />
EXPLANATION<br />
SPRAGUE RIVER<br />
1961–90 mean<br />
annual total,<br />
16.2 inches<br />
0<br />
O N D J F M A M J J A S<br />
MEAN MONTHLY PRECIPITATION,<br />
IN INCHES<br />
12<br />
10<br />
8<br />
6<br />
4<br />
2<br />
ROUND GROVE<br />
1961–90 mean<br />
annual total,<br />
17.8 inches<br />
0<br />
O N D J F M A M J J A S<br />
Line <strong>of</strong> equal precipitation—<br />
Interval 10 inches<br />
Precipitation station<br />
Figure 2. Distribution <strong>of</strong> precipitation in <strong>the</strong> upper <strong>Klamath</strong> <strong>Basin</strong>, <strong>Oregon</strong> <strong>and</strong> California, <strong>and</strong> mean monthly precipitation at<br />
selected precipitation measurement stations. (Data from <strong>Oregon</strong> State University PRISM Group, 2006; <strong>and</strong> Western Regional<br />
Climate Center, 2006.)<br />
OR19-0048_fig02
<strong>Ground</strong>-<strong>Water</strong> <strong>Hydrology</strong> <strong>of</strong> <strong>the</strong> <strong>Upper</strong> <strong>Klamath</strong> <strong>Basin</strong>, <strong>Oregon</strong> <strong>and</strong> California<br />
under cultivation. The only remnant <strong>of</strong> <strong>the</strong> lake is <strong>the</strong> Tule<br />
Lake Sump in <strong>the</strong> sou<strong>the</strong>rn <strong>and</strong> western parts <strong>of</strong> <strong>the</strong> basin<br />
that collect irrigation return flow. Since 1942, water from <strong>the</strong><br />
sump has been pumped via tunnel through Sheepy Ridge into<br />
<strong>the</strong> Lower <strong>Klamath</strong> Lake subbasin. The Lower <strong>Klamath</strong> Lake<br />
subbasin once held a large lake-marsh complex that covered<br />
approximately 88,000 acres, about 58,000 acres <strong>of</strong> which were<br />
marginal wetl<strong>and</strong>s with <strong>the</strong> remaining 30,000 acres open water<br />
(La Rue, 1922). Lower <strong>Klamath</strong> Lake was connected to <strong>the</strong><br />
<strong>Klamath</strong> River through a channel known as <strong>the</strong> <strong>Klamath</strong> Strait,<br />
<strong>and</strong> probably through <strong>the</strong> expansive wetl<strong>and</strong> that separated <strong>the</strong><br />
lake from <strong>the</strong> river elsewhere. In <strong>the</strong> early 1900s, a railroad<br />
dike was constructed across <strong>the</strong> northwestern margin <strong>of</strong> <strong>the</strong><br />
Lower <strong>Klamath</strong> Lake subbasin, cutting <strong>of</strong>f flow between<br />
<strong>the</strong> lake <strong>and</strong> river except at <strong>the</strong> <strong>Klamath</strong> Strait. In 1917, <strong>the</strong><br />
control structure at <strong>the</strong> <strong>Klamath</strong> Strait was closed, cutting<br />
<strong>of</strong>f flow to <strong>the</strong> lake. As a result, Lower <strong>Klamath</strong> Lake is now<br />
largely drained, with much <strong>of</strong> <strong>the</strong> former lake bed <strong>and</strong> fringe<br />
wetl<strong>and</strong>s under cultivation. Areas <strong>of</strong> open water remain in <strong>the</strong><br />
Lower <strong>Klamath</strong> Lake Wildlife Refuge in <strong>the</strong> sou<strong>the</strong>rn part <strong>of</strong><br />
<strong>the</strong> subbasin.<br />
Currently (2007), about 500,000 acres <strong>of</strong> agricultural l<strong>and</strong><br />
are irrigated in <strong>the</strong> upper <strong>Klamath</strong> <strong>Basin</strong>, roughly 190,000 <strong>of</strong><br />
which are included in <strong>the</strong> Bureau <strong>of</strong> Reclamation <strong>Klamath</strong><br />
Project (fig. 3) (Carlson <strong>and</strong> Todd, 2003; Natural Resources<br />
Conservation Service, 2004). This total does not include<br />
wildlife refuge areas within <strong>the</strong> Project.<br />
The upper <strong>Klamath</strong> <strong>Basin</strong> is mostly forested (Loy <strong>and</strong><br />
o<strong>the</strong>rs, 2001). Forest trees in upl<strong>and</strong> areas east <strong>of</strong> <strong>the</strong> Cascade<br />
Range are predominantly ponderosa pine, with areas <strong>of</strong> true fir<br />
<strong>and</strong> Douglas fir on Yamsay <strong>and</strong> Gearhart Mountains. Forests<br />
in <strong>the</strong> Cascade Range are composed primarily <strong>of</strong> mountain<br />
hemlock <strong>and</strong> red fir. Lower elevation upl<strong>and</strong>s are dominated<br />
by lodgepole pine. Lowl<strong>and</strong> forests consist largely <strong>of</strong> juniper<br />
<strong>and</strong> sagebrush with some juniper grassl<strong>and</strong>s. Stream valleys<br />
<strong>and</strong> <strong>the</strong> broad, sediment-filled structural basins generally<br />
have extensive marshes, such as Sycan Marsh <strong>and</strong> <strong>Klamath</strong><br />
Marsh, except at lower elevations, where <strong>the</strong> basins have been<br />
mostly converted to agricultural l<strong>and</strong> (for example, <strong>the</strong> Wood<br />
River Valley, <strong>and</strong> <strong>the</strong> Lower <strong>Klamath</strong> Lake <strong>and</strong> Tule Lake<br />
subbasins).<br />
The population <strong>of</strong> <strong>the</strong> upper <strong>Klamath</strong> <strong>Basin</strong> is<br />
approximately 70,000. <strong>Klamath</strong> County, most <strong>of</strong> which is in<br />
<strong>the</strong> upper <strong>Klamath</strong> <strong>Basin</strong>, had a population <strong>of</strong> 64,600 in 2003,<br />
most <strong>of</strong> which live in <strong>the</strong> <strong>Klamath</strong> Falls area (<strong>Oregon</strong> Blue<br />
Book, 2006). Few people live outside <strong>Klamath</strong> County in <strong>the</strong><br />
<strong>Oregon</strong> part <strong>of</strong> <strong>the</strong> basin. The population in <strong>the</strong> California part<br />
<strong>of</strong> <strong>the</strong> upper <strong>Klamath</strong> <strong>Basin</strong> is difficult to estimate. Population<br />
in <strong>the</strong> block groups from <strong>the</strong> 2000 census that include <strong>the</strong><br />
populated parts <strong>of</strong> Modoc <strong>and</strong> Siskiyou Counties in <strong>the</strong> basin<br />
is slightly more than 3,000. Some small settlements <strong>and</strong><br />
ranches may not be included in <strong>the</strong>se block groups.<br />
Principal sectors <strong>of</strong> <strong>the</strong> economy in <strong>the</strong> upper <strong>Klamath</strong><br />
<strong>Basin</strong>, in terms <strong>of</strong> output <strong>and</strong> employment, include forest<br />
products, agriculture, construction, retail, health care, <strong>and</strong><br />
services (Weber <strong>and</strong> Sorte, 2003). In <strong>the</strong> agricultural sector,<br />
principal crops include (in approximate order, with largest<br />
acreages first) alfalfa hay, irrigated pasture, grains, <strong>and</strong><br />
potatoes (Carlson <strong>and</strong> Todd, 2003; Siskiyou County, 2003).<br />
The proportions vary slightly between l<strong>and</strong> inside <strong>and</strong> outside<br />
<strong>the</strong> Bureau <strong>of</strong> Reclamation <strong>Klamath</strong> Project, <strong>and</strong> between l<strong>and</strong><br />
in <strong>Oregon</strong> <strong>and</strong> California. Project l<strong>and</strong>s in California tend to<br />
include more grains than alfalfa. Most agricultural l<strong>and</strong> in <strong>the</strong><br />
upper <strong>Klamath</strong> <strong>Basin</strong> (not including rangel<strong>and</strong>) is irrigated.<br />
A substantial part <strong>of</strong> <strong>the</strong> local economy, <strong>the</strong>refore, relies on<br />
irrigation water.<br />
Irrigation water comes from a variety <strong>of</strong> sources in <strong>the</strong><br />
upper <strong>Klamath</strong> <strong>Basin</strong>. Upstream <strong>of</strong> <strong>Upper</strong> <strong>Klamath</strong> Lake, in<br />
<strong>the</strong> Williamson, Sprague, <strong>and</strong> Wood River drainages, private<br />
(non-Project) irrigation water comes primarily from diversion<br />
<strong>of</strong> surface water from <strong>the</strong> main-stem streams or tributaries.<br />
A smaller amount <strong>of</strong> irrigation water is pumped from ground<br />
water, particularly in <strong>the</strong> Sprague River Valley <strong>and</strong> <strong>Klamath</strong><br />
Marsh areas. In <strong>the</strong> Langell <strong>and</strong> Yonna Valleys <strong>of</strong> <strong>the</strong> upper<br />
Lost River subbasin, irrigation water comes from Clear Lake<br />
<strong>and</strong> Gerber Reservoirs. Irrigators use ground water <strong>and</strong> some<br />
surface water in Swan Lake Valley. <strong>Ground</strong> water is used<br />
for irrigation in areas not served by irrigation districts <strong>and</strong> to<br />
supplement surface-water supplies throughout <strong>the</strong> area.<br />
South <strong>of</strong> <strong>Upper</strong> <strong>Klamath</strong> Lake, most irrigation water<br />
comes from <strong>the</strong> lake, which is <strong>the</strong> largest single source <strong>of</strong><br />
irrigation water in <strong>the</strong> upper <strong>Klamath</strong> <strong>Basin</strong>. This area is <strong>the</strong><br />
main part <strong>of</strong> <strong>the</strong> Bureau <strong>of</strong> Reclamation <strong>Klamath</strong> Project.<br />
<strong>Water</strong> is stored in <strong>and</strong> diverted from <strong>the</strong> lake to irrigate l<strong>and</strong><br />
south <strong>of</strong> <strong>Klamath</strong> Falls, including <strong>the</strong> <strong>Klamath</strong> Valley, Poe<br />
Valley (in <strong>the</strong> Lost River subbasin upstream <strong>of</strong> Olene Gap),<br />
<strong>and</strong> <strong>the</strong> Tule Lake subbasin. Irrigation return flow (water that<br />
originates in <strong>Upper</strong> <strong>Klamath</strong> Lake) that ends up in <strong>the</strong> Tule<br />
Lake Sump is pumped through Sheepy Ridge <strong>and</strong> used for<br />
irrigation <strong>and</strong> refuge use in <strong>the</strong> sou<strong>the</strong>rn part <strong>of</strong> <strong>the</strong> Lower<br />
<strong>Klamath</strong> Lake subbasin. <strong>Water</strong> diverted from <strong>the</strong> <strong>Klamath</strong><br />
River several miles downstream <strong>of</strong> <strong>the</strong> lake also is used for<br />
irrigation <strong>and</strong> refuges in <strong>the</strong> Lower <strong>Klamath</strong> Lake subbasin.<br />
Irrigation <strong>and</strong> refuge return flow in <strong>the</strong> Lower <strong>Klamath</strong> Lake<br />
subbasin is routed back up <strong>the</strong> <strong>Klamath</strong> Strait drain through a<br />
series <strong>of</strong> pumping stations to <strong>the</strong> <strong>Klamath</strong> River.<br />
A certain amount <strong>of</strong> ground water is used for irrigation<br />
on l<strong>and</strong> surrounding <strong>the</strong> <strong>Klamath</strong> Project upslope <strong>of</strong> <strong>the</strong> major<br />
canals. Principal areas <strong>of</strong> ground-water use surrounding <strong>the</strong><br />
Project area include <strong>the</strong> sou<strong>the</strong>rn end <strong>of</strong> <strong>the</strong> <strong>Klamath</strong> Hills,<br />
parts <strong>of</strong> <strong>the</strong> <strong>Klamath</strong> Valley, <strong>and</strong> <strong>the</strong> nor<strong>the</strong>rn <strong>and</strong> eastern<br />
margins <strong>of</strong> <strong>the</strong> Tule Lake subbasin (fig. 1). Some ground<br />
water traditionally has been used for supplemental irrigation<br />
in <strong>the</strong> Project area. Increased water dem<strong>and</strong> due to drought<br />
<strong>and</strong> requirements for a 100,000 acre-ft pilot water bank placed<br />
on Reclamation by <strong>the</strong> National Oceanic <strong>and</strong> Atmospheric<br />
Administration (NOAA) Fisheries 2002 biological opinion<br />
(National Marine Fisheries Service, 2002) have resulted in a<br />
marked increase in ground-water pumping in <strong>and</strong> around <strong>the</strong><br />
<strong>Klamath</strong> Project since 2001.
Introduction<br />
<br />
122°00' 45' 30' 121°15'<br />
Modoc<br />
Point<br />
Sprague<br />
Sprague<br />
River<br />
River<br />
Beatty<br />
Bly Ridge<br />
42°15'<br />
<strong>Upper</strong><br />
<strong>Klamath</strong><br />
Bly<br />
Mt<br />
Lake<br />
Swan Lake Valley<br />
Yainax<br />
Butte<br />
<strong>Klamath</strong> Falls<br />
Dairy<br />
42°00'<br />
Lake<br />
Ewauna<br />
Keno<br />
Keno<br />
Dam<br />
<strong>Klamath</strong><br />
Strait<br />
Worden<br />
KLAMATH<br />
RIVER<br />
Midl<strong>and</strong><br />
Altamont<br />
Olene<br />
Henley<br />
<strong>Klamath</strong> Hills<br />
<strong>Klamath</strong> Valley<br />
Lost River<br />
Diversion<br />
Channel<br />
Merrill<br />
Lost<br />
Malin<br />
River<br />
Bonanza<br />
Bryant Mountain<br />
Lorella<br />
Miller Cr<br />
Langell<br />
Valley<br />
OREGON<br />
CALIFORNIA<br />
Dorris<br />
Butte<br />
Valley<br />
Lower<br />
<strong>Klamath</strong><br />
Lake<br />
Sheepy Ridge<br />
Lost<br />
River<br />
Tule<br />
Lake<br />
Sump<br />
Tulelake<br />
Clear<br />
Lake<br />
Res<br />
41°45'<br />
EXPLANATION<br />
Irrigated area within <strong>the</strong><br />
<strong>Klamath</strong> Project<br />
0 5 10 15 MILES<br />
0 5 10 KILOMETERS<br />
See table <strong>of</strong> contents for mapping sources<br />
Figure 3.<br />
Irrigated areas in <strong>the</strong> Bureau <strong>of</strong> Reclamation <strong>Klamath</strong> Project, <strong>Oregon</strong> <strong>and</strong> California.<br />
OR19-0048_fig03
<strong>Ground</strong>-<strong>Water</strong> <strong>Hydrology</strong> <strong>of</strong> <strong>the</strong> <strong>Upper</strong> <strong>Klamath</strong> <strong>Basin</strong>, <strong>Oregon</strong> <strong>and</strong> California<br />
Purpose <strong>and</strong> Scope<br />
This report summarizes <strong>the</strong> present underst<strong>and</strong>ing <strong>of</strong><br />
regional ground-water flow in <strong>the</strong> upper <strong>Klamath</strong> <strong>Basin</strong><br />
resulting from <strong>the</strong> USGS–OWRD cooperative study. The<br />
report provides a description <strong>of</strong> <strong>the</strong> ground-water hydrology<br />
for resource managers, water users, <strong>and</strong> those with a general<br />
interest. It is also intended to provide sufficient quantitative<br />
information useful to hydrologists working in <strong>the</strong> basin, <strong>and</strong> to<br />
provide background for subsequent reports <strong>and</strong> investigations.<br />
The report is regional in scope. Thus, data <strong>and</strong> analysis<br />
presented herein are intended to provide an underst<strong>and</strong>ing <strong>of</strong><br />
<strong>the</strong> ground-water hydrology at a regional scale. Although <strong>the</strong><br />
information <strong>and</strong> interpretations are useful for underst<strong>and</strong>ing<br />
<strong>the</strong> hydrologic setting <strong>of</strong> smaller areas, <strong>the</strong> ground-water<br />
hydrology <strong>of</strong> local areas is generally not discussed in detail.<br />
The report covers many key aspects <strong>of</strong> <strong>the</strong> regional<br />
ground-water system. A summary <strong>of</strong> <strong>the</strong> geologic framework<br />
<strong>of</strong> <strong>the</strong> regional ground-water system is presented that is<br />
based on existing geologic mapping, field reconnaissance,<br />
radiometric age dates, <strong>and</strong> interpretation <strong>of</strong> lithologic data<br />
from more than 1,000 wells. A regional ground-water<br />
budget (including recharge <strong>and</strong> discharge), calculated<br />
from precipitation data, streamflow data, measured <strong>and</strong><br />
estimated ground-water discharge to streams, <strong>and</strong> estimated<br />
evapotranspiration, also is provided. The distribution <strong>of</strong><br />
hydraulic head, which controls ground-water flow directions,<br />
was estimated from water-level measurements in more than<br />
1,000 wells, altitudes <strong>of</strong> gaining stream reaches, <strong>and</strong> altitudes<br />
<strong>of</strong> hundreds <strong>of</strong> springs mapped on USGS quadrangle maps.<br />
The response <strong>of</strong> <strong>the</strong> flow system to climate variations <strong>and</strong><br />
pumping stresses was determined by using time-series waterlevel<br />
measurements from wells throughout <strong>the</strong> basin, with<br />
frequencies ranging from hours to months <strong>and</strong> periods ranging<br />
from years to decades, <strong>and</strong> from streamflow data.<br />
Geologic Framework<br />
Geologic Controls on <strong>Ground</strong>-<strong>Water</strong> Flow<br />
The principal geologic factors that influence ground<br />
water are <strong>the</strong> porosity <strong>and</strong> permeability <strong>of</strong> <strong>the</strong> rock or<br />
sediment through which it flows. Porosity, in general terms,<br />
is <strong>the</strong> proportion <strong>of</strong> a rock or deposit that consists <strong>of</strong> open<br />
space. In a gravel deposit, this would be <strong>the</strong> proportion <strong>of</strong> <strong>the</strong><br />
volume <strong>of</strong> <strong>the</strong> deposit represented by <strong>the</strong> space between <strong>the</strong><br />
individual pebbles <strong>and</strong> cobbles. Permeability is a term used<br />
to describe <strong>the</strong> ease with which a fluid can move through<br />
a material such as rock or sedimentary deposits. Deposits<br />
with large interconnected open spaces, such as gravel, <strong>of</strong>fer<br />
little resistance to ground-water flow <strong>and</strong> are, <strong>the</strong>refore,<br />
usually highly permeable. Rocks with few, very small, or<br />
poorly connected open spaces <strong>of</strong>fer considerable resistance to<br />
ground-water flow <strong>and</strong>, <strong>the</strong>refore, have low permeability. The<br />
hydraulic characteristics <strong>of</strong> geologic materials vary between<br />
<strong>and</strong> within rock types. For example, in sedimentary deposits<br />
<strong>the</strong> permeability is a function <strong>of</strong> grain size <strong>and</strong> <strong>the</strong> range <strong>of</strong><br />
grain sizes (<strong>the</strong> degree <strong>of</strong> sorting). Coarse, well-sorted gravel<br />
has much higher permeability than well-sorted s<strong>and</strong>. A wellsorted<br />
s<strong>and</strong> or gravel has a higher permeability than a deposit<br />
that is poorly sorted <strong>and</strong> has <strong>the</strong> open spaces between pebbles<br />
or s<strong>and</strong> grains filled with silt or clay. Clay-rich deposits<br />
generally have very low permeability. The permeability <strong>of</strong><br />
lava flows also can vary markedly depending on <strong>the</strong> degree <strong>of</strong><br />
fracturing. The highly fractured, rubbly zones at <strong>the</strong> tops <strong>and</strong><br />
bottoms <strong>of</strong> lava flows <strong>and</strong> in interflow zones are <strong>of</strong>ten highly<br />
permeable, whereas <strong>the</strong> dense interior parts <strong>of</strong> lava flows<br />
can have very low permeability. Wea<strong>the</strong>ring <strong>and</strong> secondary<br />
mineralization, which <strong>of</strong>ten are a function <strong>of</strong> <strong>the</strong> age <strong>of</strong><br />
<strong>the</strong> rock, can strongly influence permeability. Sedimentary<br />
deposits or lava flows in which <strong>the</strong> original open spaces<br />
have been filled with secondary minerals can have very low<br />
permeability.<br />
Geologic properties that influence <strong>the</strong> movement <strong>of</strong><br />
ground water within a flow system also can define <strong>the</strong><br />
boundaries <strong>of</strong> <strong>the</strong> system. Geologic terranes consisting <strong>of</strong><br />
predominantly low-permeability materials can form <strong>the</strong><br />
boundaries <strong>of</strong> a regional flow system.<br />
General Geology<br />
The upper <strong>Klamath</strong> <strong>Basin</strong> has been a region <strong>of</strong> volcanic<br />
activity for at least 35 million yr (years) (Sherrod <strong>and</strong> Smith,<br />
2000), resulting in complex assemblages <strong>of</strong> volcanic vents<br />
<strong>and</strong> lava flows, pyroclastic deposits, <strong>and</strong> volcanically derived<br />
sedimentary deposits. Volcanic <strong>and</strong> tectonic processes have<br />
created many <strong>of</strong> <strong>the</strong> present-day l<strong>and</strong>forms in <strong>the</strong> basin.<br />
Glaciation <strong>and</strong> stream processes have subsequently modified<br />
<strong>the</strong> l<strong>and</strong>scape in many places.<br />
The upper <strong>Klamath</strong> <strong>Basin</strong> lies within two major geologic<br />
provinces, <strong>the</strong> Cascade Range <strong>and</strong> <strong>the</strong> <strong>Basin</strong> <strong>and</strong> Range<br />
Province (Orr <strong>and</strong> o<strong>the</strong>rs, 1992). The processes that have<br />
operated in <strong>the</strong>se provinces have overlapped <strong>and</strong> interacted<br />
in much <strong>of</strong> <strong>the</strong> upper <strong>Klamath</strong> <strong>Basin</strong>. The Cascade Range<br />
is a north-south trending zone <strong>of</strong> compositionally diverse<br />
volcanic eruptive centers <strong>and</strong> <strong>the</strong>ir deposits extending from<br />
nor<strong>the</strong>rn California to sou<strong>the</strong>rn British Columbia. The<br />
Cascade Range is subdivided between an older, highly eroded<br />
Western Cascades, <strong>and</strong> a younger, mostly constructional<br />
High Cascades. Prominent among <strong>the</strong> eruptive centers in <strong>the</strong><br />
High Cascades <strong>of</strong> <strong>the</strong> <strong>Klamath</strong> <strong>Basin</strong> are large composite<br />
<strong>and</strong> shield volcanoes such as Mount Mazama (Crater Lake),<br />
Mount McLoughlin, <strong>and</strong> Medicine Lake Volcano. The<br />
Cascade Range has been impinged on its eastern side by <strong>the</strong><br />
adjacent structurally dominated <strong>Basin</strong> <strong>and</strong> Range Province.<br />
The <strong>Basin</strong> <strong>and</strong> Range Province is a region <strong>of</strong> crustal extension<br />
characterized by subparallel, fault-bounded, down-dropped
Geologic Framework<br />
<br />
basins separated by fault-block ranges. Individual basins <strong>and</strong><br />
intervening ranges are typically 10–20 mi across. The <strong>Basin</strong><br />
<strong>and</strong> Range Province encompasses much <strong>of</strong> <strong>the</strong> interior <strong>of</strong><br />
<strong>the</strong> Western United States, extending from central <strong>Oregon</strong><br />
southward through Nevada <strong>and</strong> western Utah, into <strong>the</strong> sou<strong>the</strong>rn<br />
parts <strong>of</strong> California, Arizona, <strong>and</strong> New Mexico. Although <strong>the</strong><br />
<strong>Basin</strong> <strong>and</strong> Range Province is primarily structural, faulting has<br />
been accompanied by widespread volcanism.<br />
The oldest rocks in <strong>the</strong> upper <strong>Klamath</strong> <strong>Basin</strong> study area<br />
are part <strong>of</strong> <strong>the</strong> Western Cascades subprovince <strong>and</strong> consist<br />
primarily <strong>of</strong> lava flows, <strong>and</strong>esitic mudflows, tuffaceous<br />
sedimentary rocks, <strong>and</strong> vent deposits. The Western Cascade<br />
rocks range in age from 20 to 33 million years (my) <strong>and</strong> are<br />
as much as 20,000 ft thick (Hammond, 1983; Vance, 1984).<br />
Rocks <strong>of</strong> <strong>the</strong> Western Cascades overlie pre-Tertiary rocks <strong>of</strong><br />
<strong>the</strong> <strong>Klamath</strong> Mountains Province, just west <strong>of</strong> <strong>the</strong> study area.<br />
Western Cascades rocks have very low permeability because<br />
<strong>the</strong> tuffaceous materials are mostly devitrified (changed to<br />
clays <strong>and</strong> o<strong>the</strong>r minerals), <strong>and</strong> lava flows are wea<strong>the</strong>red <strong>and</strong><br />
contain abundant secondary minerals. Because <strong>of</strong> <strong>the</strong> low<br />
permeability, ground water does not easily move through<br />
<strong>the</strong> Western Cascades rocks, <strong>and</strong> <strong>the</strong> unit acts as a barrier to<br />
regional ground-water flow. The Western Cascades constitute<br />
part <strong>of</strong> <strong>the</strong> western boundary <strong>of</strong> <strong>the</strong> regional ground-water<br />
flow system. Western Cascade rocks dip toward <strong>the</strong> east <strong>and</strong><br />
underlie <strong>the</strong> High Cascade deposits, <strong>and</strong> define <strong>the</strong> lower<br />
boundary <strong>of</strong> <strong>the</strong> regional flow system throughout that part <strong>of</strong><br />
<strong>the</strong> study area.<br />
The High Cascade subprovince ranges in age from late<br />
Miocene (7 my) to Recent; however, most rocks are Pliocene<br />
(5 my) to Recent in age (Mertzman, 2000). Deposits within<br />
<strong>the</strong> High Cascade subprovince in <strong>the</strong> study area mostly form<br />
constructional features <strong>and</strong> consist <strong>of</strong> volcanic vents <strong>and</strong> lava<br />
flows with relatively minor interbedded volcaniclastic <strong>and</strong><br />
sedimentary deposits. An area <strong>of</strong> numerous late Miocene<br />
to Pliocene cinder cones extends from southwest <strong>of</strong> Butte<br />
Valley to northwest <strong>of</strong> Mt. Mazama (Crater Lake). Quaternary<br />
volcanic deposits are associated with a few volcanic centers<br />
concentrated in two general areas in <strong>the</strong> upper <strong>Klamath</strong><br />
<strong>Basin</strong>: from Lake <strong>of</strong> <strong>the</strong> Woods north to Crater Lake <strong>and</strong><br />
from Mt. Shasta (south <strong>of</strong> <strong>the</strong> study area) east to Medicine<br />
Lake Volcano. The High Cascades rocks are relatively thin in<br />
sou<strong>the</strong>rn <strong>Oregon</strong> <strong>and</strong> nor<strong>the</strong>rn California, typically measured<br />
in hundreds <strong>of</strong> feet thick, ra<strong>the</strong>r than thous<strong>and</strong>s (Stan<br />
Mertzman, Franklin <strong>and</strong> Marshall College, written commun.,<br />
2003). High Cascade rocks unconformably overlie Western<br />
Cascade rocks <strong>and</strong> are very permeable, relative to <strong>the</strong> older<br />
rocks.<br />
<strong>Basin</strong> <strong>and</strong> Range Province deposits in <strong>the</strong> study area<br />
range in age from middle Miocene (13 my) to Recent. The<br />
oldest rocks are middle to late Miocene in age, ranging from<br />
13 to 8 my. These rocks are exposed just south <strong>of</strong> <strong>the</strong> study<br />
area in <strong>the</strong> Pit River <strong>Basin</strong> <strong>and</strong> are equivalent to <strong>the</strong> upper<br />
Cedarville Series <strong>of</strong> Russell (1928). In <strong>the</strong> study area, those<br />
rocks probably underlie <strong>the</strong> Pliocene age lavas south <strong>of</strong> Clear<br />
Lake Reservoir. The older rocks in <strong>the</strong> Pit River <strong>Basin</strong> <strong>and</strong><br />
bounding <strong>the</strong> eastern part <strong>of</strong> <strong>the</strong> study area are mostly silicic<br />
domes, flows, <strong>and</strong> pyroclastic deposits, which generally have<br />
low permeability (California Department <strong>of</strong> <strong>Water</strong> Resources,<br />
1963) <strong>and</strong> typically are faulted <strong>and</strong> tilted.<br />
Late Miocene to Pliocene volcanic rocks <strong>of</strong> <strong>the</strong> <strong>Basin</strong> <strong>and</strong><br />
Range Province are <strong>the</strong> major water bearing rocks in <strong>the</strong> upper<br />
<strong>Klamath</strong> <strong>Basin</strong> study area. These units consist <strong>of</strong> volcanic<br />
vent deposits <strong>and</strong> flow rocks throughout <strong>the</strong> area east <strong>of</strong><br />
<strong>Upper</strong> <strong>Klamath</strong> Lake <strong>and</strong> Lower <strong>Klamath</strong> Lake, <strong>and</strong> probably<br />
underlie most <strong>of</strong> <strong>the</strong> valley- <strong>and</strong> basin-fill deposits in <strong>the</strong> study<br />
area. Late Miocene to Pliocene rocks also form upl<strong>and</strong>s along<br />
<strong>the</strong> eastern boundary <strong>of</strong> <strong>the</strong> study area, <strong>and</strong> form <strong>the</strong> plateau<br />
that extends from <strong>the</strong> Langell Valley south to <strong>the</strong> Pit River.<br />
The rocks are predominately basalt <strong>and</strong> basaltic <strong>and</strong>esite in<br />
composition, but silicic vents <strong>and</strong> lava flows occur locally,<br />
notably in <strong>the</strong> vicinity <strong>of</strong> Beatty, <strong>Oregon</strong>.<br />
Tuff cones <strong>and</strong> tuff rings are <strong>the</strong> predominant volcanic<br />
vent form in <strong>the</strong> Sprague River subbasin between Chiloquin<br />
<strong>and</strong> Sprague River, <strong>Oregon</strong>. Tuff cones <strong>and</strong> rings form when<br />
rising magma comes in contact with water, resulting in<br />
explosive fragmentation <strong>of</strong> <strong>the</strong> volcanic material. The late<br />
Miocene to Pliocene rocks typically exhibit high to very<br />
high permeability. However, <strong>the</strong> permeability locally may<br />
be markedly reduced by secondary mineralization from<br />
hydro<strong>the</strong>rmal alteration.<br />
The volcanic rocks <strong>of</strong> <strong>the</strong> <strong>Basin</strong> <strong>and</strong> Range Province are<br />
interbedded with, <strong>and</strong> locally overlain by, late Miocene to<br />
Pliocene sedimentary rocks. The sedimentary rocks consist <strong>of</strong><br />
tuffaceous s<strong>and</strong>stone, ashy diatomite, mudstone, siltstone, <strong>and</strong><br />
some conglomerates. These units are exposed both in downdropped<br />
basins <strong>and</strong> in up-thrown mountain blocks, indicating<br />
that <strong>the</strong> deposits in part represent an earlier generation <strong>of</strong><br />
sediment-filled basins have been subsequently faulted <strong>and</strong><br />
uplifted. These sedimentary deposits are typically poor water<br />
producers, <strong>and</strong> <strong>of</strong>ten serve as confining layers for underlying<br />
volcanic aquifers.<br />
The youngest stratigraphic unit in <strong>the</strong> upper <strong>Klamath</strong><br />
<strong>Basin</strong> consists <strong>of</strong> late Pliocene to Recent sedimentary deposits.<br />
Those deposits include alluvium along modern flood plains,<br />
basin-fill deposits within active grabens, l<strong>and</strong>slide deposits,<br />
<strong>and</strong> glacial drift <strong>and</strong> outwash. Very thick accumulations<br />
<strong>of</strong> silt, s<strong>and</strong>, clay, <strong>and</strong> diatomite underlie <strong>the</strong> westernmost<br />
basins, such as <strong>the</strong> <strong>Upper</strong> <strong>Klamath</strong> Lake, Lower <strong>Klamath</strong><br />
Lake, Butte Valley, <strong>and</strong> Tule Lake subbasins. For example,<br />
up to 1,740 ft <strong>of</strong> basin-fill sediment underlies <strong>the</strong> town <strong>of</strong><br />
Tulelake, California. Sediment near <strong>the</strong> base <strong>of</strong> <strong>the</strong> deposit at<br />
Tulelake has been assigned an age <strong>of</strong> 3.3 my on <strong>the</strong> basis <strong>of</strong><br />
radiometric ages <strong>of</strong> interbedded tephra, paleomagnetic data,<br />
<strong>and</strong> estimates <strong>of</strong> sedimentation rates (Adam <strong>and</strong> o<strong>the</strong>rs, 1990).<br />
Gravity data suggest that <strong>the</strong> sediment-fill thickness may<br />
exceed 6,000 ft in <strong>the</strong> Lower <strong>Klamath</strong> Lake subbasin <strong>and</strong> may<br />
be in <strong>the</strong> range <strong>of</strong> 1,300 to 4,000 ft in <strong>the</strong> <strong>Upper</strong> <strong>Klamath</strong> Lake<br />
subbasin (Sammel <strong>and</strong> Peterson, 1976; Veen, 1981; Northwest<br />
Geophysical Associates Inc., 2002).
10 <strong>Ground</strong>-<strong>Water</strong> <strong>Hydrology</strong> <strong>of</strong> <strong>the</strong> <strong>Upper</strong> <strong>Klamath</strong> <strong>Basin</strong>, <strong>Oregon</strong> <strong>and</strong> California<br />
Hydrogeologic Units<br />
Hundreds <strong>of</strong> distinct <strong>and</strong> mappable geologic units have<br />
been identified by geologists in <strong>the</strong> upper <strong>Klamath</strong> <strong>Basin</strong>.<br />
Many <strong>of</strong> <strong>the</strong>se geologic units have very similar hydrologic<br />
characteristics. For purposes <strong>of</strong> <strong>the</strong> description <strong>and</strong> analysis<br />
<strong>of</strong> regional ground-water flow, geologic units are typically<br />
combined into a smaller number <strong>of</strong> hydrogeologic units.<br />
Hydrogeologic units consist <strong>of</strong> groupings <strong>of</strong> geologic units<br />
that contain rock types <strong>of</strong> similar hydrologic characteristics<br />
<strong>and</strong> are distinct from o<strong>the</strong>r units. The geology <strong>of</strong> <strong>the</strong> upper<br />
<strong>Klamath</strong> <strong>Basin</strong> is herein generalized into eight hydrogeologic<br />
units (fig. 4 <strong>and</strong> table 1). Pre-Tertiary rocks are not exposed in<br />
outcrops or penetrated by wells in <strong>the</strong> study area <strong>and</strong> are not<br />
discussed.<br />
Early to mid-Tertiary volcanics <strong>and</strong> sediments (Tovs),<br />
<strong>the</strong> oldest hydrogeologic unit in <strong>the</strong> study area, comprises<br />
Miocene <strong>and</strong> older lava <strong>and</strong> volcaniclastic rocks <strong>of</strong> <strong>the</strong><br />
Western Cascade subprovince along <strong>the</strong> western margin <strong>of</strong><br />
<strong>the</strong> study area, as well as older volcanic deposits beneath late<br />
Tertiary lavas along <strong>the</strong> eastern margin. The unit also includes<br />
older rocks exposed in <strong>the</strong> Pit River <strong>Basin</strong> sou<strong>the</strong>ast <strong>of</strong> <strong>the</strong><br />
study area. The permeability <strong>of</strong> this unit is generally low<br />
due to wea<strong>the</strong>ring, hydro<strong>the</strong>rmal alteration, <strong>and</strong> secondary<br />
mineralization. This unit is herein considered a boundary to<br />
<strong>the</strong> regional ground-water system <strong>of</strong> <strong>the</strong> upper <strong>Klamath</strong> <strong>Basin</strong>.<br />
Late Tertiary volcaniclastic deposits (Tvpt) include<br />
palagonitized basaltic ash <strong>and</strong> lapilli deposits associated with<br />
eruptive centers. The hydrologic characteristics <strong>of</strong> this unit<br />
are not well known, but springs emerge from basal contact<br />
with unit Ts. This unit is most prominent in <strong>the</strong> Sprague River<br />
Valley.<br />
Late Tertiary sedimentary rocks (Ts) consist<br />
predominately <strong>of</strong> fine-grained continental sedimentary<br />
deposits that include bedded diatomite, mudstone, siltstone,<br />
<strong>and</strong> s<strong>and</strong>stone. This unit has generally low permeability.<br />
These deposits occur throughout <strong>the</strong> central part <strong>of</strong> <strong>the</strong> upper<br />
<strong>Klamath</strong> <strong>Basin</strong>. They are exposed in upl<strong>and</strong>s in interior parts<br />
<strong>of</strong> <strong>the</strong> basin <strong>and</strong> penetrated by wells in <strong>the</strong> river valleys.<br />
Lithologic logs <strong>of</strong> wells in <strong>the</strong> Sprague River Valley indicate<br />
that <strong>the</strong> thickness <strong>of</strong> <strong>the</strong>se sedimentary deposits <strong>the</strong>re locally<br />
exceeds 1,500 ft.<br />
Late Tertiary volcanic rocks (Tv) consist predominately<br />
<strong>of</strong> basaltic <strong>and</strong> <strong>and</strong>esitic lava flows <strong>and</strong> vent deposits, but<br />
<strong>the</strong> unit includes local silicic domes <strong>and</strong> flows. This unit is<br />
locally affected by hydro<strong>the</strong>rmal alteration <strong>and</strong> secondary<br />
mineralization. This is <strong>the</strong> most geographically extensive<br />
hydrogeologic unit, occurring throughout most <strong>of</strong> <strong>the</strong> upper<br />
<strong>Klamath</strong> <strong>Basin</strong>. The unit has moderate to high permeability<br />
<strong>and</strong> is by far <strong>the</strong> most widely developed aquifer unit in <strong>the</strong><br />
study area.<br />
Quaternary to late Tertiary sedimentary rocks (QTs)<br />
consist <strong>of</strong> medium- to coarse-grained unconsolidated to<br />
moderately indurated sedimentary deposits. The hydraulic<br />
characteristics <strong>of</strong> this unit are not well known, but lithologic<br />
descriptions on maps suggest that it is moderately permeable<br />
at some locations. This unit occurs locally in <strong>the</strong> western<br />
Wood River Valley, south <strong>of</strong> <strong>Klamath</strong> Falls, <strong>and</strong> in <strong>the</strong><br />
uppermost Williamson River subbasin.<br />
Quaternary volcanics (Qv) consist primarily <strong>of</strong> basaltic<br />
<strong>and</strong> <strong>and</strong>esitic lavas <strong>and</strong> vent deposits occurring in <strong>the</strong> Cascade<br />
Range <strong>and</strong> around Medicine Lake Volcano. These materials<br />
are generally highly permeable.<br />
Quaternary volcaniclastic deposits (Qvp) consist<br />
primarily <strong>of</strong> pyroclastic flows <strong>and</strong> air-fall material (pumice<br />
ash <strong>and</strong> lapilli) deposited during <strong>the</strong> climactic eruption <strong>of</strong> Mt.<br />
Mazama that formed <strong>the</strong> caldera encompassing Crater Lake.<br />
This unit is most extensive in <strong>the</strong> Cascade Range around<br />
Crater Lake <strong>and</strong> in <strong>the</strong> upper Williamson River subbasin.<br />
As mapped (fig. 4), <strong>the</strong> unit also includes debris avalanche<br />
deposits in <strong>the</strong> Shasta River Valley outside <strong>of</strong> <strong>the</strong> study area.<br />
Minor Quaternary pyroclastic deposits occur on Medicine<br />
Lake Volcano <strong>and</strong> in Butte Valley. Air-fall deposits are highly<br />
permeable.<br />
Quaternary sediments (Qs) include <strong>the</strong> alluvial deposits<br />
in principal stream valleys, glacial deposits in <strong>the</strong> Cascade<br />
Range, <strong>and</strong> basin-filling sediments in <strong>the</strong> major lake basins.<br />
The basin-filling deposits are generally fine grained <strong>and</strong> have<br />
low permeability. Coarse facies occur at some locations within<br />
<strong>the</strong> basin-filling deposits.<br />
Qs<br />
Qvp<br />
Qv<br />
QTs<br />
Ts<br />
Tvpt<br />
Tv<br />
Tovs<br />
pT<br />
EXPLANATION FOR FIGURE 4<br />
Hydrogeologic unit present at l<strong>and</strong> surface<br />
Quaternary sedimentary deposits<br />
Quaternary volcaniclastic deposits<br />
Quaternary volcanic rocks<br />
Quaternary to late Tertiary sedimentary rocks<br />
Late Tertiary sedimentary rocks<br />
Late Tertiary volcaniclastic rocks<br />
Late Tertiary volcanic rocks<br />
Older Tertiary volcanic <strong>and</strong> sedimentary rocks<br />
Pre-Tertiary rocks<br />
Geologic fault, dashed where inferred,<br />
dotted where concealed<br />
NOTE: Geology generalized from:<br />
Gay <strong>and</strong> Aune, 1958;<br />
Walker, 1963;<br />
Smith <strong>and</strong> o<strong>the</strong>rs, 1982;<br />
Wagner <strong>and</strong> Saucedo, 1987;<br />
Sherrod, 1991;<br />
MacLeod <strong>and</strong> Sherrod, 1992;<br />
Sherrod <strong>and</strong> Pickthorn, 1992, <strong>and</strong><br />
Sherrod <strong>and</strong> Smith, 2000.
Creek<br />
Creek<br />
Geologic Framework 11<br />
43°15'<br />
43°00'<br />
122°30' 15'<br />
138<br />
DOUGLAS<br />
Diamond<br />
Lake<br />
230<br />
Crater Lake<br />
Crater<br />
Lake<br />
Annie<br />
122°00'<br />
Scott<br />
Creek<br />
S<strong>and</strong><br />
Creek<br />
Sun<br />
138<br />
97<br />
Lenz<br />
45'<br />
Chemult<br />
Big<br />
Springs<br />
Creek<br />
Silver<br />
Jack<br />
Lake<br />
Creek<br />
30'<br />
<strong>Klamath</strong>Rocky<br />
Marsh Ford<br />
Williamson<br />
Road<br />
Sheep<br />
Creek<br />
Long<br />
15'<br />
Creek<br />
Silver<br />
Lake<br />
121°00'<br />
LAKE<br />
Sycan<br />
Marsh<br />
<strong>Upper</strong><br />
<strong>Klamath</strong><br />
<strong>Basin</strong><br />
31<br />
Summer<br />
Lake<br />
OREGON<br />
Winter Ridge<br />
CALIFORNIA<br />
120°<br />
45'<br />
Summer Lake<br />
45'<br />
30'<br />
62<br />
JACKSON<br />
Butte<br />
Falls<br />
Prospect<br />
Mt<br />
McLoughlin<br />
Sevenmile<br />
Rocky<br />
Point<br />
Creek<br />
Creek<br />
Wood<br />
River<br />
Creek<br />
<strong>Upper</strong><br />
Fort<br />
<strong>Klamath</strong><br />
Spring<br />
Creek<br />
Larkin<br />
Creek<br />
<strong>Klamath</strong><br />
Agency<br />
62<br />
Agency<br />
Lake<br />
<strong>Klamath</strong><br />
Kirk<br />
Chiloquin<br />
Chiloquin Narrows<br />
Modoc<br />
Point<br />
KLAMATH<br />
Sprague<br />
Trout Cr<br />
River<br />
Taylor<br />
Butte<br />
Sprague<br />
River<br />
River<br />
Whisky<br />
Creek<br />
Sycan<br />
Torrent<br />
Spring<br />
River<br />
Beatty<br />
Brown<br />
Creek<br />
Fivemile<br />
Creek<br />
Meryl<br />
N<br />
Bly<br />
Creek<br />
S Fork<br />
River<br />
Sprague<br />
River<br />
Sprague<br />
Gearhart Mountain<br />
15'<br />
42°00'<br />
66<br />
Camp Cr<br />
Scotch Cr<br />
Dry Cr<br />
Mill Cr<br />
Jenny<br />
Cr<br />
Fall<br />
Cr<br />
<strong>Klamath</strong><br />
Iron<br />
Gate<br />
Res<br />
Pinehurst<br />
Bogus<br />
Copco<br />
Lake<br />
Spencer<br />
Edge Cr<br />
Shovel<br />
Cr<br />
Creek<br />
River<br />
Lake<br />
<strong>of</strong> <strong>the</strong><br />
Woods<br />
John C. Boyle<br />
Reservoir<br />
140<br />
Keno<br />
<strong>Klamath</strong><br />
Strait<br />
Dorris<br />
Butte<br />
Valley<br />
Lake<br />
66<br />
Dairy<br />
<strong>Klamath</strong> Falls<br />
Lake Ewauna<br />
Lower<br />
<strong>Klamath</strong><br />
Lake<br />
Poe Valley<br />
Lost River<br />
Diversion<br />
Channel<br />
Merrill<br />
Olene<br />
Lost<br />
River<br />
Lost<br />
Tule<br />
Lake<br />
Sump<br />
70<br />
Malin<br />
River<br />
Tulelake<br />
Bonanza<br />
Lorella<br />
Langell<br />
Valley<br />
Miller Cr<br />
Clear<br />
Lake<br />
Res<br />
Gerber<br />
Reservoir<br />
Willow<br />
Boles<br />
Cr<br />
140<br />
Coleman Rim<br />
Cr<br />
45'<br />
Shasta River<br />
Little<br />
Shasta<br />
River<br />
97<br />
Butte<br />
SISKIYOU<br />
Medicine<br />
Lake<br />
Volcano<br />
MODOC<br />
139<br />
41°30'<br />
5<br />
Whitney<br />
Creek<br />
Scale 1:1,000,000<br />
5 0 5 10 15 20 MILES<br />
5 0 5 10 15 20 KILOMETERS<br />
299<br />
See table <strong>of</strong> contents for mapping sources<br />
Figure 4.<br />
Hydrogeologic units <strong>of</strong> <strong>the</strong> upper <strong>Klamath</strong> <strong>Basin</strong>, <strong>Oregon</strong> <strong>and</strong> California.<br />
OR19-0048_fig04a
12 <strong>Ground</strong>-<strong>Water</strong> <strong>Hydrology</strong> <strong>of</strong> <strong>the</strong> <strong>Upper</strong> <strong>Klamath</strong> <strong>Basin</strong>, <strong>Oregon</strong> <strong>and</strong> California<br />
Table 1.<br />
Generalized hydrogeologic units in <strong>the</strong> upper <strong>Klamath</strong> <strong>Basin</strong>, <strong>Oregon</strong> <strong>and</strong> California.<br />
Hydrogeologic unit Map symbol Lithologic <strong>and</strong> hydrologic characteristics<br />
Quaternary<br />
sedimentary<br />
deposits<br />
Quaternary<br />
volcaniclastic<br />
deposits<br />
Quaternary volcanic<br />
rocks<br />
Quaternary to<br />
late Tertiary<br />
sedimentary rocks<br />
Late Tertiary<br />
sedimentary rocks<br />
Late Tertiary<br />
volcaniclastic<br />
rocks<br />
Late Tertiary<br />
volcanic rocks<br />
Older Tertiary<br />
volcanic <strong>and</strong><br />
sedimentary rocks<br />
Qs<br />
Qvp<br />
Qv<br />
QTs<br />
Ts<br />
Tvpt<br />
Tv<br />
Tovs<br />
Fine- to coarse-grained sediments deposited in stream valleys <strong>and</strong> major lake basins. Permeable coarsegrained<br />
deposits occur in stream valleys <strong>and</strong> locally in <strong>the</strong> lake basins. The lake basin deposits are,<br />
however, predominantly fine grained <strong>and</strong> have low permeability.<br />
Pyroclastic flows <strong>and</strong> air fall material (pumice, ash, <strong>and</strong> lapilli) deposited during <strong>the</strong> climactic eruption<br />
<strong>of</strong> Mt. Mazama that formed Crater Lake, <strong>and</strong> debris avalanche deposits <strong>of</strong> <strong>the</strong> Shasta River Valley. Air<br />
fall deposits are highly permeable. Pyroclastic flows <strong>and</strong> debris deposits may have low permeability.<br />
Basaltic <strong>and</strong> <strong>and</strong>esitic lavas <strong>and</strong> vent deposits occurring in <strong>the</strong> Cascade Range <strong>and</strong> around Medicine Lake<br />
Volcano. These materials are generally highly permeable, but may not be saturated at high elevations.<br />
Fine- to coarse-grained unconsolidated to moderately indurated sedimentary deposits. The hydraulic<br />
characteristics <strong>of</strong> this unit are not well known but lithologic descriptions on maps suggest it may be<br />
moderately permeable at some locations. This unit has very limited distribution.<br />
Predominately fine-grained continental sedimentary deposits including bedded diatomite, mudstone,<br />
siltstone, <strong>and</strong> s<strong>and</strong>stone. This unit has generally low permeability but contains permeable strata at<br />
some locations.<br />
Palagonitized basaltic ash <strong>and</strong> lapilli deposits associated with eruptive centers. The hydrologic<br />
characteristics <strong>of</strong> this unit are not well known, but springs are known to emerge from basal contact<br />
with unit Ts. This unit is most prominent in <strong>the</strong> Sprague River valley.<br />
Predominantly basaltic <strong>and</strong> <strong>and</strong>esitic lava flows <strong>and</strong> vent deposits with lesser amounts <strong>of</strong> silicic domes<br />
<strong>and</strong> flows. This unit has moderate to high permeability <strong>and</strong> is by far <strong>the</strong> most widely developed aquifer<br />
unit in <strong>the</strong> study area. Permeability is locally diminished by hydro<strong>the</strong>rmal alteration <strong>and</strong> secondary<br />
mineralization.<br />
Miocene <strong>and</strong> older volcanic <strong>and</strong> volcaniclastic deposits. The permeability <strong>of</strong> this unit is generally low<br />
due to wea<strong>the</strong>ring, hydro<strong>the</strong>rmal alteration, <strong>and</strong> secondary mineralization. This unit is generally<br />
considered a boundary to <strong>the</strong> regional ground-water system <strong>of</strong> <strong>the</strong> upper <strong>Klamath</strong> <strong>Basin</strong>.<br />
Effects <strong>of</strong> Geologic Structure<br />
Geologic structures, principally faults <strong>and</strong> fault zones,<br />
can influence ground-water flow. Fault zones can act as ei<strong>the</strong>r<br />
barriers to or conduits for ground-water flow, depending on<br />
<strong>the</strong> material in <strong>and</strong> between <strong>the</strong> individual fault planes. Faults<br />
most commonly affect ground-water flow by juxtaposing rocks<br />
<strong>of</strong> contrasting permeability or by affecting <strong>the</strong> patterns <strong>of</strong><br />
deposition. Structural basins caused by normal faulting, called<br />
grabens, can act as depositional centers for large thicknesses<br />
<strong>of</strong> sediment or lava that may influence regional ground-water<br />
flow. Faults do not always influence ground-water flow; <strong>the</strong>re<br />
are regions in <strong>the</strong> upper <strong>Klamath</strong> <strong>Basin</strong> where ground-water<br />
flow appears unaffected by <strong>the</strong> presence <strong>of</strong> faults.<br />
The area <strong>of</strong> <strong>the</strong> upper <strong>Klamath</strong> <strong>Basin</strong> lying east <strong>of</strong><br />
<strong>the</strong> Cascade Range is a composite graben that forms <strong>the</strong><br />
westernmost structural trough <strong>of</strong> <strong>the</strong> <strong>Basin</strong> <strong>and</strong> Range<br />
physiographic province (Sherrod <strong>and</strong> Pickthorn, 1992). The<br />
predominant fault direction is north-northwest, as shown in<br />
figure 4. According to Sherrod <strong>and</strong> Pickthorn (1992), <strong>of</strong>fset<br />
across <strong>the</strong> faults range from less than 300 ft in <strong>the</strong> central<br />
<strong>and</strong> eastern parts <strong>of</strong> <strong>the</strong> graben to about 6,000 ft on faults<br />
southwest <strong>of</strong> <strong>Klamath</strong> Falls.<br />
Hydraulic Characteristics <strong>of</strong> Regional<br />
Hydrogeologic Units<br />
Geologic materials possess certain hydraulic<br />
characteristics that control <strong>the</strong> movement <strong>and</strong> storage <strong>of</strong><br />
ground water. This section describes <strong>the</strong> basic parameters<br />
used to characterize aquifer hydraulic properties <strong>and</strong> presents<br />
estimates or ranges <strong>of</strong> values <strong>of</strong> those terms for some <strong>of</strong><br />
<strong>the</strong> major geologic units in <strong>the</strong> upper <strong>Klamath</strong> <strong>Basin</strong>. A<br />
more thorough discussion <strong>of</strong> <strong>the</strong> terms used to describe <strong>the</strong><br />
hydraulic characteristics <strong>of</strong> aquifers <strong>and</strong> aquifer materials can<br />
be found in any basic ground-water hydrology text such as<br />
Freeze <strong>and</strong> Cherry (1979), Fetter (1980), or Heath (1983).<br />
The term “permeability” was introduced previously as<br />
a measure <strong>of</strong> <strong>the</strong> ease with which fluid can move through a<br />
particular rock type or deposit. Permeability is an intrinsic<br />
property <strong>of</strong> <strong>the</strong> rock type, <strong>and</strong> is independent <strong>of</strong> <strong>the</strong> fluid<br />
properties. In ground-water studies, <strong>the</strong> term “hydraulic<br />
conductivity” is used more commonly than “permeability” in<br />
quantitative discussions. The hydraulic conductivity includes<br />
both <strong>the</strong> properties <strong>of</strong> <strong>the</strong> rock (<strong>the</strong> intrinsic permeability)<br />
<strong>and</strong> <strong>the</strong> properties <strong>of</strong> <strong>the</strong> water, such as viscosity <strong>and</strong> density.
Geologic Framework 13<br />
Hydraulic conductivity is generally defined as <strong>the</strong> volume <strong>of</strong><br />
water per unit time that will pass through a unit area <strong>of</strong> an<br />
aquifer material in response to a unit hydraulic head gradient.<br />
Hydraulic conductivity has <strong>the</strong> units <strong>of</strong> volume per unit time<br />
(such as cubic feet per day) per unit area (such as square feet),<br />
which simplifies by division to length per unit time (such<br />
as feet per day). Hydraulic conductivity values for aquifer<br />
materials commonly span several orders <strong>of</strong> magnitude from<br />
less than 0.1 ft/d for fine s<strong>and</strong> <strong>and</strong> silt to over 1,000 ft/d for<br />
well-sorted s<strong>and</strong> <strong>and</strong> gravel.<br />
When discussing aquifers instead <strong>of</strong> rock types,<br />
<strong>the</strong> hydraulic conductivity is multiplied by <strong>the</strong> aquifer<br />
thickness resulting in a parameter known as “transmissivity.”<br />
Transmissivity is defined as <strong>the</strong> volume <strong>of</strong> water per unit time<br />
that will flow through a unit width <strong>of</strong> an aquifer perpendicular<br />
to <strong>the</strong> flow direction in response to a unit hydraulic head<br />
gradient. Transmissivity has units <strong>of</strong> volume per unit time<br />
(such as cubic feet per day) per unit aquifer width (such as<br />
feet), which simplifies to length squared per unit time (such as<br />
feet squared per day [ft 2 /d]).<br />
Storage characteristics <strong>of</strong> an aquifer are described by<br />
a parameter known as <strong>the</strong> “storage coefficient.” The storage<br />
coefficient is defined as <strong>the</strong> volume <strong>of</strong> water an aquifer<br />
releases from, or takes into, storage per unit area <strong>of</strong> aquifer per<br />
unit change in head. The volume <strong>of</strong> water has units <strong>of</strong> length<br />
cubed (such as cubic feet), <strong>the</strong> area has units <strong>of</strong> length squared<br />
(such as square feet), <strong>and</strong> <strong>the</strong> head change has units <strong>of</strong> length<br />
(such as feet). Thus, <strong>the</strong> storage coefficient is dimensionless.<br />
Storage coefficients typically span several orders <strong>of</strong> magnitude<br />
from 10 -4 for aquifers with overlying confining units, to 0.1<br />
for unconfined aquifers. Storage coefficients commonly fall<br />
between <strong>the</strong>se two end members because aquifers <strong>of</strong>ten have<br />
varying degrees <strong>of</strong> confinement. Note that characterizing<br />
an aquifer as “confined” does not imply that it is not<br />
hydraulically connected to o<strong>the</strong>r aquifers or to surface water.<br />
The terms “confined” <strong>and</strong> “unconfined” describe <strong>the</strong> physics<br />
<strong>of</strong> <strong>the</strong> aquifer response to pumping at a particular location.<br />
The hydraulic characteristics <strong>of</strong> subsurface materials<br />
are typically determined by conducting aquifer tests. An<br />
aquifer test consists <strong>of</strong> pumping a well at a constant rate <strong>and</strong><br />
measuring <strong>the</strong> change in water level (<strong>the</strong> drawdown) with time<br />
in <strong>the</strong> pumping well <strong>and</strong> nearby non-pumping wells. The data<br />
collected allow generation <strong>of</strong> a curve showing <strong>the</strong> drawdown<br />
as a function <strong>of</strong> time. Similar data are collected after <strong>the</strong><br />
pumping is stopped, allowing generation <strong>of</strong> a curve showing<br />
<strong>the</strong> water-level recovery as a function <strong>of</strong> time. Analysis <strong>of</strong><br />
<strong>the</strong> drawdown <strong>and</strong> recovery curves in <strong>the</strong> pumped well <strong>and</strong><br />
observation wells provides estimates <strong>of</strong> <strong>the</strong> transmissivity<br />
<strong>and</strong> storage coefficient <strong>of</strong> <strong>the</strong> aquifer. Aquifer characteristics<br />
also can be estimated from certain well-yield tests called<br />
“specific-capacity tests,” sometimes conducted by drillers.<br />
Data from specific capacity tests that include a pumping rate,<br />
test duration, drawdown at <strong>the</strong> end <strong>of</strong> <strong>the</strong> test, <strong>and</strong> <strong>the</strong> well<br />
diameter can be used to estimate aquifer transmissivity.<br />
Aquifer Tests<br />
The results <strong>of</strong> 32 aquifer tests conducted in <strong>the</strong> upper<br />
<strong>Klamath</strong> <strong>Basin</strong> are summarized in table 2. The tests were<br />
conducted by <strong>the</strong> OWRD, <strong>the</strong> California Department <strong>of</strong> <strong>Water</strong><br />
Resources (CDWR), private consultants, <strong>and</strong> <strong>the</strong> USGS.<br />
Pumping periods for <strong>the</strong> tests ranged from 12 hr (hours)<br />
to 169 days, with most lasting 24 to 72 hr. All tests were<br />
conducted on wells with large yields ranging from about<br />
1,000 to 10,000 gal/min. Most tests are <strong>of</strong> wells that produce<br />
from Tertiary volcanic deposits (unit Tv on fig. 4) because it<br />
is <strong>the</strong> most productive <strong>and</strong> widespread water bearing unit. A<br />
smaller number <strong>of</strong> tests were <strong>of</strong> wells producing from Tertiary<br />
sedimentary deposits (unit Ts on fig. 4) or a mixture <strong>of</strong> Ts <strong>and</strong><br />
Tv. It should be noted that <strong>the</strong> Tertiary sediments are very fine<br />
grained over most <strong>of</strong> <strong>the</strong> basin, <strong>and</strong> that wells producing large<br />
yields from that unit occur only in specific locations.<br />
Data <strong>and</strong> details <strong>of</strong> <strong>the</strong> analyses for most <strong>of</strong> <strong>the</strong> tests<br />
are available from sources listed in table 2. Reanalysis <strong>of</strong> <strong>the</strong><br />
aquifer tests listed in table 2 was beyond <strong>the</strong> scope <strong>of</strong> this<br />
study. For <strong>the</strong> most part, <strong>the</strong> results presented are directly from<br />
<strong>the</strong> source documents, except that values have been rounded<br />
to two significant figures. In some cases, as noted in table 2,<br />
results from certain observation wells or certain analyses that<br />
were considered problematic were not included. For example,<br />
anomalous results from observation wells that were open to<br />
different water-bearing zones or constructed differently from<br />
<strong>the</strong> pumped well were excluded. Results from pumped wells<br />
were excluded where well loss (excessive drawdown due to<br />
well inefficiency) appeared to affect <strong>the</strong> results.<br />
Most aquifer tests show evidence <strong>of</strong> boundaries,<br />
complicated aquifer geometry, or possible double-porosity<br />
conditions where flow occurs in fractures <strong>and</strong> in <strong>the</strong> blocks<br />
between fractures. Many tests in Butte Valley <strong>and</strong> <strong>the</strong> Tule<br />
Lake, Lower <strong>Klamath</strong> Lake, Sprague River, <strong>and</strong> upper Lost<br />
River subbasins showed inflections in drawdown curves,<br />
suggesting <strong>the</strong> presence <strong>of</strong> no-flow boundaries. These no-flow<br />
boundaries were in some cases associated with faults. Such<br />
boundaries indicate that <strong>the</strong> Tertiary volcanic aquifer system<br />
is, at least locally, somewhat compartmentalized, with some<br />
resistance to flow between individual subregions. Some tests<br />
showed evidence <strong>of</strong> recharge boundaries. Recharge boundaries<br />
usually indicate that <strong>the</strong> cone <strong>of</strong> depression has exp<strong>and</strong>ed<br />
to an extent where it has intersected a source <strong>of</strong> recharge,<br />
for example a stream or canal. Given <strong>the</strong> stratigraphy <strong>of</strong> <strong>the</strong><br />
areas tested, <strong>the</strong> pumping more likely was inducing flow<br />
from <strong>the</strong> overlying low-permeability sediments. Tests that<br />
showed evidence <strong>of</strong> recharge boundaries or leaking confining<br />
layers occurred in <strong>the</strong> Lower <strong>Klamath</strong> Lake <strong>and</strong> Lost River<br />
subbasins. Inflections in drawdown curves can also be caused<br />
by double porosity conditions (Moench, 1984; Weeks, 2005).
14 <strong>Ground</strong>-<strong>Water</strong> <strong>Hydrology</strong> <strong>of</strong> <strong>the</strong> <strong>Upper</strong> <strong>Klamath</strong> <strong>Basin</strong>, <strong>Oregon</strong> <strong>and</strong> California<br />
Table 2. Summary <strong>of</strong> selected aquifer tests, upper <strong>Klamath</strong> <strong>Basin</strong>, <strong>Oregon</strong> <strong>and</strong> California.<br />
[SWL, datum <strong>and</strong> date not always available. Static level listed to provide information on saturated thickness open to well. Open interval, may be a composite <strong>of</strong> multiple open intervals. Aquifer unit, Aquifer<br />
unit descriptions in figure 4. Observation wells, includes only number <strong>of</strong> observation wells used in analysis. Transmissivity, Reported values rounded to two significant figures. Abbreviations: SWL, static<br />
water level; gal/min, gallons per minute; gpd/ft, gallons per day per foot; ft 2 /d, feet squared per day; (?), aquifer unit unclear; >, greater than; NA, not available]<br />
Well or test name Well ID Location Area Depth SWL (feet) Open interval Aquifer unit<br />
Discharge<br />
(gal/min)<br />
Test length<br />
(hours)<br />
Drawdown<br />
(feet)<br />
Hill KLAM 2021 36S/11E-35DCC Sprague River subbasin 384 37.16 120–384 Ts 2,378 24 65.06<br />
Vieira KLAM 1962 36S/11E-14DBC Sprague River subbasin 361 -1.22 100.5–361 Tv/Ts 1,455 79 21.95<br />
OIT KLAM 10390 38S/9E-20BAD <strong>Klamath</strong> Falls 1,675 238.6 946–1,675 Ts/Tv(?) 900 48 3.5<br />
City <strong>of</strong> <strong>Klamath</strong> Falls KLAM 12050 38S/9E-28DCB <strong>Klamath</strong> Falls 900 64 190–900 Ts 720 499 10<br />
Angel KLAM 12380 38S/11.5E-2DCB Yonna Valley 583 69.63 31–583 Tv 1,700 24 5<br />
Bonanza KLAM 13427 39S/11E-20AAD Bonanza 567 66.19 20–567 Tv 938 12 55.13<br />
Wright KLAM 13578 39S/12E-31ADD Bonanza 292 15 20–292 Tv 1,430 40 NA<br />
Liston KLAM 13583 39S/12E-32CDB Bonanza 245 43.72 39–245 Tv 940 41 NA<br />
Babson KLAM 51920 39S/12E-10ACA Bonanza >2,056 21 500–>2,056 Tv 6,800 722 274<br />
S. Langell Valley KLAM 10495 40S/13E-35DAA Langell Valley 287 8.47 269–287 Tv 2,034 24 8.32<br />
Lorella KLAM 10175 39S/12E-35AAB Lorella 465 98 171–465 Tv 1,404 24 NA<br />
Poe Valley KLAM 10292 39S/11.5E-26DBA South Poe Valley 292 44.28 39–292 Tv 3,338 24 38.45<br />
Malin KLAM 14821 40S/12E-28DCB Malin 647 202.85 19–647 Tv/Ts 975 12 13.3<br />
Silbernagel/Dark KLAM 10454 40S/12E-32BCB North <strong>of</strong> Malin 629 140 41–629 Tv 1,416 70.5 >16<br />
McVay KLAM 51062 40S/12E-32DCB North <strong>of</strong> Malin 455 142 19–455 Tv 1,290 4,056 17<br />
CDFG 7A CDWR 421225 47N/2W-27BAA Butte Valley 601 21.41 160–610 Tv 2,800 244.5 16<br />
USFWS 12-A Prod. NA 47N/3E17DDD Lower <strong>Klamath</strong> Lake 1,254 28.1 400–1,254 Ts 3,000 48 190.7<br />
USFWS 9-A NA 47N/3E-16BDC Lower <strong>Klamath</strong> Lake 600 23.1 410–600 Tv 6,200 48 23.4<br />
USFWS 9-C NA 47N/3E-16ABA Lower <strong>Klamath</strong> Lake 802 28.7 516–802 Tv/Ts 7,300 26 27.4<br />
USFWS Otey Isl<strong>and</strong> NA 48N/1E-23B Lower <strong>Klamath</strong> Lake 334 26.3 142–334 Tb 6,000 36 17.6<br />
USFWS Otey Isl<strong>and</strong> NA 48N/1E-23B Lower <strong>Klamath</strong> Lake 625 5.3 142–625 Tv 4,000 72 23<br />
USFWS Stearns NA 48N/3E-20BAD Lower <strong>Klamath</strong> Lake 1,478 72.4 300–1,478 Tv 2,500 72 127<br />
TID-1 CDWR 751108 48N/4E-30F02 Tule Lake subbasin 740 19.91 260–700 Tv 9,000 50 11.37<br />
TID-2 CDWR 751109 48N/4E-18J01 Tule Lake subbasin 1,550 34.22 1,260–1,540 Tv 10,500 21 67.65<br />
TID-3 CDWR 751110 48N/4E-16M01 Tule Lake subbasin 1,710 42.17 1,153–1,681 Tv 8,000 33 98.52<br />
TID-4 CDWR 751111 48N/4E-15K01 Tule Lake subbasin 1,440 27.77 1,212–1,433 Tv 9,500 48 82.52<br />
TID-5 CDWR 751112 48N/4E-13K01 Tule Lake subbasin 1,570 29.64 935.2–1,557 Tv 10,500 74 96.94<br />
TID-6 CDWR 751113 48N/5E-16P01 Tule Lake subbasin 2,600 33.85 823–2,358 Tv 4,000 59 92.74<br />
TID-7 CDWR 751114 48N/5E-14R01 Tule Lake subbasin 2,030 50.92 814.3–2,020 Tv 5,000 52 264.59<br />
TID-8 CDWR 751115 48N/5E-26D01 Tule Lake subbasin 1,810 32.32 1,250–1,802 Tv 3,935 27 264.59<br />
TID-9 CDWR 751116 48N/5E-36D01 Tule Lake subbasin 2,060 34.66 1,061–2,023 Tv 6,600 16 173.57<br />
TID-14 CDWR 751117 46N/5E-22D01 Tule Lake subbasin 571 21.4 114–554 Tv 9,500 48 24.43
Geologic Framework 15<br />
Table 2. Summary <strong>of</strong> selected aquifer tests, upper <strong>Klamath</strong> <strong>Basin</strong>, <strong>Oregon</strong> <strong>and</strong> California—Continued.<br />
[SWL, datum <strong>and</strong> date not always available. Static level listed to provide information on saturated thickness open to well. Open interval, may be a composite <strong>of</strong> multiple open intervals. Aquifer unit, Aquifer<br />
unit descriptions in figure 4. Observation wells, includes only number <strong>of</strong> observation wells used in analysis. Transmissivity, Reported values rounded to two significant figures. Abbreviations: SWL, static<br />
water level; gal/min, gallons per minute; gpd/ft, gallons per day per foot; ft 2 /d, feet squared per day; (?), aquifer unit unclear; >, greater than; NA, not available]<br />
Well or test name Well ID<br />
Observation<br />
wells<br />
Transmissivity<br />
(gpd/ft)<br />
Transmissivity (ft 2 /d) Storativity Remarks Source<br />
Hill KLAM 2021 1 190,000–530,000 25,000–71,000 0.002–0.0057 Almy, 1977<br />
Vieira KLAM 1962 5 180,000–560,000 24,000–75,000 0.00026–0.0033 Forcella, 1982<br />
OIT KLAM 10390 5 100,000–280,000 13,000–37,000 0.015–0.00034 1 William E. Nork, Inc, 1992<br />
City <strong>of</strong> <strong>Klamath</strong> Falls KLAM 12050 15 28,000 3,800 0.002 2 Benson <strong>and</strong> o<strong>the</strong>rs, 1984a, 1984b<br />
Angel KLAM 12380 0 2,000,000 270,000 NA Leonard <strong>and</strong> Harris, 1974<br />
Bonanza KLAM 13427 1 140,000–180,000 19,000–24,000 0.000 CH2M Hill, 1992<br />
Wright KLAM 13578 3 130,000 17,000 NA CH2M Hill, 1994<br />
Liston KLAM 13583 1 20,000–91,000 2,700–12,000 NA CH2M Hill, 1994<br />
Babson KLAM 51920 0 480,000–620,000 64,000–83,000 NA CH2M Hill, 2002<br />
S. Langell Valley KLAM 10495 2 4,500,000 600,000 0.000 Grondin, 2004<br />
Lorella KLAM 10175 1 370,000 50,000 0.000 Grondin, 2004<br />
Poe Valley KLAM 10292 1 1,100,000 150,000 0.000 Grondin, 2004<br />
Malin KLAM 14821 0 190,000 25,000 NA CH2M Hill, 1992<br />
Silbernagel/Dark KLAM 10454 2 120,000–200,000 16,000–27,000 0.0003–0.01 Gates, 2001<br />
McVay KLAM 51062 4 200,000 27,000 0.001 Zwart <strong>and</strong> Gates, 2002<br />
CDFG 7A CDWR 421225 7 2,200,000–4,600,000 300,000–610,000 0.001–0.002 California Department <strong>of</strong> <strong>Water</strong><br />
Resources, 1998<br />
USFWS 12-A Prod. NA 1 2,200,000–2,600,000 300,000–350,000 0.00005–0.0001 3 Golder Associates, Inc., 2002<br />
USFWS 9-A NA 1 180,000–440,000 24,000–59,000 0.04 4 Golder Associates, Inc., 2002<br />
USFWS 9-C NA 1 820,000 110,000 0.000 5 Golder Associates, Inc., 2002<br />
USFWS Otey Isl<strong>and</strong> NA 0 3,100,000 420,000 NA 6 Golder Associates, Inc., 2002<br />
USFWS Otey Isl<strong>and</strong> NA 1 3,700,000 500,000 NA WESCORP, 2003<br />
USFWS Stearns NA 0 58,000 7,700 NA 7 WESCORP, 2003<br />
TID-1 CDWR 751108 1 650,000–1,200,000 87,000–160,000 0.15 Eaves <strong>and</strong> o<strong>the</strong>rs, 2002<br />
TID-2 CDWR 751109 1 1,300,000–3,100,000 170,000–410,000 0.001 Eaves <strong>and</strong> o<strong>the</strong>rs, 2002<br />
TID-3 CDWR 751110 0 2,300,000 310,000 NA Eaves <strong>and</strong> o<strong>the</strong>rs, 2002<br />
TID-4 CDWR 751111 0 1,100,000 150,000 NA Eaves <strong>and</strong> o<strong>the</strong>rs, 2002<br />
TID-5 CDWR 751112 1 2,000,000 270,000 0.002 Eaves <strong>and</strong> o<strong>the</strong>rs, 2002<br />
TID-6 CDWR 751113 2 120,000–190,000 16,000–25,000 0.00006–0.00012 Eaves <strong>and</strong> o<strong>the</strong>rs, 2002<br />
TID-7 CDWR 751114 0 51,000 6,800 NA Eaves <strong>and</strong> o<strong>the</strong>rs, 2002<br />
TID-8 CDWR 751115 2 1,700,000–1,900,000 230,000–250,000 0.00001–0.00052 8 Eaves <strong>and</strong> o<strong>the</strong>rs, 2002<br />
TID-9 CDWR 751116 1 700,000–2,900,000 94,000–390,000 0.000 9 Eaves <strong>and</strong> o<strong>the</strong>rs, 2002<br />
TID-14 CDWR 751117 0 2,600,000 350,000 NA Eaves <strong>and</strong> o<strong>the</strong>rs, 2002<br />
Remarks:<br />
1. Results <strong>of</strong> one observation well not included because <strong>of</strong> possible effects <strong>of</strong> upper <strong>Klamath</strong> Lake.<br />
2. 15 observation wells explicitly discussed in report, additional wells used in anaysis, 52 wells were monitored.<br />
Transmissivity value assumes 1,000-foot aquifer thickness. Geo<strong>the</strong>rmal aquifer.<br />
3. Results from one observation well (9A) not included here because <strong>of</strong> differences in well construction <strong>and</strong> depth.<br />
4. Results from one observation well (9C) not included here because <strong>of</strong> differences in well construction <strong>and</strong> depth.<br />
5. Only results from one observation well (9C) included here.<br />
6. Only results <strong>of</strong> drawdown analysis included here.<br />
7. Only results from production well included here.<br />
8. Only results from observation wells presented here.<br />
9. Large range may result from inefficiency <strong>of</strong> production well.
16 <strong>Ground</strong>-<strong>Water</strong> <strong>Hydrology</strong> <strong>of</strong> <strong>the</strong> <strong>Upper</strong> <strong>Klamath</strong> <strong>Basin</strong>, <strong>Oregon</strong> <strong>and</strong> California<br />
Aquifer tests show that <strong>the</strong> transmissivity <strong>of</strong> <strong>the</strong> Tertiary<br />
volcanics (predominantly basaltic lavas) varies widely,<br />
from 2,700 to 610,000 ft 2 /d, with most (<strong>the</strong> middle 50<br />
percent) ranging from 24,000 to 270,000 ft 2 /d. The average<br />
transmissivity is about 170,000 ft 2 /d <strong>and</strong> <strong>the</strong> median is about<br />
90,000 ft 2 /d. Reported storage coefficients from aquifer tests<br />
in <strong>the</strong> Tertiary volcanics range from 0.00001 to 0.15. The 0.15<br />
figure is anomalous <strong>and</strong> likely due to a partially penetrating<br />
observation well <strong>and</strong> leakage from <strong>the</strong> confining layer. The<br />
middle 50 percent <strong>of</strong> <strong>the</strong> calculated storage coefficients in <strong>the</strong><br />
Tertiary volcanics range from 0.00025 to 0.001. The average<br />
value is 0.0012 <strong>and</strong> <strong>the</strong> median is about 0.0005.<br />
Although <strong>the</strong> number <strong>of</strong> aquifer tests in Tertiary<br />
sediments (or mixtures <strong>of</strong> <strong>the</strong> sediments <strong>and</strong> Tertiary lavas)<br />
is small (n=6, not including <strong>the</strong> geo<strong>the</strong>rmal aquifer test), <strong>the</strong>y<br />
provided information on <strong>the</strong> hydraulic characteristics <strong>of</strong> <strong>the</strong><br />
coarse-grained facies <strong>of</strong> unit Ts. Transmissivity values range<br />
from 13,000 to 350,000 ft 2 /d, with most in <strong>the</strong> 25,000 to<br />
75,000 ft 2 /d range. The average value is about 100,000 ft 2 /d<br />
<strong>and</strong> <strong>the</strong> median is 54,000 ft 2 /d. Storage coefficients range<br />
from 0.0005 to 0.015 with most ranging from about 0.0002 to<br />
0.003. Note that most Tertiary sedimentary rock in <strong>the</strong> basin<br />
consists <strong>of</strong> fine-grained lake deposits <strong>and</strong> has much lower<br />
transmissivity than determined from <strong>the</strong> tests discussed here.<br />
In <strong>the</strong> early 1980s, <strong>the</strong> USGS conducted an aquifer test <strong>of</strong><br />
<strong>the</strong> geo<strong>the</strong>rmal aquifer in <strong>Klamath</strong> Falls in collaboration with<br />
<strong>the</strong> Lawrence Berkeley Laboratory <strong>and</strong> <strong>the</strong> City <strong>of</strong> <strong>Klamath</strong><br />
Falls (Benson <strong>and</strong> o<strong>the</strong>rs, 1984a, b). The test consisted <strong>of</strong> four<br />
phases: a 1-week pre-test phase during which background<br />
water levels were monitored; a 21-day pumping phase during<br />
which a geo<strong>the</strong>rmal well (38S/09E-28DCB, KLAM 12050;<br />
table 2) was pumped at about 720 gal/min <strong>and</strong> <strong>the</strong> water<br />
discharged to an irrigation canal; a 30 day injection phase<br />
during which pumping continued (at about 660–695 gal/min)<br />
<strong>and</strong> <strong>the</strong> water injected into a second well (38S/09E-28DDD,<br />
KLAM 11940); <strong>and</strong> a 1-week recovery phase. Benson <strong>and</strong><br />
o<strong>the</strong>rs (1984a) analyzed <strong>the</strong> data from <strong>the</strong> test <strong>and</strong> calculated<br />
a permeability-thickness value (analagous to a transmissivity)<br />
<strong>of</strong> about 1.4 X 10 6 millidarcy-feet. This converts to a<br />
transmissivity <strong>of</strong> about 3,800 ft 2 /d. Analysis <strong>of</strong> <strong>the</strong> test<br />
indicated a storage coefficient <strong>of</strong> about 0.002.<br />
Results <strong>of</strong> <strong>the</strong> geo<strong>the</strong>rmal aquifer test are generally<br />
consistent with <strong>the</strong> o<strong>the</strong>r aquifer tests in table 2. The<br />
transmissivity value is at <strong>the</strong> lower end <strong>of</strong> <strong>the</strong> range <strong>of</strong> o<strong>the</strong>r<br />
tests, but this is not unexpected as <strong>the</strong> aquifer system pumped<br />
consists <strong>of</strong> interlayered lava <strong>and</strong> fine-grained sedimentary rock<br />
(unit Ts). A notable finding <strong>of</strong> this test is <strong>the</strong> apparent lack <strong>of</strong><br />
boundaries encountered in an area crossed by several major<br />
basin-bounding faults. This is not, however, inconsistent with<br />
o<strong>the</strong>r hydrologic data that suggest ground water moves freely<br />
across similar faults at many locations.<br />
Well-Yield Tests<br />
Ano<strong>the</strong>r source <strong>of</strong> information on subsurface hydraulic<br />
characteristics are <strong>the</strong> well-yield tests conducted by drillers<br />
<strong>and</strong> reported on <strong>the</strong> well logs submitted on completion<br />
<strong>of</strong> all new wells. Well-yield tests typically consist <strong>of</strong> a<br />
single drawdown measurement taken after a well has been<br />
pumped at a specified rate for a specified length <strong>of</strong> time,<br />
typically 1 hr. Well-yield tests allow determination <strong>of</strong> a<br />
well’s specific capacity, which can be used to estimate<br />
transmissivity as described previously. Specific capacity<br />
is only a semiquantitative measure <strong>of</strong> well performance in<br />
that it can vary with pumping rate. Specific-capacity values<br />
can be used to calculate only rough estimates <strong>of</strong> <strong>the</strong> aquifer<br />
transmissivity <strong>and</strong> cannot be used to quantitatively derive<br />
aquifer storage characteristics. Although transmissivity values<br />
calculated from specific capacity tests are only approximate,<br />
<strong>the</strong>y can be used to evaluate <strong>the</strong> relative differences in<br />
hydraulic characteristics between different geographic areas<br />
<strong>and</strong> different hydrogeologic units if data are available from a<br />
sufficient number <strong>of</strong> wells.<br />
Specific-capacity data were analyzed from wells that<br />
were field inventoried for this study. Of <strong>the</strong> over 1,000 wells<br />
inventoried, only about 288 had sufficient information for<br />
analysis on <strong>the</strong>ir State water well reports. Transmissivity<br />
values were estimated from specific-capacity data using <strong>the</strong><br />
Theis nonequilibrium equation (Theis, 1935). The wells<br />
analyzed were sorted by hydrogeologic units for comparison.<br />
Most wells analyzed produced from one <strong>of</strong> three units:<br />
Quaternary sedimentary deposits (Qs) (n = 41), Tertiary<br />
sedimentary rocks (Ts) (n = 48), <strong>and</strong> late Tertiary volcanic<br />
deposits (Tv) (n = 173). O<strong>the</strong>r units had too few tests for<br />
statistically meaningful comparisons. The cumulative<br />
frequencies <strong>of</strong> transmissivity estimates for <strong>the</strong> three major<br />
units are shown in figure 5. Wells producing from Quaternary<br />
sedimentary deposits <strong>and</strong> Tertiary sedimentary deposits<br />
have similar transmissivity distributions, with <strong>the</strong> former<br />
having slightly larger values. The median transmissivity<br />
for both units is about 200 ft 2 /d. The frequency distribution<br />
<strong>of</strong> transmissivities for <strong>the</strong> late Tertiary volcanic deposits is<br />
distinct from <strong>the</strong> o<strong>the</strong>r units, with values generally larger<br />
by more than an order <strong>of</strong> magnitude (fig. 5). The median<br />
transmissivity <strong>of</strong> Tertiary volcanic deposits is about<br />
5,800 ft 2 /d.<br />
The median transmissivity for late Tertiary volcanic<br />
deposits determined from specific-capacity tests (6,300 ft 2 /d)<br />
is lower than that calculated from aquifer tests (about<br />
90,000 ft 2 /d). This is not unexpected for <strong>the</strong> following reasons:<br />
First, transmissivity values determined from single-well tests<br />
can be biased downward by excess drawdown in <strong>the</strong> pumped<br />
well due to well inefficiency (see Driscoll, 1986, p. 244).
<strong>Ground</strong>-<strong>Water</strong> <strong>Hydrology</strong> 17<br />
100<br />
90<br />
80<br />
Qs, n = 41<br />
Ts, n = 48<br />
Tv, n = 173<br />
70<br />
PERCENTILE<br />
60<br />
50<br />
40<br />
30<br />
20<br />
10<br />
0<br />
0.1 1 10 100 1,000 10,000 100,000 1,000,000<br />
TRANSMISSIVITY, IN FEET SQUARED PER DAY<br />
Figure 5. Cumulative distribution <strong>of</strong> transmissivity values estimated from specific-capacity tests for wells producing<br />
from Quaternary sediment, Tertiary sedimentary rock, <strong>and</strong> Tertiary volcanic rock in <strong>the</strong> upper <strong>Klamath</strong> <strong>Basin</strong>, <strong>Oregon</strong><br />
<strong>and</strong> California.<br />
Aquifer tests with observation wells are not affected by this<br />
phenomenon. Second, <strong>the</strong> large number <strong>of</strong> specific-capacity<br />
tests (173) represent a more or less r<strong>and</strong>om sampling <strong>of</strong><br />
wells (<strong>and</strong> varying characteristics) in <strong>the</strong> unit. Aquifer tests,<br />
in contrast, are not r<strong>and</strong>om but tend to be conducted most<br />
commonly on high yielding wells for specific purposes.<br />
Regardless, transmissivity values calculated from both aquifer<br />
tests <strong>and</strong> specific-capacity tests are useful for underst<strong>and</strong>ing<br />
<strong>the</strong> hydraulic characteristics <strong>of</strong> hydrogeologic units <strong>and</strong> <strong>the</strong><br />
differences between units.<br />
<strong>Ground</strong>-<strong>Water</strong> <strong>Hydrology</strong><br />
<strong>Ground</strong> water moves from areas where it enters <strong>the</strong><br />
ground, known as “recharge areas,” to areas where it leaves<br />
<strong>the</strong> ground, known as “discharge areas.” On a regional scale,<br />
recharge areas are typically high-elevation regions with large<br />
amounts <strong>of</strong> precipitation compared to surrounding areas.<br />
<strong>Ground</strong> water moves from recharge areas toward low-elevation<br />
areas in response to gravity. In low-elevation areas, ground<br />
water typically discharges to streams, lakes, or wetl<strong>and</strong>s <strong>and</strong><br />
<strong>the</strong>n is returned to <strong>the</strong> atmosphere through evapotranspiration<br />
or leaves <strong>the</strong> basin as streamflow. <strong>Ground</strong> water can be<br />
removed anywhere along its flow path by wells.<br />
<strong>Ground</strong> water moves in response to differences in<br />
hydraulic head, from areas <strong>of</strong> high head to areas <strong>of</strong> low<br />
head. In unconfined aquifers—those without overlying lowpermeability<br />
strata—hydraulic head can be thought <strong>of</strong> as <strong>the</strong><br />
elevation <strong>of</strong> <strong>the</strong> water table. In confined aquifers, hydraulic<br />
head can be thought <strong>of</strong> as <strong>the</strong> elevation <strong>of</strong> <strong>the</strong> aquifer plus <strong>the</strong><br />
pressure <strong>of</strong> <strong>the</strong> confined ground water. Maps <strong>of</strong> hydraulic head<br />
are useful for identifying recharge <strong>and</strong> discharge areas, <strong>and</strong><br />
for indicating <strong>the</strong> direction <strong>of</strong> ground-water flow. Although<br />
<strong>the</strong> regional scale movement <strong>of</strong> ground water largely follows<br />
topography, <strong>the</strong> actual flow paths that <strong>the</strong> ground water<br />
follows <strong>and</strong> <strong>the</strong> rate <strong>of</strong> ground-water movement is controlled<br />
by <strong>the</strong> permeability <strong>of</strong> <strong>the</strong> geologic materials through which<br />
it flows. The rate <strong>of</strong> ground-water movement is proportional<br />
to <strong>the</strong> hydraulic head gradient <strong>and</strong> <strong>the</strong> permeability <strong>of</strong> <strong>the</strong><br />
geologic materials.<br />
<strong>Ground</strong>-water systems are dynamic, with rates <strong>of</strong><br />
recharge <strong>and</strong> discharge <strong>and</strong> hydraulic head varying in<br />
response to external stresses. The largest external influence on<br />
ground-water systems is climate. Drought cycles cause large<br />
fluctuations in recharge, ground-water levels, <strong>and</strong> discharge to<br />
springs <strong>and</strong> streams. Human-caused stresses, such as pumping<br />
<strong>and</strong> artifical recharge from canal leakage <strong>and</strong> deep percolation<br />
<strong>of</strong> irrigation water, also affect <strong>the</strong> ground-water system.<br />
OR19-0048_fig05
18 <strong>Ground</strong>-<strong>Water</strong> <strong>Hydrology</strong> <strong>of</strong> <strong>the</strong> <strong>Upper</strong> <strong>Klamath</strong> <strong>Basin</strong>, <strong>Oregon</strong> <strong>and</strong> California<br />
Hydrologic Budget<br />
The hydrologic budget is <strong>the</strong> accounting <strong>of</strong> water moving<br />
into <strong>and</strong> out <strong>of</strong> a hydrologic system such as <strong>the</strong> upper <strong>Klamath</strong><br />
<strong>Basin</strong>. A general hydrologic-budget equation is:<br />
PRECIP + SW in<br />
+ GW in<br />
= ET + SW out<br />
+ GW out<br />
+ ∆S, (1)<br />
Where<br />
PRECIP is precipitation,<br />
SW in<br />
is <strong>the</strong> inflow <strong>of</strong> surface water,<br />
GW in<br />
is <strong>the</strong> subsurface inflow <strong>of</strong> ground water,<br />
ET is total evapotranspiration,<br />
SW out<br />
is <strong>the</strong> out flow <strong>of</strong> surface water,<br />
GW out<br />
is <strong>the</strong> subsurface outflow <strong>of</strong> ground water, <strong>and</strong><br />
∆S is <strong>the</strong> change in water stored in <strong>the</strong> surface- <strong>and</strong><br />
ground-water systems.<br />
These individual terms may have multiple components.<br />
For example, ET includes <strong>the</strong> evapotranspiration from forests,<br />
wetl<strong>and</strong>s, <strong>and</strong> agricultural crops. In <strong>the</strong> upper <strong>Klamath</strong> <strong>Basin</strong>,<br />
<strong>the</strong> largest terms are PRECIP, ET, <strong>and</strong> SW out<br />
. There is no<br />
evidence <strong>of</strong> subsurface ground-water flow into <strong>the</strong> basin<br />
(GW in<br />
). <strong>Ground</strong>-water flow out (GW out<br />
) toward <strong>the</strong> south is<br />
probable, but <strong>the</strong> amount is likely to be miniscule compared<br />
to o<strong>the</strong>r terms in <strong>the</strong> equation. The storage term (∆S) includes<br />
both surface storage in reservoirs <strong>and</strong> subsurface storage<br />
<strong>of</strong> ground water in aquifers. When dealing with long-term,<br />
multiyear averages, changes in surface water storage are<br />
commonly negligible.<br />
Long-term changes in ground-water storage are manifest<br />
as year-to-year changes in <strong>the</strong> water-table elevation. Longterm<br />
observation well data indicate that a slight, climaterelated<br />
decline has taken place in water levels in wells in <strong>the</strong><br />
<strong>Klamath</strong> <strong>Basin</strong> since <strong>the</strong> 1950s. The magnitude <strong>of</strong> <strong>the</strong> decline<br />
varies spatially, but ranges from zero to about 10 ft over 50<br />
years. Larger declines have been measured near pumping<br />
centers, but are generally geographically restricted. The<br />
amount <strong>of</strong> water represented by <strong>the</strong> annual change in groundwater<br />
storage is small compared to <strong>the</strong> overall hydrologic<br />
budget. For example, assuming <strong>the</strong> change in storage occurred<br />
in <strong>the</strong> shallow, unconfined parts <strong>of</strong> <strong>the</strong> system <strong>and</strong> using<br />
a storage coefficient <strong>of</strong> 0.05 (a reasonable number for an<br />
unconfined volcanic aquifer), a decline <strong>of</strong> 5 ft in 50 years<br />
averaged over <strong>the</strong> entire 8,000 mi 2 upper <strong>Klamath</strong> <strong>Basin</strong><br />
equates to an annual change in storage <strong>of</strong> about 26,000 acre-ft.<br />
Some components <strong>of</strong> a hydrologic budget, such as<br />
streamflow, can be measured directly. O<strong>the</strong>r components,<br />
such as evapotranspiration, are impractical or impossible to<br />
measure directly at useful scales <strong>and</strong> must be estimated or<br />
inferred from o<strong>the</strong>r measurements. This section presents a very<br />
general discussion <strong>of</strong> <strong>the</strong> hydrologic budget <strong>of</strong> <strong>the</strong> entire upper<br />
<strong>Klamath</strong> <strong>Basin</strong> (summarized in table 3) to provide a context<br />
for a more detailed discussion <strong>of</strong> <strong>the</strong> hydrologic budget <strong>of</strong> <strong>the</strong><br />
ground-water system. All figures presented in this section have<br />
associated uncertainty.<br />
Data from <strong>the</strong> <strong>Oregon</strong> Climate Center PRISM Group<br />
(http://www.ocs.oregonstate.edu/prism/index.phtml, accessed<br />
September 20, 2006) indicates that precipitation in <strong>the</strong> upper<br />
<strong>Klamath</strong> <strong>Basin</strong> averages about 10 million acre-ft/yr (1971–<br />
2000 average). Of that amount, only about 1.5 million acreft/yr<br />
flows out <strong>of</strong> <strong>the</strong> basin past Iron Gate Dam (1961–2000<br />
average; 1971–2000 average is 1.6 million acre-ft/yr). Most <strong>of</strong><br />
<strong>the</strong> remaining 8.5 million acre-ft/yr returns to <strong>the</strong> atmosphere<br />
through evapotranspiration at <strong>the</strong> location where <strong>the</strong><br />
precipitation falls. Some <strong>of</strong> <strong>the</strong> 8.5 million acre-ft/yr, however,<br />
returns to <strong>the</strong> atmosphere elsewhere in <strong>the</strong> basin after it has<br />
moved through <strong>the</strong> hydrologic system. An example <strong>of</strong> <strong>the</strong><br />
latter case would be water diverted from streams or pumped<br />
from ground water that returns to <strong>the</strong> atmosphere through<br />
evapotranspiration from irrigated fields (this type <strong>of</strong> loss is<br />
<strong>of</strong>ten termed “consumptive use”). A small amount <strong>of</strong> water is<br />
exported from <strong>the</strong> basin. La Marche (2001) estimated water<br />
exports to <strong>the</strong> Rogue River <strong>Basin</strong> to average 0.027 million<br />
acre-ft/yr between 1960 <strong>and</strong> 1996<br />
Burt <strong>and</strong> Freeman (2003) estimated that<br />
evapotranspiration from agricultural fields in <strong>the</strong> <strong>Klamath</strong><br />
Project in 1999 <strong>and</strong> 2000 averaged 0.48 million acre-ft/yr<br />
(<strong>the</strong> 2001 estimates are not included here because <strong>of</strong> <strong>the</strong><br />
cut <strong>of</strong>f <strong>of</strong> irrigation water that year). Estimates by Cooper<br />
(2004) suggest that average annual agricultural consumptive<br />
use in <strong>the</strong> principal agricultural areas outside <strong>of</strong> <strong>the</strong> <strong>Klamath</strong><br />
Project in <strong>Oregon</strong> (including <strong>the</strong> Williamson, Sprague, <strong>and</strong><br />
Wood River subbasins) totals about 0.2 million acre-ft/yr.<br />
Consumptive use by ground-water irrigated agriculture outside<br />
<strong>of</strong> <strong>the</strong> <strong>Klamath</strong> Project in California (including areas in <strong>the</strong><br />
Tule Lake <strong>and</strong> Butte Valley subbasins) is estimated to be about<br />
0.072 million acre-ft/yr on <strong>the</strong> basis <strong>of</strong> data from <strong>the</strong> CDWR<br />
2000 l<strong>and</strong> use survey. Areas irrigated with surface water in<br />
California outside <strong>of</strong> <strong>the</strong> Project are small in comparison to<br />
ground-water irrigated areas <strong>and</strong> are not included in this total.<br />
There is also significant evapotranspiration from wetl<strong>and</strong>s<br />
<strong>and</strong> open water in <strong>the</strong> upper <strong>Klamath</strong> <strong>Basin</strong>. Hubbard (1970)<br />
estimated that evapotranspiration from open water <strong>and</strong> <strong>the</strong><br />
fringe wetl<strong>and</strong>s <strong>of</strong> <strong>Upper</strong> <strong>Klamath</strong> Lake averaged 0.29 million<br />
acre-ft/yr from 1965 to 1967. Risley <strong>and</strong> Gannett (2006)<br />
estimated that evapotranspiration from <strong>the</strong> Tule Lake <strong>and</strong><br />
Lower <strong>Klamath</strong> Lake refuges totaled about 0.22 million acreft/yr<br />
from 2003 to 2005. Average evapotranspiration in <strong>the</strong><br />
<strong>Klamath</strong> Marsh area was estimated to be about 0.17 million<br />
acre-ft/yr using <strong>the</strong> method <strong>of</strong> Priestly <strong>and</strong> Taylor (1972) (Tim<br />
Mayer, U.S. Fish <strong>and</strong> Wildlife Service, written commun.,<br />
2005). Burt <strong>and</strong> Freeman (2003) estimated evapotranspiration<br />
from o<strong>the</strong>r surfaces in <strong>the</strong> Project area, including open water<br />
outside <strong>of</strong> refuges, urban areas, <strong>and</strong> undeveloped l<strong>and</strong> to<br />
average about 0.082 million acre-ft/yr in 1999 <strong>and</strong> 2000.
<strong>Ground</strong>-<strong>Water</strong> <strong>Hydrology</strong> 19<br />
The source documents listed above all discuss uncertainty <strong>of</strong><br />
<strong>the</strong> evapotranspiration estimates in general terms. Bert <strong>and</strong><br />
Freeman (2003), however, provide a quantitative uncertainty<br />
assessment, <strong>and</strong> assign confidence intervals <strong>of</strong> plus or minus<br />
14 to 20 percent for <strong>the</strong> estimates discussed here. Although<br />
<strong>the</strong> above list <strong>of</strong> evapotranspiration losses, which totals 1.5<br />
million acre-ft/yr, is not exhaustive, it includes <strong>the</strong> bulk <strong>of</strong><br />
consumptive uses in <strong>the</strong> nonupl<strong>and</strong> parts <strong>of</strong> <strong>the</strong> basin. When<br />
this number is added to <strong>the</strong> streamflow out <strong>of</strong> <strong>the</strong> basin, about<br />
7 million acre-ft/yr <strong>of</strong> precipitation (about 70 percent <strong>of</strong> <strong>the</strong><br />
total precipitation) still leaves <strong>the</strong> basin through o<strong>the</strong>r avenues,<br />
principally as evapotranspiration to <strong>the</strong> atmosphere in upl<strong>and</strong><br />
areas.<br />
A substantial proportion <strong>of</strong> <strong>the</strong> roughly 3 million<br />
acre-ft/yr that leaves <strong>the</strong> basin through streamflow or<br />
evapotranspiration in nonupl<strong>and</strong> areas moves through <strong>the</strong><br />
regional ground-water system. Equation 1 describes flow into<br />
<strong>and</strong> out <strong>of</strong> <strong>the</strong> entire upper <strong>Klamath</strong> <strong>Basin</strong>. Most flow into <strong>and</strong><br />
out <strong>of</strong> <strong>the</strong> regional ground-water system occurs entirely within<br />
<strong>the</strong> basin. The hydrologic budget <strong>of</strong> <strong>the</strong> regional ground-water<br />
system can be described by <strong>the</strong> equation:<br />
RECH + GW in<br />
= GW dis<br />
+ GW out<br />
+ ∆S, (2)<br />
where<br />
RECH is ground-water recharge, <strong>and</strong><br />
GW dis<br />
is ground-water discharge.<br />
The largest terms in equation 2 are RECH <strong>and</strong> GW dis<br />
.<br />
Recharge (RECH) includes infiltration <strong>of</strong> precipitation,<br />
leakage from streams <strong>and</strong> canals, <strong>and</strong> deep percolation <strong>of</strong><br />
irrigation water. <strong>Ground</strong>-water discharge (GW dis<br />
) includes<br />
natural discharge <strong>of</strong> ground water to springs <strong>and</strong> streams,<br />
water consumed by plants with <strong>the</strong>ir roots extending to <strong>the</strong><br />
water table, <strong>and</strong> by pumping <strong>of</strong> wells. A schematic depiction<br />
<strong>of</strong> a ground-water flow system is shown in figure 6.<br />
Table 3.<br />
Estimates <strong>of</strong> major hydrologic budget elements <strong>of</strong> <strong>the</strong> upper <strong>Klamath</strong> <strong>Basin</strong>, <strong>Oregon</strong> <strong>and</strong> California.<br />
[ET, evapotranspiration; values in million acre feet per year; PRISM, Parameter-elevation Regressions on Independent Slopes Model (<strong>Oregon</strong> State University,<br />
PRISM Group, 2006); CDWR, California Department <strong>of</strong> <strong>Water</strong> Resources; USFWS, U.S. Fish <strong>and</strong> Wildlife Service; USGS, U.S. Geological Survey]<br />
Budget element Value Source <strong>and</strong> remarks<br />
Inflow<br />
Precipitation 10 1971–2000 average from PRISM<br />
Subsurface inflow unknown Assumed to be negligible<br />
Total inflow 10<br />
Outflow<br />
Subsurface outflow unknown Assumed to be negligible<br />
Surface outflow at Iron Gate Dam 1.5 1961–2004 annual average (USGS gage data)<br />
Net diversions to o<strong>the</strong>r basins .03 1960–1996 annual average from LaMarche (2001). Does not<br />
include diversion to City <strong>of</strong> Yreka from Fall Creek<br />
ET from agricultural l<strong>and</strong>s<br />
Bureau <strong>of</strong> Reclamation <strong>Klamath</strong> .48 1999 <strong>and</strong> 2000 average (Burt <strong>and</strong> Freeman, 2003)<br />
Non-Project l<strong>and</strong> in <strong>Oregon</strong> .20 Cooper (2004)<br />
Non-Project l<strong>and</strong> in California .07 Estimated from CDWR 2000 l<strong>and</strong>-use survey<br />
ET from major wetl<strong>and</strong>s<br />
Tule Lake <strong>and</strong> <strong>Klamath</strong> Refuge (not including open water) .22 2003–05 average (Risley <strong>and</strong> Gannett, 2006)<br />
<strong>Upper</strong> <strong>Klamath</strong> Lake fringe wetl<strong>and</strong>s .29 1965–67 average (Hubbard, 1970)<br />
<strong>Klamath</strong> Marsh .17 Estimated using <strong>the</strong> method <strong>of</strong> Priestly <strong>and</strong> Taylor (1972) (Tim<br />
Mayer, U.S. Fish <strong>and</strong> Wildlife Service, written commun.,<br />
2005)<br />
ET from nonagricultural areas within <strong>the</strong> <strong>Klamath</strong> Project .08 1999 <strong>and</strong> 2000 average (Burt <strong>and</strong> Freeman, 2003)<br />
Subtotal outflow 3.0<br />
Estimated ET from nonagricultural <strong>and</strong> upl<strong>and</strong> areas outside 7.0 Total inflow minus outflow subtotal<br />
<strong>the</strong> Project<br />
Total outflow 10
20 <strong>Ground</strong>-<strong>Water</strong> <strong>Hydrology</strong> <strong>of</strong> <strong>the</strong> <strong>Upper</strong> <strong>Klamath</strong> <strong>Basin</strong>, <strong>Oregon</strong> <strong>and</strong> California<br />
Recharge<br />
from<br />
precipitation<br />
<strong>Water</strong> table<br />
Discharge to stream<br />
(local flow system)<br />
Discharge to spring<br />
Discharge to subirrigation in<br />
areas <strong>of</strong> shallow ground water<br />
Discharge to wells<br />
Recharge from precipitation<br />
<strong>and</strong> deep percolation <strong>of</strong><br />
irrigation water<br />
Discharge to drains<br />
Recharge from<br />
canal leakage<br />
Recharge from<br />
precipitation<br />
Discharge to stream<br />
(regional flow system)<br />
Recharge from precipitation<br />
Intermediate<br />
flow system<br />
Local<br />
flow system<br />
Spring<br />
<strong>Basin</strong> filling sedments<br />
(Low permeability with<br />
some moderate permeability layers)<br />
Shallow local<br />
flow system<br />
<strong>Water</strong> table<br />
Fault<br />
Subsurface flow<br />
from adjacent basins (Recharge)<br />
Regional flow system<br />
Lava with moderate to high permeability<br />
Fault<br />
Fault<br />
Subsurface flow<br />
to adjacent basins<br />
(Discharge)<br />
NOT TO SCALE<br />
RECHARGE = DISCHARGE ± CHANGE IN AQUIFER STORAGE<br />
Figure 6. Schematic representation <strong>of</strong> sources <strong>of</strong> ground-water recharge, flow paths, <strong>and</strong> mechanisms <strong>of</strong> ground-water discharge in<br />
<strong>the</strong> upper <strong>Klamath</strong> <strong>Basin</strong>, <strong>Oregon</strong> <strong>and</strong> California.<br />
<strong>Ground</strong>-<strong>Water</strong> Recharge<br />
<strong>Ground</strong> water originates as precipitation. Recharge is<br />
generally greatest in upl<strong>and</strong> areas where <strong>the</strong> largest amount <strong>of</strong><br />
precipitation occurs. The principal recharge areas in <strong>the</strong> upper<br />
<strong>Klamath</strong> <strong>Basin</strong> are <strong>the</strong> Cascade Range <strong>and</strong> upl<strong>and</strong>s within <strong>and</strong><br />
on <strong>the</strong> eastern margin <strong>of</strong> <strong>the</strong> basin. Only a fraction <strong>of</strong> <strong>the</strong> water<br />
that falls as precipitation, however, makes it to <strong>the</strong> groundwater<br />
system. Most ei<strong>the</strong>r is returned to <strong>the</strong> atmosphere<br />
through evaporation from vegetative surfaces <strong>and</strong> transpiration<br />
by plants, or runs <strong>of</strong>f. In areas where soils <strong>and</strong> underlying<br />
bedrock have low permeability, infiltrating precipitation tends<br />
to flow to streams. Such areas typically have well developed<br />
stream networks. In areas where soils <strong>and</strong> underlying bedrock<br />
are highly permeable, for example <strong>the</strong> young volcanic<br />
l<strong>and</strong>scapes <strong>of</strong> <strong>the</strong> Cascade Range, water infiltrates more easily<br />
to <strong>the</strong> ground-water system. Young volcanic areas <strong>of</strong>ten have<br />
poorly developed stream networks as a result. <strong>Water</strong> that<br />
OR19-0048_fig06.ai<br />
percolates through <strong>the</strong> soil to a depth beneath <strong>the</strong> root zone<br />
potentially can become ground water.<br />
Although direct infiltration <strong>of</strong> precipitation is <strong>the</strong><br />
principal source <strong>of</strong> recharge in <strong>the</strong> upper <strong>Klamath</strong> <strong>Basin</strong>, <strong>the</strong>re<br />
are o<strong>the</strong>r sources. Stream leakage can be a source <strong>of</strong> groundwater<br />
recharge in areas where <strong>the</strong> elevation <strong>of</strong> <strong>the</strong> stream is<br />
higher than <strong>the</strong> water table <strong>and</strong> <strong>the</strong> streambed is permeable.<br />
For example, streams that enter <strong>the</strong> <strong>Klamath</strong> Marsh area<br />
from <strong>the</strong> Cascade Range in <strong>the</strong> nor<strong>the</strong>rn part <strong>of</strong> <strong>the</strong> study<br />
area generally lose much or all <strong>of</strong> <strong>the</strong>ir flow into <strong>the</strong> highly<br />
permeable soil as <strong>the</strong>y flow onto <strong>the</strong> pumice plain. No major<br />
streams in <strong>the</strong> upper <strong>Klamath</strong> <strong>Basin</strong>, however, are known to<br />
lose regionally significant water in this manner, <strong>and</strong> stream<br />
leakage probably is not a substantial source <strong>of</strong> recharge on a<br />
regional scale in <strong>the</strong> basin.<br />
Irrigation activities also can result in artificial groundwater<br />
recharge. Irrigation canals typically lose some<br />
water to <strong>the</strong> shallow parts <strong>of</strong> <strong>the</strong> ground-water system.<br />
No measurements <strong>of</strong> canal leakage rates in <strong>the</strong> upper<br />
<strong>Klamath</strong> <strong>Basin</strong> were available or made during this study,<br />
but measurements exist for o<strong>the</strong>r areas. Canal leakage rates
<strong>Ground</strong>-<strong>Water</strong> <strong>Hydrology</strong> 21<br />
determined from ponding studies range from less than 1<br />
to greater than 20 (ft 3 /s)/mi in <strong>the</strong> upper Deschutes <strong>Basin</strong>,<br />
directly to <strong>the</strong> north <strong>of</strong> <strong>the</strong> <strong>Klamath</strong> <strong>Basin</strong> (Gannett <strong>and</strong> o<strong>the</strong>rs,<br />
2001). The large rates are from unlined canals in fractured<br />
lava. Rates in areas underlain by sedimentary deposits<br />
commonly range from less than 1 to 3 (ft 3 /s)/mi. Canal leakage<br />
rates in <strong>the</strong> Methow Valley <strong>of</strong> Washington range from 1.0<br />
to 10.7 (ft 3 /s)/mi, <strong>and</strong> average 1.8 (ft 3 /s)/mi (Konrad, 2003).<br />
Canal bed materials <strong>the</strong>re include glaci<strong>of</strong>luvial deposits,<br />
colluvium, clay, <strong>and</strong> bedrock. In addition to canal leakage,<br />
water applied to fields can percolate beneath <strong>the</strong> root zone<br />
<strong>and</strong> into <strong>the</strong> shallow parts <strong>of</strong> <strong>the</strong> ground-water system. The<br />
amount <strong>of</strong> deep percolation <strong>of</strong> irrigation water depends on<br />
<strong>the</strong> irrigation method. Gannett <strong>and</strong> o<strong>the</strong>rs (2001) estimated<br />
ground-water recharge from deep percolation <strong>of</strong> irrigation<br />
water in <strong>the</strong> upper Deschutes <strong>Basin</strong> to be about 49,000 acreft/yr,<br />
or about 11 percent <strong>of</strong> <strong>the</strong> estimated water deliveries.<br />
Studies in <strong>the</strong> Amargosa Desert in Nevada resulted in<br />
estimates <strong>of</strong> deep percolation ranging from 8 to 16 percent<br />
<strong>of</strong> applied water (Stonestrom <strong>and</strong> o<strong>the</strong>rs, 2003). No data are<br />
available to determine <strong>the</strong> amount <strong>of</strong> ground-water recharge<br />
from canal leakage <strong>and</strong> deep percolation <strong>of</strong> irrigation water<br />
in <strong>the</strong> upper <strong>Klamath</strong> <strong>Basin</strong>. However, ground-water recharge<br />
from irrigation activities is indicated because <strong>the</strong> water table<br />
in <strong>the</strong> shallow aquifers in <strong>the</strong> Project area rises during <strong>the</strong><br />
irrigation season, <strong>and</strong> 2001 measurements showed <strong>the</strong> shallow<br />
water table declined when irrigation was severely curtailed in<br />
<strong>the</strong> Project area. Moreover, some deep irrigation wells also<br />
respond when canals <strong>of</strong> <strong>the</strong> <strong>Klamath</strong> Project start flowing<br />
in <strong>the</strong> spring (Bill Ehorn, California Department <strong>of</strong> <strong>Water</strong><br />
Resources, written commun., 2002), indicating some recharge<br />
takes place, at least locally, to <strong>the</strong> deeper parts <strong>of</strong> <strong>the</strong> groundwater<br />
system from irrigation-related activities. Most irrigation<br />
in <strong>the</strong> upper <strong>Klamath</strong> <strong>Basin</strong> occurs in alluvial stream valleys<br />
<strong>and</strong> lake basins, <strong>and</strong> <strong>the</strong>se areas are commonly crisscrossed<br />
by drains. Much <strong>of</strong> <strong>the</strong> water recharged to <strong>the</strong> shallow parts <strong>of</strong><br />
ground-water system by irrigation activities likely discharges<br />
to <strong>the</strong> drain system (or streams) after traveling underground<br />
only a short distance (probably less than thous<strong>and</strong>s <strong>of</strong> feet).<br />
Data are insufficient to estimate net regional ground-water<br />
recharge from irrigation activities in <strong>the</strong> upper <strong>Klamath</strong><br />
<strong>Basin</strong>; however, <strong>the</strong> low permeability <strong>of</strong> <strong>the</strong> lake sediments<br />
that underlie most <strong>of</strong> <strong>the</strong> <strong>Klamath</strong> Project area suggests that<br />
ground-water movement from <strong>the</strong> water table in <strong>the</strong> Project<br />
area to <strong>the</strong> deeper, regional ground-water system is somewhat<br />
restricted <strong>and</strong> that canal leakage <strong>and</strong> deep percolation <strong>of</strong><br />
irrigation water probably are not a significant source <strong>of</strong><br />
recharge to <strong>the</strong> regional ground-water system.<br />
<strong>Ground</strong>-water recharge cannot be directly measured<br />
at a regional scale. Regional ground-water recharge can be<br />
estimated, however, by measuring ground-water discharge,<br />
which can be measured or estimated with reasonable accuracy.<br />
Equation 2 shows that ground-water recharge to a system is<br />
equal to <strong>the</strong> discharge plus or minus any changes in storage.<br />
The long-term change in ground-water storage in <strong>the</strong> upper<br />
<strong>Klamath</strong> <strong>Basin</strong> (as indicated by long-term water level data)<br />
is negligible compared to <strong>the</strong> annual ground-water budget,<br />
allowing recharge to be estimated by measuring or estimating<br />
components <strong>of</strong> discharge.<br />
The principal avenues <strong>of</strong> ground-water discharge<br />
in <strong>the</strong> upper <strong>Klamath</strong> <strong>Basin</strong> are discharge to streams,<br />
evapotranspiration by plants with roots that penetrate to <strong>the</strong><br />
water table (in a process known as “subirrigation”), <strong>and</strong><br />
pumping. <strong>Ground</strong>-water discharge to streams is estimated to<br />
average about 1.8 million acre-ft/yr, or about 2,400 ft 3 /s.<br />
<strong>Ground</strong>-water pumping in 2000, prior to <strong>the</strong> rapid<br />
increase starting in 2001, is estimated to have been about 0.15<br />
acre-ft/yr. <strong>Ground</strong>-water discharge through subirrigation in<br />
areas where <strong>the</strong> water table is close to l<strong>and</strong> surface is difficult<br />
to estimate because it <strong>of</strong>ten occurs in wetl<strong>and</strong>s where water<br />
comes from both ground- <strong>and</strong> surface-water sources. Total<br />
evapotranspiration from <strong>Upper</strong> <strong>Klamath</strong> Lake <strong>and</strong> surrounding<br />
wetl<strong>and</strong>s, <strong>the</strong> Tule Lake <strong>and</strong> Lower <strong>Klamath</strong> Lake Refuge<br />
wetl<strong>and</strong>s, <strong>and</strong> <strong>Klamath</strong> Marsh is estimated to be roughly 0.7<br />
million acre-ft/yr (table 3), a large amount <strong>of</strong> this, however, is<br />
supplied by surface water. Therefore, ground-water discharge<br />
through subirrigation is likely small compared to discharge to<br />
streams.<br />
Given that regional-scale long-term changes in groundwater<br />
storage are small, average recharge to <strong>the</strong> regional<br />
ground-water system is assumed to be approximately equal<br />
to <strong>the</strong> estimated ground-water discharge to streams <strong>and</strong> wells<br />
<strong>of</strong> about 2 million acre-ft/yr (rounded up to reflect some<br />
evapotranspiration directly from <strong>the</strong> water table). This figure<br />
does not include recharge from irrigation activities in <strong>the</strong><br />
Project or subsurface discharge to or recharge from adjacent<br />
basins.<br />
<strong>Ground</strong>-water recharge from precipitation, <strong>the</strong>refore,<br />
is about 20 percent <strong>of</strong> <strong>the</strong> total precipitation basinwide. The<br />
exact percentage, however, varies spatially <strong>and</strong> temporally.<br />
Gannett <strong>and</strong> o<strong>the</strong>rs (2001), working with a water-balance<br />
model developed by Boyd (1996), noted that ground-water<br />
recharge in <strong>the</strong> upper Deschutes <strong>Basin</strong> ranges from 5 to 70<br />
percent depending on location. In <strong>the</strong> Cascade Range, where<br />
<strong>the</strong>re is a large amount <strong>of</strong> precipitation, which far exceeds<br />
potential evapotranspiration, a large percentage enters <strong>the</strong><br />
ground-water system. In contrast, only a small fraction <strong>of</strong> <strong>the</strong><br />
precipitation recharges ground water in <strong>the</strong> very dry interior<br />
parts <strong>of</strong> <strong>the</strong> basin, where precipitation is a fraction <strong>of</strong> <strong>the</strong><br />
potential evapotranspiration. Temporally, recharge varies<br />
seasonally <strong>and</strong> from year to year. Recharge from precipitation<br />
in mountainous areas, like <strong>the</strong> Cascade Range, occurs during<br />
spring snowmelt. Recharge from irrigation occurs during <strong>the</strong><br />
irrigation season. The timing <strong>of</strong> recharge pulses from <strong>the</strong>se<br />
sources can be seen in water level data from wells (discussed<br />
later). Recharge will vary from year to year depending on<br />
<strong>the</strong> annual precipitation. Estimated basinwide recharge in <strong>the</strong><br />
upper Deschutes <strong>Basin</strong> ranged from less than 3 in/yr during<br />
<strong>the</strong> drought years <strong>of</strong> 1977 <strong>and</strong> 1994 to more than 20 in/yr in<br />
1982 (Gannett <strong>and</strong> o<strong>the</strong>rs, 2001).
22 <strong>Ground</strong>-<strong>Water</strong> <strong>Hydrology</strong> <strong>of</strong> <strong>the</strong> <strong>Upper</strong> <strong>Klamath</strong> <strong>Basin</strong>, <strong>Oregon</strong> <strong>and</strong> California<br />
<strong>Ground</strong>-<strong>Water</strong> Discharge to Streams<br />
<strong>Water</strong> flows to streams through a variety <strong>of</strong> mechanisms.<br />
For convenience, streamflow is <strong>of</strong>ten broken into three<br />
components: surface run<strong>of</strong>f, interflow, <strong>and</strong> baseflow. The<br />
surface run<strong>of</strong>f component reaches <strong>the</strong> stream through<br />
overl<strong>and</strong> flow or flow in <strong>the</strong> top <strong>of</strong> <strong>the</strong> soil pr<strong>of</strong>ile. Such<br />
flow is typically rapid, <strong>and</strong> is responsible for <strong>the</strong> rapid rise in<br />
streamflow during <strong>and</strong> immediately after storms or snowmelt.<br />
Interflow, also termed subsurface run<strong>of</strong>f, reaches <strong>the</strong> stream<br />
through flow in unsaturated or temporarily saturated zones<br />
in <strong>the</strong> upper soil layers. Baseflow generally is considered to<br />
be fed by ground-water discharge. Baseflow can originate<br />
from a variety <strong>of</strong> scales <strong>of</strong> ground-water flow, ranging from<br />
short, local flow paths to long <strong>and</strong> deep regional flow paths.<br />
Baseflow generally is <strong>the</strong> source <strong>of</strong> water in streams in <strong>the</strong> late<br />
summer <strong>and</strong> fall, when little or no precipitation or remaining<br />
snow are available to provide surface run<strong>of</strong>f or interflow.<br />
The flow in some streams in <strong>the</strong> upper <strong>Klamath</strong> <strong>Basin</strong><br />
consists entirely <strong>of</strong> ground-water discharge. Such streams<br />
are characterized by consistent year-round flow with little<br />
seasonal variability. An example <strong>of</strong> a typical ground-water-fed<br />
stream is <strong>the</strong> Wood River at Fort <strong>Klamath</strong> (USGS streamgaging<br />
station number 11504000), which during <strong>the</strong> period <strong>of</strong><br />
record from 1913 to 1936 had a mean annual flow <strong>of</strong> 215 ft 3 /s<br />
<strong>and</strong> a st<strong>and</strong>ard deviation <strong>of</strong> daily mean flows <strong>of</strong> only 58 ft 3 /s.<br />
The mean September flow <strong>of</strong> <strong>the</strong> Wood River was 199 ft 3 /s, or<br />
about 93 percent <strong>of</strong> <strong>the</strong> mean annual flow. O<strong>the</strong>r streams, in<br />
contrast, have a relatively small component <strong>of</strong> ground-water<br />
discharge <strong>and</strong> consist predominantly <strong>of</strong> surface run<strong>of</strong>f. Such<br />
streams have large seasonal variability, with high flows during<br />
<strong>and</strong> immediately after rainfall or snowmelt followed by low<br />
or no flow during <strong>the</strong> dry periods <strong>of</strong> <strong>the</strong> year. Stream gaging<br />
data from <strong>the</strong> Sycan River below Snake Creek near Beatty<br />
(station 11499100) provide an example <strong>of</strong> a stream with a<br />
large component <strong>of</strong> surface run<strong>of</strong>f. During <strong>the</strong> period <strong>of</strong> record<br />
from 1973 to 2003 <strong>the</strong> Sycan River at this location had a mean<br />
annual flow <strong>of</strong> 152 ft 3 /s <strong>and</strong> a st<strong>and</strong>ard deviation <strong>of</strong> daily mean<br />
flows <strong>of</strong> 282 ft 3 /s. The mean September flow <strong>of</strong> <strong>the</strong> Sycan<br />
River here is only 23 ft 3 /s, or about 15 percent <strong>of</strong> <strong>the</strong> mean<br />
annual flow. Most streams in <strong>the</strong> <strong>Klamath</strong> <strong>Basin</strong> exhibit all<br />
three components <strong>of</strong> discharge throughout <strong>the</strong> year. Identifying<br />
<strong>the</strong> amount <strong>of</strong> streamflow supplied by ground-water discharge<br />
is problematic during times <strong>of</strong> <strong>the</strong> year when <strong>the</strong>re is<br />
substantial contribution from overl<strong>and</strong> flow <strong>and</strong> interflow.<br />
However, in <strong>the</strong> late summer <strong>and</strong> fall, when <strong>the</strong>re is scant<br />
precipitation <strong>and</strong> snow has melted, streamflow is composed<br />
largely <strong>of</strong> ground-water discharge. Exceptions to this<br />
generalization include streams receiving substantial irrigation<br />
return flow or water from reservoir releases. Where <strong>the</strong>se<br />
exceptions do not occur, or can be accounted for, streamflow<br />
during <strong>the</strong> fall months (September–November) when<br />
precipitation, run<strong>of</strong>f, <strong>and</strong> interflow are nearly absent provides<br />
a good estimate <strong>of</strong> baseflow or ground-water discharge.<br />
The location <strong>and</strong> quantity <strong>of</strong> ground-water discharge<br />
entering <strong>the</strong> stream network was estimated at numerous<br />
locations throughout <strong>the</strong> upper <strong>Klamath</strong> <strong>Basin</strong> (table 6, at<br />
back <strong>of</strong> report). Estimates are, for <strong>the</strong> most part, based on<br />
measurements <strong>of</strong> actual spring discharge or streamflow during<br />
late summer <strong>and</strong> fall. For some spring-dominated streams<br />
(Spring Creek, for example), streamflow over <strong>the</strong> entire year<br />
could have been used to determine ground-water discharge.<br />
However, to maintain consistency in <strong>the</strong> analysis, data from<br />
<strong>the</strong> fall months were used exclusively where possible. Some<br />
<strong>of</strong> <strong>the</strong> ground-water discharge estimates were based on <strong>the</strong><br />
OWRD natural streamflow analysis for <strong>the</strong> <strong>Klamath</strong> <strong>Basin</strong><br />
(Cooper, 2004). These estimates represent <strong>the</strong> median or<br />
typical flow for a particular month over a 30-year base period,<br />
from 1958 to 1997. For this study, <strong>the</strong> work was supplemented<br />
by additional analysis, streamflow measurements, <strong>and</strong><br />
fieldwork performed from 1997 to 2005. When possible, <strong>the</strong><br />
estimate represents <strong>the</strong> typical ground-water discharge for <strong>the</strong><br />
fall over a base period from 1958 to 1987. Selection <strong>of</strong> this<br />
base period is detailed in Cooper (2002). However, sometimes<br />
<strong>the</strong> available data at a location was insufficient to generate an<br />
estimate that represented <strong>the</strong> base period. In those cases, <strong>the</strong><br />
estimate may not reflect <strong>the</strong> long-term average conditions. The<br />
data sources <strong>and</strong> techniques used to estimate ground-water<br />
discharge are listed for each reach in table 6.<br />
Estimates <strong>of</strong> ground-water discharge have inherent<br />
uncertainty. One source <strong>of</strong> uncertainty is <strong>the</strong> streamflow<br />
measurements on which <strong>the</strong>y are based. For example, records<br />
from stream gages are rated “excellent” when 95 percent <strong>of</strong><br />
<strong>the</strong> daily discharge values are within 5 percent <strong>of</strong> <strong>the</strong> true<br />
value, “good” when 95 percent <strong>of</strong> <strong>the</strong> daily discharge values<br />
are within 10 percent <strong>of</strong> <strong>the</strong> true value, <strong>and</strong> “fair” when 95<br />
percent <strong>of</strong> <strong>the</strong> daily discharge values are within 15 percent <strong>of</strong><br />
<strong>the</strong> true value. Some <strong>of</strong> <strong>the</strong> estimates in table 6 are based on<br />
regression models where estimates are derived by comparing<br />
streamgage data that span periods that are short or outside <strong>of</strong><br />
<strong>the</strong> base period, or miscellaneous measurements with longterm<br />
flow data from streams determined to be hydrologically<br />
representative <strong>of</strong> <strong>the</strong> stream in question. Regression models<br />
are ano<strong>the</strong>r source <strong>of</strong> uncertainty. A detailed description <strong>of</strong><br />
<strong>the</strong> regression analyses is available in Cooper (2004). Some<br />
ground-water discharge estimates in table 6 are based on<br />
single measurements or averages <strong>of</strong> multiple measurements<br />
<strong>and</strong> are not shifted to <strong>the</strong> base period. Consequently, <strong>the</strong>re is<br />
uncertainty as to <strong>the</strong> degree to which <strong>the</strong>y represent long-term<br />
average conditions. An assessment <strong>of</strong> <strong>the</strong> level <strong>of</strong> certainty<br />
<strong>of</strong> each estimate is included in table 6, <strong>and</strong> most figures are<br />
rounded to two significant figures. Rates <strong>of</strong> discharge at <strong>the</strong><br />
large spring complexes responsible for most <strong>of</strong> <strong>the</strong> groundwater<br />
discharge in <strong>the</strong> basin are generally well known <strong>and</strong><br />
have <strong>the</strong> least associated uncertainty. Although <strong>the</strong>re may be<br />
uncertainty in <strong>the</strong> estimates <strong>of</strong> long-term average ground water<br />
discharging at certain locations, <strong>the</strong> presence <strong>of</strong> discharge<br />
at <strong>the</strong> listed locations is well established, <strong>and</strong> <strong>the</strong> general<br />
distribution <strong>and</strong> magnitude <strong>of</strong> ground-water discharge in <strong>the</strong><br />
upper <strong>Klamath</strong> <strong>Basin</strong> is well understood.
<strong>Ground</strong>-<strong>Water</strong> <strong>Hydrology</strong> 23<br />
Geographic Distribution <strong>of</strong> <strong>Ground</strong>-<strong>Water</strong><br />
Discharge to Streams<br />
<strong>Ground</strong>-water discharge to major streams was estimated<br />
in five subregions. The subregions were based on <strong>the</strong> USGS<br />
4th field Hydrologic Unit Code (HUC) with fur<strong>the</strong>r analysis<br />
by smaller stream groupings in each subregion, based largely<br />
on 5th field HUCs. The five subregions are (1) Sprague River,<br />
(2) Williamson River, (3) <strong>Upper</strong> <strong>Klamath</strong> Lake, (4) Lost River,<br />
<strong>and</strong> (5) <strong>Klamath</strong> River.<br />
The values in table 6 represent <strong>the</strong> estimated long-term<br />
average ground-water discharge (gains) to all major streams<br />
in <strong>the</strong> stream system, <strong>and</strong> <strong>the</strong>refore reflect most <strong>of</strong> <strong>the</strong><br />
ground-water discharge to <strong>the</strong> streams. Average ground-water<br />
discharge into <strong>the</strong> stream network <strong>of</strong> <strong>the</strong> upper <strong>Klamath</strong> <strong>Basin</strong><br />
(above Iron Gate Dam) totals about 2,400 ft 3 /s (1.8 million<br />
acre-ft/yr). This estimate includes gains to <strong>the</strong> Lost River,<br />
which are at least 195 ft 3 /s, but may be higher due to unknown<br />
gains to <strong>the</strong> river below Lost River Diversion Channel.<br />
<strong>Ground</strong>-water discharge directly to Lower <strong>Klamath</strong> Lake <strong>and</strong><br />
<strong>the</strong> Tule Lake Sump was not estimated due to insufficient data.<br />
<strong>Ground</strong>-water discharge varies from subbasin to subbasin,<br />
reflecting precipitation patterns as well as geologic controls<br />
on ground-water movement (fig. 7). The largest groundwater<br />
discharge areas are in <strong>the</strong> Lower Williamson, Wood<br />
River, <strong>Upper</strong> <strong>Klamath</strong> Lake, <strong>and</strong> <strong>Klamath</strong> River subbasins.<br />
Besides <strong>Upper</strong> <strong>Klamath</strong> Lake <strong>and</strong> parts <strong>of</strong> <strong>the</strong> <strong>Klamath</strong> River<br />
subbasins, <strong>the</strong> specific locations <strong>of</strong> ground-water discharge are<br />
largely known <strong>and</strong> <strong>the</strong> quality <strong>of</strong> <strong>the</strong> estimates is considered<br />
good. Estimates <strong>of</strong> ground-water discharge to marshes have<br />
larger uncertainty due to difficulties with mass balances.<br />
Temporal Fluctuations in <strong>Ground</strong>-<strong>Water</strong><br />
Discharge to Streams<br />
<strong>Ground</strong>-water discharge to streams is not constant, but<br />
fluctuates with time in response to variations in recharge <strong>and</strong>,<br />
in some circumstances, ground-water pumping. In <strong>the</strong> upper<br />
<strong>Klamath</strong> <strong>Basin</strong>, varying recharge is <strong>the</strong> predominant cause<br />
<strong>of</strong> ground-water discharge fluctuations. Recharge varies in<br />
response to seasonal wea<strong>the</strong>r patterns (wet winters versus dry<br />
summers), as well as in response to decadal-scale drought<br />
cycles <strong>and</strong> longer-term climate trends. A graph <strong>of</strong> total annual<br />
precipitation at Crater Lake National Park (fig. 8) shows<br />
<strong>the</strong> year-to-year variations in precipitation <strong>and</strong> longer-term<br />
variations. A useful way to look at long-term climate cycles<br />
is a graph <strong>of</strong> <strong>the</strong> cumulative departure from average (fig. 8).<br />
<strong>Water</strong>-table fluctuations <strong>and</strong> variations in discharge <strong>of</strong>ten<br />
mimic this pattern. The precipitation at Crater Lake over <strong>the</strong><br />
past several decades exhibits <strong>the</strong> pattern observed at o<strong>the</strong>r<br />
precipitation stations throughout <strong>the</strong> region <strong>and</strong> in streamflow<br />
<strong>and</strong> ground-water levels as well. Most notable is <strong>the</strong> dry<br />
period in <strong>the</strong> 1930s <strong>and</strong> early 1940s followed by a wet period<br />
in <strong>the</strong> late 1940s <strong>and</strong> 1950s. The pattern from <strong>the</strong> 1960s to<br />
<strong>the</strong> present is characterized by decadal scale drought cycles<br />
superimposed on an apparent drying trend. Generally dry<br />
periods include 1966 to 1968, 1976 to 1981, 1987 to 1994, <strong>and</strong><br />
2000 to 2005.<br />
The timing <strong>and</strong> magnitude <strong>of</strong> ground-water discharge<br />
fluctuations can vary depending on <strong>the</strong> scale <strong>of</strong> <strong>the</strong> flow<br />
system involved. Small-scale systems with flow paths <strong>of</strong> less<br />
than a few miles <strong>and</strong> catchments <strong>of</strong> 1 to 10 mi 2 , for example<br />
<strong>the</strong> flow system feeding <strong>the</strong> springs at <strong>the</strong> head <strong>of</strong> Annie<br />
Creek near Crater Lake, fluctuate in response to present-year<br />
precipitation. Such features will have large discharge during<br />
wet years <strong>and</strong> small discharge during dry years. In contrast,<br />
large-scale flow systems with flow paths <strong>of</strong> tens <strong>of</strong> miles <strong>and</strong><br />
catchments <strong>of</strong> hundreds <strong>of</strong> square miles, such as <strong>the</strong> lowelevation<br />
regional spring complexes feeding <strong>the</strong> Wood River<br />
or Spring Creek, respond more to longer-term climate signals.<br />
Instead <strong>of</strong> reflecting <strong>the</strong> year-to-year precipitation like small<br />
springs, large-scale systems tend to integrate precipitation over<br />
several years <strong>and</strong> follow a pattern similar to <strong>the</strong> cumulative<br />
departure from average precipitation (fig. 8).<br />
Several techniques were used in this study to determine or<br />
evaluate variations in ground-water discharge. <strong>Ground</strong>-water<br />
discharge fluctuations were in some cases measured directly<br />
by gaging stations on streams that are solely spring fed. Such<br />
data are rare in <strong>the</strong> upper <strong>Klamath</strong> <strong>Basin</strong>. <strong>Ground</strong>-water<br />
discharge fluctuations were calculated in some areas where<br />
two or more gaging stations with overlapping records bracket<br />
a stream reach to which ground-water discharges. These types<br />
<strong>of</strong> data are available for several stream reaches in <strong>the</strong> upper<br />
<strong>Klamath</strong> <strong>Basin</strong>. The analyses in such situations, however,<br />
were complicated by ungaged diversions or tributary inflow.<br />
Information on ground-water discharge fluctuations also was<br />
provided by sets <strong>of</strong> miscellaneous streamflow measurements<br />
along reaches where ground water discharges. Many streams<br />
include surface run<strong>of</strong>f as well as a large component <strong>of</strong> groundwater<br />
discharge. Comparing late summer or fall flows (when<br />
streamflow is commonly composed largely <strong>of</strong> ground-water<br />
discharge) from year to year can provide useful information on<br />
temporal variations in ground-water discharge.<br />
<strong>Ground</strong>-<strong>Water</strong> Discharge to Streams by<br />
Subbasin<br />
Sprague River Subbasin—Geographic Distribution <strong>of</strong><br />
<strong>Ground</strong>-<strong>Water</strong> Discharge<br />
The Sprague River subbasin encompasses <strong>the</strong> entire<br />
drainage above its confluence with <strong>the</strong> Williamson River,<br />
including <strong>the</strong> Sycan River drainage basin (fig. 7). The<br />
subbasin includes many run<strong>of</strong>f-dominated streams in <strong>the</strong><br />
volcanic upper watersheds as wells as isolated springs <strong>and</strong><br />
ground-water-dominated streams in <strong>the</strong> sediment filled valleys<br />
in <strong>the</strong> lower reaches <strong>of</strong> tributaries <strong>and</strong> along <strong>the</strong> main stem.
Creek<br />
24 <strong>Ground</strong>-<strong>Water</strong> <strong>Hydrology</strong> <strong>of</strong> <strong>the</strong> <strong>Upper</strong> <strong>Klamath</strong> <strong>Basin</strong>, <strong>Oregon</strong> <strong>and</strong> California<br />
43°15'<br />
43°00'<br />
45'<br />
30'<br />
15'<br />
42°00'<br />
45'<br />
41°30'<br />
OR19-0048_fig07<br />
122°30' 15'<br />
Camp Cr<br />
Scotch Cr<br />
Dry Cr<br />
138<br />
D O U G L A S<br />
62<br />
Butte<br />
Falls<br />
66<br />
11516530<br />
Prospect<br />
85<br />
Shasta River<br />
5<br />
J A C K S O N<br />
Mt<br />
McLoughlin<br />
Mill Cr<br />
Jenny<br />
Cr<br />
Little<br />
84<br />
Fall<br />
Cr<br />
Copco<br />
Lake<br />
Iron 11512000<br />
Gate<br />
Res<br />
<strong>Klamath</strong><br />
Pinehurst<br />
Shasta<br />
Diamond<br />
Lake<br />
Whitney<br />
Creek<br />
230<br />
Crater Lake<br />
11503000<br />
83<br />
Lake<br />
<strong>of</strong> <strong>the</strong><br />
Woods<br />
Spencer<br />
Edge Cr<br />
River<br />
Crater<br />
Lake<br />
Creek<br />
River<br />
122°00'<br />
Sun<br />
Butte<br />
Creek<br />
Agency<br />
Lake<br />
138<br />
Keno<br />
11509500<br />
11510700 <strong>Klamath</strong><br />
Strait<br />
66<br />
97<br />
Lenz<br />
45'<br />
Chemult<br />
Silver<br />
Lake<br />
Fort 11493500<br />
52 Kirk<br />
<strong>Klamath</strong><br />
59<br />
11504000 Solomon<br />
Crane<br />
Butte<br />
Creek 62 51 47<br />
55 56<br />
Mares<br />
<strong>Klamath</strong>11494000<br />
Whitehorse<br />
Egg<br />
Spring<br />
Agency Spring<br />
11504100<br />
Cherry 58<br />
50 21<br />
11501000 McReady<br />
Creek<br />
62 Chiloquin Spring<br />
63<br />
20<br />
Narrows<br />
Pelican<br />
Chiloquin Kamkaun<br />
Spring<br />
Butte<br />
11502500<br />
Rocky<br />
Point<br />
Modoc<br />
<strong>Upper</strong> Point<br />
11505600<br />
<strong>Klamath</strong> 65<br />
(345 ft 3 /s<br />
net inflow)<br />
140 Lake<br />
Fourmile<br />
Cr<br />
64<br />
Spencer<br />
53<br />
Shovel Cr<br />
Annie<br />
Mount<br />
Thielsen<br />
Sevenmile<br />
Creek<br />
Scott<br />
Creek<br />
S<strong>and</strong><br />
Creek<br />
Cr<br />
Fourmile<br />
Creek<br />
Wood<br />
River<br />
Spring<br />
Creek<br />
11510000<br />
John C. Boyle Keno<br />
Reservoir Dam<br />
85<br />
82<br />
EXPLANATION<br />
Miller<br />
Creek<br />
Sink<br />
Creek<br />
Dorris<br />
Hot<br />
Creek<br />
Larkin<br />
Creek<br />
Cottonwood<br />
Creek<br />
Big<br />
Springs<br />
Creek<br />
Average annual rate <strong>of</strong> ground-water discharge to<br />
shaded stream reaches— In cubic feet per second<br />
per mile. See table 6 for reach number name.<br />
0.05-2.5<br />
2.5-5.0<br />
5.0-10.0<br />
10.0-25.0<br />
25.0-75.0<br />
75.0-200.0 97<br />
End point between adjacent reaches<br />
with <strong>the</strong> same shade color<br />
USGS streamflow gaging station with number<br />
11510700<br />
See table <strong>of</strong> contents for mapping sources<br />
45<br />
54<br />
81<br />
42<br />
43<br />
44<br />
41<br />
Jack<br />
Merrill<br />
Trout Cr<br />
Lower<br />
<strong>Klamath</strong><br />
Lake<br />
Willow<br />
Creek<br />
Creek<br />
40<br />
Wildhorse<br />
Ridge<br />
(50 ft/s<br />
net inflow)<br />
<strong>Klamath</strong> Valley<br />
<strong>Klamath</strong> Hills<br />
<strong>Klamath</strong><br />
Marsh<br />
Lost<br />
River<br />
30'<br />
Williamson<br />
Williamson<br />
Sprague<br />
River<br />
Tule<br />
Lake<br />
Sump<br />
River<br />
Road<br />
K L A M AT H<br />
Sprague<br />
Yonna Valley<br />
Sheepy Ridge<br />
S I S K I Y O U<br />
Sheep<br />
Creek<br />
River<br />
Taylor<br />
Butte<br />
Swan Lake Valley<br />
Dairy<br />
<strong>Klamath</strong> Falls<br />
Lake Ewauna The<br />
75Gap<br />
Olene<br />
Lost River 74<br />
Diversion<br />
Channel<br />
Stukel<br />
Mountain<br />
79<br />
Sheepy<br />
Creek<br />
80 78<br />
77<br />
38<br />
39<br />
11491400<br />
Poe Valley<br />
Jackson<br />
Creek<br />
Rocky<br />
Ford<br />
Wickiup<br />
Spring<br />
River<br />
Whisky<br />
Creek<br />
Bly<br />
Mt<br />
15'<br />
Medicine<br />
139<br />
Lake<br />
Volcano<br />
Scale 1:1,000,000<br />
5 0 5 10 15 20 MILES<br />
70<br />
Lost<br />
Malin<br />
River<br />
Tulelake<br />
Long<br />
Sycan<br />
Knot Tablel<strong>and</strong><br />
15<br />
73<br />
37<br />
32-35<br />
Brown<br />
Spring<br />
16<br />
72<br />
Bonanza<br />
Yamsay<br />
Mountain<br />
Study<br />
Torrent<br />
Spring<br />
70<br />
Spodue<br />
Mountain<br />
71<br />
28<br />
31<br />
5 0 5 10 15 20 KILOMETERS<br />
11499100<br />
Beatty<br />
Brown<br />
Creek<br />
14<br />
24<br />
Bryant Mountain<br />
Lorella<br />
Langell<br />
Valley<br />
Creek<br />
River<br />
11497000<br />
11<br />
Yainax<br />
Butte<br />
Miller Cr<br />
69<br />
Silver<br />
Lake<br />
Fivemile<br />
11497500<br />
area<br />
Sycan<br />
Marsh<br />
Creek<br />
Meryl<br />
Bly Ridge<br />
76<br />
67<br />
8<br />
Clear<br />
Lake<br />
Res<br />
66<br />
(40 ft 3 /s<br />
net inflow)<br />
121°00'<br />
Fork<br />
N<br />
11496500<br />
Bly<br />
Gerber<br />
Reservoir<br />
Willow<br />
<strong>Upper</strong><br />
<strong>Klamath</strong><br />
<strong>Basin</strong><br />
31<br />
Summer<br />
Lake<br />
boundary<br />
L A K E<br />
7<br />
Creek<br />
Fritz<br />
Creek<br />
10<br />
S Fork<br />
68<br />
(10 ft 3 /s<br />
net inflow)<br />
Willow<br />
M O D O C<br />
River<br />
6<br />
Sprague<br />
25<br />
3<br />
Deming<br />
Creek<br />
11495500<br />
Cr<br />
Cr<br />
OREGON<br />
Winter Ridge<br />
2<br />
5<br />
River<br />
Sprague<br />
1<br />
CALIFORNIA<br />
120°<br />
45'<br />
Summer Lake<br />
Barns Rim<br />
140<br />
OREGON<br />
Modoc Plateau<br />
Gearhart<br />
Mountain<br />
Brownsworth<br />
Creek<br />
Coleman Rim<br />
CALIFORNIA<br />
Figure 7. Principal areas <strong>of</strong> ground-water discharge to streams <strong>and</strong> major springs in <strong>the</strong> upper <strong>Klamath</strong> <strong>Basin</strong>, <strong>Oregon</strong> <strong>and</strong> California,<br />
<strong>and</strong> selected stream-gaging stations. Shading along main stem reaches represents ground-water discharge (in cubic feet per second per<br />
mile) averaged along <strong>the</strong> entire shaded reach. The actual location <strong>of</strong> ground-water discharge may be localized. Shading along headwater<br />
streams represents <strong>the</strong> ground-water discharge averaged over <strong>the</strong> shaded reach <strong>and</strong> includes ground-water discharge to tributaries. See<br />
table 6 for detailed descriptions <strong>of</strong> measurement locations.<br />
299<br />
Pit<br />
River
<strong>Ground</strong>-<strong>Water</strong> <strong>Hydrology</strong> 25<br />
TOTAL WATER-YEAR PRECIPITATION, IN INCHES<br />
120<br />
100<br />
80<br />
60<br />
40<br />
20<br />
Average annual<br />
precipitation<br />
66.7 inches<br />
Values estimated<br />
from o<strong>the</strong>r sites<br />
Total water-year precipitation at Crater Lake<br />
Cumulative departure from average precipitation (1932-2005)<br />
120<br />
100<br />
80<br />
60<br />
40<br />
20<br />
0<br />
-20<br />
CUMULATIVE DEPARTURE FROM AVERAGE, IN INCHES<br />
0<br />
1932 1940 1950 1960 1970 1980 1990 2000<br />
-40<br />
2005<br />
WATER YEAR<br />
Figure 8. Annual precipitation at Crater Lake National Park, <strong>Oregon</strong>, <strong>and</strong> <strong>the</strong> cumulative departure from average<br />
precipitation from 1932 to 2005. (Data from Western Regional Climate Center, 2006.)<br />
The Sprague River responds relatively quickly to precipitation<br />
<strong>and</strong> snowmelt events, with peaks commonly exceeding<br />
2,500 ft 3 /s in April or May at <strong>the</strong> gaging station near Chiloquin<br />
(station 11501000). Mean monthly discharge at this location<br />
averages 1,300 ft 3 /s during April <strong>and</strong> 300 ft 3 /s during October.<br />
Major hydrologic features <strong>of</strong> <strong>the</strong> subbasin include <strong>the</strong> North<br />
<strong>and</strong> South Forks <strong>of</strong> <strong>the</strong> Sprague River, <strong>the</strong> Sycan River <strong>and</strong><br />
Marsh, <strong>and</strong> Kamkaun Springs.<br />
The Sprague River originates along <strong>the</strong> flanks <strong>of</strong><br />
Gearheart Mountain <strong>and</strong> Coleman Rim in <strong>the</strong> highl<strong>and</strong>s along<br />
<strong>the</strong> central-eastern edge <strong>of</strong> <strong>the</strong> upper <strong>Klamath</strong> <strong>Basin</strong>. From<br />
<strong>the</strong>se highl<strong>and</strong>s, <strong>the</strong> North <strong>and</strong> South Forks gain water from<br />
numerous tributaries as <strong>the</strong>y flow down mountain canyons<br />
to <strong>the</strong> upper Sprague River Valley, above Beatty Gap. The<br />
hydrologic regimes <strong>of</strong> <strong>the</strong> North <strong>and</strong> South Forks have a<br />
pronounced run<strong>of</strong>f component <strong>and</strong> similar hydrographs near<br />
<strong>the</strong> upl<strong>and</strong>s, with peaks occurring during snowmelt in <strong>the</strong><br />
spring. However, above <strong>the</strong> Sprague River Valley, <strong>the</strong> North<br />
Fork gains significant ground water, whereas <strong>the</strong> South Fork<br />
does not.<br />
From <strong>the</strong> confluence <strong>of</strong> <strong>the</strong> North <strong>and</strong> South Forks, <strong>the</strong><br />
Sprague River me<strong>and</strong>ers downstream through <strong>the</strong> narrowing<br />
upper Sprague River Valley, until it passes through Beatty<br />
Gap into <strong>the</strong> lower valley. Gains due to ground-water inflow<br />
occur in <strong>the</strong> upper valley, which contains both drained <strong>and</strong><br />
un-drained wetl<strong>and</strong>s. More ground-water discharge occurs to<br />
a spring complex (locally known as Medicine Springs) just<br />
downstream <strong>of</strong> Beatty Gap. From here, <strong>the</strong> Sprague River<br />
me<strong>and</strong>ers through <strong>the</strong> lower Sprague River Valley for 75 mi, to<br />
its confluence with <strong>the</strong> Williamson River.<br />
OR19-0048_fig08<br />
Aside from <strong>the</strong> run<strong>of</strong>f-driven Sycan River, tributaries<br />
north <strong>of</strong> <strong>the</strong> river <strong>and</strong> downstream <strong>of</strong> Beatty Gap are limited to<br />
a few unnamed ephemeral creeks draining <strong>the</strong> Knot Tablel<strong>and</strong><br />
<strong>and</strong> a few small springs near <strong>the</strong> mouth <strong>of</strong> <strong>the</strong> Sycan River.<br />
South <strong>of</strong> <strong>the</strong> river are four perennial <strong>and</strong> several ephemeral<br />
creeks. Three <strong>of</strong> <strong>the</strong> perennial creeks (Spring, Brown, <strong>and</strong><br />
Whisky Creeks) are largely ground-water fed <strong>and</strong> lack a<br />
significant run<strong>of</strong>f component (fig. 7). (Note: The Spring Creek<br />
that is tributary to <strong>the</strong> Sprague River is too small to show at <strong>the</strong><br />
scale <strong>of</strong> figures in this report. It enters <strong>the</strong> Sprague River just<br />
east <strong>of</strong> Brown Creek. The o<strong>the</strong>r Spring Creek mentioned in<br />
this report is tributary to <strong>the</strong> Williamson River.) An additional,<br />
but smaller amount <strong>of</strong> ground water discharges to Trout Creek<br />
as well as a few small springs near <strong>the</strong> mouth <strong>of</strong> Whisky<br />
Creek. Two large, isolated spring complexes, Kamkaun-<br />
McReady <strong>and</strong> Whitehorse, far<strong>the</strong>r downstream, are <strong>the</strong> only<br />
o<strong>the</strong>r ground-water discharge areas in <strong>the</strong> lower valley.<br />
<strong>Ground</strong>-water discharge to <strong>the</strong> North <strong>and</strong> South Forks<br />
<strong>of</strong> <strong>the</strong> Sprague River (above <strong>the</strong> valley) was estimated using<br />
data from gaging stations with short periods <strong>of</strong> record <strong>and</strong><br />
miscellaneous measurements made from 1992 to 2002.<br />
The spatial distribution <strong>of</strong> gains is relatively well known<br />
in <strong>the</strong> reaches <strong>and</strong> main tributaries <strong>of</strong> <strong>the</strong> North <strong>and</strong> South<br />
Forks (fig 7). However, <strong>the</strong> locations <strong>of</strong> specific springs<br />
have not been identified in ei<strong>the</strong>r subbasin. Continuous <strong>and</strong><br />
miscellaneous streamflow measurements were analyzed using<br />
index regression techniques on <strong>the</strong> North <strong>and</strong> South Forks to<br />
improve underst<strong>and</strong>ing <strong>of</strong> <strong>the</strong> temporal variability <strong>of</strong> groundwater<br />
discharge. Gains to <strong>the</strong> South Fork above <strong>the</strong> valley are
26 <strong>Ground</strong>-<strong>Water</strong> <strong>Hydrology</strong> <strong>of</strong> <strong>the</strong> <strong>Upper</strong> <strong>Klamath</strong> <strong>Basin</strong>, <strong>Oregon</strong> <strong>and</strong> California<br />
about 24 ft 3 /s, with most ground-water discharge occurring<br />
above <strong>the</strong> confluence with Brownsworth Creek (table 6). On<br />
<strong>the</strong> basis <strong>of</strong> regional regression, Deming <strong>and</strong> Fritz Creeks are<br />
estimated to contribute an additional 5 ft 3 /s <strong>of</strong> ground-water<br />
discharge to <strong>the</strong> system. <strong>Ground</strong>-water discharge to <strong>the</strong> North<br />
Fork is about 92 ft 3 /s, with one-third <strong>of</strong> <strong>the</strong> flow originating<br />
from Fivemile <strong>and</strong> Meryl Creeks. There are no direct inputs to<br />
<strong>the</strong> lower 10 mi <strong>of</strong> <strong>the</strong> North Fork.<br />
The spatial distribution <strong>of</strong> ground-water discharge in<br />
<strong>the</strong> <strong>Upper</strong> Sprague River Valley (from <strong>the</strong> confluence <strong>of</strong> <strong>the</strong><br />
North <strong>and</strong> South Forks to Beatty Gap) is more uncertain.<br />
Although <strong>the</strong>re are no identified springs in <strong>the</strong> area, synoptic<br />
measurements show about 52 ft 3 /s <strong>of</strong> ground-water discharge<br />
along <strong>the</strong> 20-mi reach, including <strong>the</strong> main stem between<br />
Beatty Gap <strong>and</strong> <strong>the</strong> confluence <strong>of</strong> <strong>the</strong> North <strong>and</strong> South Forks,<br />
<strong>and</strong> <strong>the</strong> lower 11 mi <strong>of</strong> <strong>the</strong> South Fork (table 6).<br />
The Lower Sprague Valley is defined as <strong>the</strong> area between<br />
<strong>the</strong> mouth <strong>of</strong> <strong>the</strong> river <strong>and</strong> Beatty Gap. The locations <strong>of</strong> gains<br />
in this valley are well known from numerous sets <strong>of</strong> synoptic<br />
measurements. Gains total about 150 ft 3 /s. <strong>Ground</strong> water<br />
discharges directly to <strong>the</strong> river from <strong>the</strong> springs below Beatty<br />
Gap, Kamkaun, McReady, <strong>and</strong> White Horse Springs, as well<br />
as through tributaries at Whisky, Spring, <strong>and</strong> Brown Creeks.<br />
Even though ground-water discharge occurs at discrete<br />
locations, <strong>the</strong> locations can be lumped into two areas in <strong>the</strong><br />
lower valley: (1) <strong>the</strong> valley between Whisky Creek <strong>and</strong> Beatty<br />
Gap (75 ft 3 /s), <strong>and</strong> (2) <strong>the</strong> valley near Kamkaun, Whitehorse,<br />
<strong>and</strong> McReady Springs (73 ft 3 /s) (fig. 7 <strong>and</strong> table 6). The<br />
temporal <strong>and</strong> spatial distribution <strong>of</strong> ground-water discharge in<br />
this subbasin is well understood given <strong>the</strong> multiple synoptic<br />
measurements made when <strong>the</strong> streamflow recorded at<br />
Chiloquin (11501000) was near <strong>the</strong> long-term average flow.<br />
The Sycan River is <strong>the</strong> o<strong>the</strong>r main tributary to <strong>the</strong><br />
Sprague River, but it contributes relatively little baseflow<br />
(historically about 30 ft 3 /s) given its drainage area <strong>of</strong> 563 mi 2 .<br />
The Sycan River is a snowmelt-run<strong>of</strong>f dominated stream, with<br />
peak flows occurring during <strong>the</strong> spring freshet (March–June).<br />
Monthly mean flows at <strong>the</strong> gaging station near Beatty indicate<br />
spring run<strong>of</strong>f flows are significant (400 ft 3 /s), whereas fall<br />
baseflows are minimal. Most tributaries to <strong>the</strong> Sycan River<br />
are ephemeral, contributing flow only during snowmelt<br />
or precipitation events, with ground water being a minor<br />
contributor to streamflow.<br />
The Sycan River originates in <strong>the</strong> forested upl<strong>and</strong>s east<br />
<strong>of</strong> Sycan Marsh on <strong>the</strong> western side <strong>of</strong> Winter Ridge, <strong>and</strong> is<br />
<strong>the</strong> only perennial tributary to Sycan Marsh from <strong>the</strong> east.<br />
At this location, <strong>the</strong> river has <strong>the</strong> characteristics <strong>of</strong> a run<strong>of</strong>fdominated<br />
stream, with peak flows occurring during spring to<br />
early summer <strong>and</strong> comparatively small baseflows in <strong>the</strong> fall.<br />
Long Creek is <strong>the</strong> main tributary west <strong>of</strong> Sycan Marsh <strong>and</strong><br />
has lower peak flows, but a larger component <strong>of</strong> ground-water<br />
discharge than <strong>the</strong> Sycan River above <strong>the</strong> marsh, even though<br />
<strong>the</strong> watershed has about one-half <strong>the</strong> area. <strong>Ground</strong>-water<br />
discharge to <strong>the</strong> Sycan River <strong>and</strong> Long Creek above Sycan<br />
Marsh totals about 24 ft 3 /s.<br />
Preliminary hydrologic analysis <strong>of</strong> Sycan Marsh indicates<br />
that it is predominantly a surface-water dominated wetl<strong>and</strong>.<br />
However, some ground water discharges to <strong>the</strong> marsh from<br />
numerous springs associated with a fen at <strong>the</strong> nor<strong>the</strong>rn part <strong>of</strong><br />
<strong>the</strong> marsh. O<strong>the</strong>r than <strong>the</strong> Sycan River <strong>and</strong> Long Creek, most<br />
tributaries to <strong>the</strong> marsh are ephemeral, contributing flow only<br />
during snowmelt or precipitation events. Nested piezometers<br />
show a downward head gradient in most <strong>of</strong> <strong>the</strong> marsh,<br />
indicating that water moves from <strong>the</strong> surface downward (Leslie<br />
Bach, The Nature Conservancy, oral commun., 2005), which<br />
suggests that <strong>the</strong> marsh is an area <strong>of</strong> ground-water recharge.<br />
The relation between <strong>the</strong> ground-water system <strong>and</strong> Sycan<br />
Marsh was evaluated by means <strong>of</strong> a water balance. Surface<br />
inflows <strong>and</strong> outflows from gaging station data were adjusted<br />
to <strong>the</strong> base period <strong>and</strong> <strong>the</strong>n combined with precipitation <strong>and</strong><br />
marsh evapotranspiration estimates to derive <strong>the</strong> ground-water<br />
gains or losses. The water balance resulted in a slight loss (-10<br />
to -20 ft 3 /s), suggesting that <strong>the</strong> marsh may be a ground-water<br />
recharge area. This is consistent with <strong>the</strong> downward head<br />
gradient seen in piezometer nests. This water balance has a<br />
large uncertainty because <strong>of</strong> <strong>the</strong> evapotranspiration <strong>and</strong> soil<br />
moisture terms.<br />
The lower Sycan subbasin (area between <strong>the</strong> mouth <strong>and</strong><br />
Sycan Marsh) has relatively little ground-water discharge<br />
(21 ft 3 /s), which occurs at two locations. The first is an isolated<br />
spring, Torrent Spring (12 ft 3 /s), 10 mi downstream <strong>of</strong> Sycan<br />
Marsh. The second is from a number <strong>of</strong> springs, seeps, <strong>and</strong><br />
creeks along <strong>the</strong> lower 10 mi <strong>of</strong> <strong>the</strong> river (fig. 7 <strong>and</strong> table 6).<br />
Sprague River Subbasin—Temporal Variations in<br />
<strong>Ground</strong>-<strong>Water</strong> Discharge<br />
Quantifying <strong>the</strong> temporal variations in ground-water<br />
discharge in <strong>the</strong> Sprague River subbasin is difficult due to a<br />
lack <strong>of</strong> data. <strong>Ground</strong> water discharges to a variety <strong>of</strong> spring<br />
complexes <strong>and</strong> spring-fed streams in <strong>the</strong> basin. Present gaging<br />
stations in <strong>the</strong> Sprague River subbasin are not well suited<br />
to provide direct measurement <strong>of</strong> ground-water discharge<br />
variations because <strong>of</strong> <strong>the</strong> effects <strong>of</strong> diversion. However,<br />
some inferences can be made by evaluating late-season<br />
flows at gages on <strong>the</strong> main stem with long periods <strong>of</strong> record.<br />
Gaging stations at Beatty <strong>and</strong> near Chiloquin provide useful<br />
information. However, diversions, tributaries, <strong>and</strong> probable<br />
irrigation return flow affect measurements at <strong>the</strong>se locations.<br />
At Beatty, September mean discharge, <strong>the</strong> best proxy available<br />
for baseflow above that location, varied from about 80 ft 3 /s to<br />
about 180 ft 3 /s during <strong>the</strong> period <strong>of</strong> record from 1954 to 1991.<br />
September mean discharge near Chiloquin (fig. 9) ranged from<br />
less than 150 ft 3 /s to greater than 350 ft 3 /s. Like o<strong>the</strong>r streams,<br />
<strong>the</strong> variations in September mean stream discharge generally<br />
follow climate cycles, with <strong>the</strong> highest flows following multiple<br />
wet years <strong>and</strong> <strong>the</strong> lowest flows following multiple dry years.
<strong>Ground</strong>-<strong>Water</strong> <strong>Hydrology</strong> 27<br />
DISCHARGE, IN CUBIC FEET PER SECOND<br />
500<br />
450<br />
400<br />
350<br />
300<br />
250<br />
200<br />
150<br />
100<br />
50<br />
September mean discharge - Sprague River near Chiloquin<br />
Cumulative departure from average precipitation at Crater Lake (1932-2005)<br />
0<br />
1920 1930 1940 1950 1960 1970 1980 1990 2000<br />
150<br />
125<br />
100<br />
75<br />
50<br />
25<br />
0<br />
-25<br />
-50<br />
CUMULATIVE DEPARTURE FROM AVERAGE PRECIPITATION, IN INCHES<br />
Figure 9. September mean discharge <strong>of</strong> <strong>the</strong> Sprague River near Chiloquin, <strong>Oregon</strong> (USGS gaging station number<br />
11501000), <strong>and</strong> <strong>the</strong> cumulative departure from average precipitation at Crater Lake, <strong>Oregon</strong>.<br />
Williamson River Subbasin—Geographic Distribution <strong>of</strong><br />
<strong>Ground</strong>-<strong>Water</strong> Discharge<br />
The Williamson River originates from springs just east<br />
<strong>and</strong> south <strong>of</strong> Taylor Butte. From its source, <strong>the</strong> river flows<br />
almost due north through a wide, sediment-filled valley for 35<br />
mi before flowing west for 5 mi, where it historically spread<br />
over a delta into <strong>Klamath</strong> Marsh. The natural channel at <strong>the</strong><br />
entrance to <strong>the</strong> marsh no longer exists, however, because <strong>the</strong><br />
river has been diked <strong>and</strong> redirected. Most tributaries to <strong>the</strong><br />
upper Williamson River originate along <strong>the</strong> flanks <strong>of</strong> Yamsay<br />
Mountain <strong>and</strong> <strong>the</strong> ridge to <strong>the</strong> south <strong>and</strong> are ephemeral, with<br />
flows occurring during spring snowmelt. However, significant<br />
springs contribute water directly to <strong>the</strong> upper Williamson<br />
River, which, as a result, has robust baseflow in addition to a<br />
run<strong>of</strong>f signal in its hydrograph during spring (fig. 10). Data<br />
recorded below Sheep Creek (station 11491400) indicates that<br />
flows average about 90 ft 3 /s during spring <strong>and</strong> 57 ft 3 /s in fall<br />
(table 6).<br />
The spatial distribution <strong>of</strong> ground-water discharge to<br />
<strong>the</strong> <strong>Upper</strong> Williamson River has been largely identified<br />
from synoptic measurements (fig. 7 <strong>and</strong> table 6). <strong>Ground</strong><br />
water discharges directly into <strong>the</strong> <strong>Upper</strong> Williamson River<br />
at several large springs upstream from <strong>the</strong> gage below Sheep<br />
Creek (station 11491400) <strong>and</strong> averages 54 ft 3 /s, with Wickiup<br />
Spring (24 ft 3 /s) being <strong>the</strong> largest single contributor (table 6).<br />
An additional 26 ft 3 /s <strong>of</strong> gain occurs between Sheep Creek<br />
<strong>and</strong> <strong>the</strong> marsh. Total ground-water discharge in <strong>the</strong> area is<br />
OR19-0048_fig09<br />
about 80 ft 3 / s. The knowledge <strong>of</strong> <strong>the</strong> temporal variations in<br />
ground-water discharge to <strong>the</strong> <strong>Upper</strong> Williamson River is good<br />
upstream from <strong>the</strong> Sheep Creek gaging station owing to data<br />
from <strong>the</strong> long-term records at that site. However, between<br />
Sheep Creek <strong>and</strong> <strong>Klamath</strong> Marsh, no continuous streamflow<br />
record exists.<br />
The only o<strong>the</strong>r perennial tributary that reaches <strong>Klamath</strong><br />
Marsh is <strong>the</strong> spring-fed Big Springs Creek. However, even this<br />
creek may go dry during successive drought years (Newcomb<br />
<strong>and</strong> Hart, 1958). Surprisingly, Big Springs Creek shows a<br />
relatively flashy response to snowmelt <strong>and</strong> rainfall events<br />
that is atypical for spring-fed streams. Presumably, this rapid<br />
response is due to <strong>the</strong> ability <strong>of</strong> local rainfall <strong>and</strong> snowmelt to<br />
move easily through <strong>the</strong> very permeable pumice soils. <strong>Water</strong><br />
in most o<strong>the</strong>r perennial streams draining to <strong>the</strong> marsh from <strong>the</strong><br />
eastern side <strong>of</strong> <strong>the</strong> Cascades infiltrates into <strong>the</strong> pumice plain<br />
before reaching <strong>the</strong> marsh. <strong>Water</strong> in S<strong>and</strong> <strong>and</strong> Scott Creeks<br />
would reach <strong>the</strong> marsh, but it is diverted to irrigate pasture<br />
l<strong>and</strong>s on <strong>the</strong> western edge <strong>of</strong> <strong>the</strong> marsh.<br />
<strong>Ground</strong>-water discharge to Big Springs, S<strong>and</strong>, <strong>and</strong> Scott<br />
Creeks, <strong>and</strong> o<strong>the</strong>r tributaries west <strong>of</strong> <strong>Klamath</strong> Marsh, totals<br />
about 78 ft 3 /s. About 12 ft 3 /s <strong>of</strong> <strong>the</strong> total discharge is to Miller<br />
<strong>and</strong> Sink Creeks, which lose <strong>the</strong>ir flow through infiltration into<br />
<strong>the</strong> pumice plain before reaching <strong>the</strong> marsh. Discharge to <strong>the</strong>se<br />
streams was estimated from miscellaneous measurements<br />
<strong>and</strong> short-term gaging station data using index regression.<br />
All o<strong>the</strong>r tributaries are ei<strong>the</strong>r ephemeral, or infiltrate into <strong>the</strong><br />
pumice plain.
28 <strong>Ground</strong>-<strong>Water</strong> <strong>Hydrology</strong> <strong>of</strong> <strong>the</strong> <strong>Upper</strong> <strong>Klamath</strong> <strong>Basin</strong>, <strong>Oregon</strong> <strong>and</strong> California<br />
200<br />
400<br />
DISCHARGE, IN CUBIC FEET PER SECOND<br />
180<br />
160<br />
140<br />
120<br />
100<br />
80<br />
60<br />
40<br />
Monthly mean discharge<br />
20<br />
September mean discharge<br />
Cumulative departure from average precipitation at Crater Lake (1932-2005)<br />
0<br />
1970 1975 1980 1985 1990 1995 2000<br />
350<br />
300<br />
250<br />
200<br />
150<br />
100<br />
50<br />
0<br />
CUMULATIVE DEPARTURE FROM AVERAGE PRECIPITATION<br />
AT CRATER LAKE, IN INCHES<br />
Figure 10. Monthly mean discharge <strong>and</strong> September mean discharge <strong>of</strong> <strong>the</strong> Williamson River below Sheep Creek near<br />
Lenz, <strong>Oregon</strong> (USGS gaging station number 11491400), <strong>and</strong> <strong>the</strong> cumulative departure from average precipitation at<br />
Crater Lake, <strong>Oregon</strong>.<br />
A mass balance indicates that average net annual groundwater<br />
discharge directly to <strong>Klamath</strong> Marsh was approximately<br />
50 ft 3 /s between 1971 <strong>and</strong> 2000. This estimate is based<br />
on available gage data for tributary inputs, estimates for<br />
evapotranspiration, <strong>and</strong> direct precipitation on <strong>the</strong> marsh. The<br />
analysis assumes that <strong>the</strong> net change in water stored in <strong>the</strong><br />
marsh during <strong>the</strong> 30-year period was negligible. The spatial<br />
distribution <strong>of</strong> ground-water discharge directly to <strong>the</strong> marsh is<br />
unknown.<br />
The hydrograph <strong>of</strong> <strong>the</strong> Williamson River at <strong>the</strong> outlet <strong>of</strong><br />
<strong>Klamath</strong> Marsh near Kirk (station 11493500, not shown) has<br />
a run<strong>of</strong>f signal, presumably from ephemeral tributaries <strong>and</strong><br />
direct local run<strong>of</strong>f from <strong>the</strong> marsh. Flow <strong>of</strong> <strong>the</strong> Williamson<br />
River at <strong>the</strong> outlet <strong>of</strong> <strong>the</strong> marsh ceases during most summers<br />
due to <strong>the</strong> large amount <strong>of</strong> evapotranspiration in <strong>the</strong> marsh.<br />
South <strong>of</strong> <strong>the</strong> gaging station near Kirk (altitude 4,483 ft),<br />
<strong>the</strong> Williamson River descends into a narrow, steep canyon<br />
as it drops in elevation. Small seeps <strong>and</strong> springs appear in<br />
<strong>the</strong> canyon walls near an altitude <strong>of</strong> 4,220 ft. As <strong>the</strong> river<br />
exits <strong>the</strong> canyon, three spring-fed streams contribute most <strong>of</strong><br />
<strong>the</strong> baseflow to <strong>the</strong> Williamson River: Spring Creek, Larkin<br />
Creek, <strong>and</strong> Larkin Springs. Hydrographs <strong>of</strong> <strong>the</strong> Williamson<br />
River below <strong>the</strong>se streams <strong>and</strong> above <strong>the</strong> Sprague River show<br />
a system with a large component <strong>of</strong> ground-water discharge<br />
that responds relatively slowly to precipitation <strong>and</strong> snowmelt<br />
events <strong>and</strong> that has gradual accession <strong>and</strong> recession curves.<br />
OR19-0048_fig10<br />
Peak flows commonly exceed 1,000 ft 3 /s <strong>and</strong> usually occur in<br />
March. Low flows consistently range near 300 to 350 ft 3 /s <strong>and</strong><br />
occur during summer. Gains to <strong>the</strong> river due to ground-water<br />
discharge below <strong>Klamath</strong> Marsh occur at Spring Creek (300<br />
ft 3 /s), Larkin Creek (10 ft 3 /s), Larkin Springs (10 ft 3 /s), <strong>and</strong><br />
miscellaneous small springs (28 ft 3 /s) above Larkin Spring<br />
(table 6).<br />
Williamson River Subbasin—Temporal Variations in<br />
<strong>Ground</strong>-<strong>Water</strong> Discharge<br />
About 78 percent <strong>of</strong> <strong>the</strong> 67 ft 3 /s mean annual discharge<br />
<strong>of</strong> <strong>the</strong> uppermost Williamson River is composed <strong>of</strong> ground<br />
water. Information on fluctuations in ground-water discharge<br />
to <strong>the</strong> upper Williamson River comes largely from <strong>the</strong> gage<br />
downstream from Sheep Creek (station 11491400) operated<br />
since 1974. August–September flow <strong>of</strong> <strong>the</strong> upper Williamson<br />
River, which is mostly spring discharge, averages 52 ft 3 /s.<br />
Synoptic measurements in November 2002 showed 54 ft 3 /s<br />
ground-water discharge to <strong>the</strong> reach (table 6). A graph <strong>of</strong><br />
monthly mean flows <strong>of</strong> <strong>the</strong> Williamson River below Sheep<br />
Creek (fig. 10) shows that <strong>the</strong> base flow, as represented by<br />
September mean discharge, varies by a factor <strong>of</strong> nearly 2,<br />
from 37 to 70 ft 3 /s. Comparing September mean flows with<br />
precipitation at Crater Lake (fig. 10) shows that this variation<br />
correlates with climate cycles. A plot <strong>of</strong> September flow <strong>of</strong><br />
<strong>the</strong> Williamson River at Lenz <strong>and</strong> <strong>the</strong> cumulative departure<br />
from average precipitation at Crater Lake shows a positive<br />
linear relation with a correlation coefficient <strong>of</strong> 0.79 (fig. 11).
<strong>Ground</strong>-<strong>Water</strong> <strong>Hydrology</strong> 29<br />
SEPTEMBER MEAN DISCHARGE,<br />
IN CUBIC FEET PER SECOND<br />
75<br />
70<br />
65<br />
r = 0.79<br />
60<br />
55<br />
50<br />
45<br />
40<br />
35<br />
30<br />
-20 -10 0 10 20 30 40 50 60 70<br />
CUMULATIVE DEPARTURE FROM AVERAGE PRECIPITATION<br />
AT CRATER LAKE, IN INCHES<br />
Figure 11. Relation between <strong>the</strong> September mean<br />
discharge <strong>of</strong> <strong>the</strong> Williamson River below Sheep<br />
Creek near Lenz, <strong>Oregon</strong> (USGS gaging station<br />
number 11491400), <strong>and</strong> <strong>the</strong> cumulative departure<br />
from average precipitation at Crater Lake, <strong>Oregon</strong>.<br />
Part <strong>of</strong> <strong>the</strong> observed variation in September mean flow could<br />
be due to variations in surface-water diversions, which also<br />
are correlated with climate, as irrigation dem<strong>and</strong>s are less<br />
during wet periods <strong>and</strong> greater during dry periods. Given <strong>the</strong><br />
small irrigated area above <strong>the</strong> gage (about 3,000 acres), <strong>the</strong><br />
probable climate-driven variation in September diversions is<br />
small compared to <strong>the</strong> observed variations in streamflow. This<br />
indicates that most <strong>of</strong> <strong>the</strong> observed variation in September<br />
mean flow can be attributed to fluctuations in ground-water<br />
discharge.<br />
Newcomb <strong>and</strong> Hart (1958) showed that ground-water<br />
discharge to Big Springs Creek varies from zero to about 90<br />
ft 3 /s in response to drought cycles. Meinzer (1927) shows <strong>the</strong><br />
discharge <strong>of</strong> Big Springs Creek decreasing from 61 to 11.6<br />
ft 3 /s between 1914 <strong>and</strong> 1925 in a more or less linear manner in<br />
response to a general drying climate trend. La Marche (2002)<br />
noted that Big Springs Creek also shows seasonal fluctuations<br />
in response to annual snow melt. This suggests that Big<br />
Springs Creek is fed by a local, possibly perched, flow system.<br />
The area <strong>of</strong> <strong>the</strong> lower Williamson River, between <strong>the</strong> gage<br />
at Kirk <strong>and</strong> <strong>the</strong> confluence with <strong>the</strong> Sprague River, is one <strong>of</strong><br />
<strong>the</strong> major ground-water discharge areas in <strong>the</strong> upper <strong>Klamath</strong><br />
<strong>Basin</strong>. About 86 percent <strong>of</strong> <strong>the</strong> ground-water discharge in this<br />
area is to Spring Creek, a short tributary to <strong>the</strong> Williamson<br />
River that is fed entirely by springs. The remaining groundwater<br />
discharge is to Larkin Creek, Larkin Springs, <strong>and</strong> o<strong>the</strong>r<br />
nearby springs.<br />
Spring Creek is particularly important because it provides<br />
much <strong>of</strong> <strong>the</strong> flow to <strong>the</strong> Williamson River, an important source<br />
<strong>of</strong> water to <strong>Upper</strong> <strong>Klamath</strong> Lake, during summer. Many<br />
measurements <strong>of</strong> instantaneous streamflow have been made<br />
along Spring Creek during <strong>the</strong> past 100 years by <strong>the</strong> USGS<br />
<strong>and</strong> OWRD. Spring Creek flow varies with time <strong>and</strong> correlates<br />
with climate (fig. 12). The correlation coefficient between<br />
Spring Creek flow <strong>and</strong> <strong>the</strong> cumulative departure from average<br />
precipitation at Crater Lake between 1932 <strong>and</strong> 2002 is 0.72.<br />
Spring Creek is unaffected by surface-water diversions, <strong>and</strong><br />
ground-water pumpage in <strong>the</strong> area is not enough to cause <strong>the</strong><br />
observed discharge variations.<br />
A more continuous measure <strong>of</strong> <strong>the</strong> ground-water<br />
discharge variations in <strong>the</strong> area can be developed using data<br />
from streamflow gages on <strong>the</strong> Williamson River near Kirk<br />
(11493500), <strong>the</strong> Sprague River near Chiloquin (11501000),<br />
<strong>and</strong> <strong>the</strong> Williamson River below <strong>the</strong> Sprague River, near<br />
Chiloquin (11502500). If <strong>the</strong> streamflow at <strong>the</strong> former two<br />
gages is subtracted from <strong>the</strong> latter, <strong>the</strong> positive residual<br />
(indicating a gain in streamflow between <strong>the</strong> gages) is due<br />
primarily to ground-water discharge, most <strong>of</strong> which is from<br />
Spring Creek. The ground-water discharge in this area, on <strong>the</strong><br />
basis <strong>of</strong> September mean flows, averages about 306 ft 3 /s, <strong>and</strong><br />
ranges from about 250 to 400 ft 3 /s. The uncertainty <strong>of</strong> this<br />
estimate (on <strong>the</strong> basis <strong>of</strong> estimated gage error) is only about<br />
±30 ft 3 /s. This analysis is complicated by <strong>the</strong> fact that <strong>the</strong>re are<br />
ungaged diversions from <strong>the</strong> Sprague River below <strong>the</strong> gage at<br />
Chiloquin, most notably <strong>the</strong> Modoc Irrigation District canal.<br />
Diversion records for <strong>the</strong> Modoc Canal are available from<br />
1915 to 1924, as are miscellaneous discharge measurements<br />
throughout <strong>the</strong> 1980s. Measurements <strong>of</strong> September flow<br />
average about 25 ft 3 /s. Accounting for this ungaged diversion<br />
increases <strong>the</strong> average ground-water discharge in this area<br />
based on gage data to 331 ft 3 /s. This figure compares<br />
favorably with <strong>the</strong> 350 ft 3 /s estimate based on synoptic <strong>and</strong><br />
miscellaneous flow measurements. The temporal variations<br />
generally correspond to decadal precipitation cycles (fig. 12),<br />
<strong>and</strong> comparing <strong>the</strong> calculated September mean groundwater<br />
discharge <strong>and</strong> <strong>the</strong> cumulative departure from average<br />
precipitation at Crater Lake results in a correlation coefficient<br />
<strong>of</strong> about 0.68.<br />
<strong>Upper</strong> <strong>Klamath</strong> Lake Subbasin—Geographic Distribution<br />
<strong>of</strong> <strong>Ground</strong>-<strong>Water</strong> Discharge<br />
The <strong>Upper</strong> <strong>Klamath</strong> Lake subbasin encompasses 723<br />
mi 2 above <strong>the</strong> outlet <strong>of</strong> <strong>Upper</strong> <strong>Klamath</strong> Lake, excluding <strong>the</strong><br />
Williamson <strong>and</strong> Sprague drainages. The subbasin includes<br />
<strong>Upper</strong> <strong>Klamath</strong> Lake, <strong>the</strong> broad, flat Wood River valley to<br />
<strong>the</strong> north <strong>and</strong> <strong>the</strong> adjacent upl<strong>and</strong>s including <strong>the</strong> Cascade<br />
Range to <strong>the</strong> west, Mt. Mazama (<strong>the</strong> Crater Lake highl<strong>and</strong>s)<br />
to <strong>the</strong> north, <strong>and</strong> multiple fault-block mountains <strong>and</strong> <strong>the</strong><br />
Williamson River delta to <strong>the</strong> east. The upl<strong>and</strong>s on <strong>the</strong><br />
eastern side rise abruptly from <strong>the</strong> valley floor along northsouth<br />
trending faults. The Wood River Valley is filled with<br />
Quaternary sediment, much <strong>of</strong> which is fine-grained <strong>and</strong> has<br />
low permeability. Major hydrologic features include <strong>the</strong> Wood<br />
River, <strong>Upper</strong> <strong>Klamath</strong> <strong>and</strong> Agency Lakes, <strong>and</strong> Sevenmile<br />
Creek.<br />
OR19-0048_fig11
30 <strong>Ground</strong>-<strong>Water</strong> <strong>Hydrology</strong> <strong>of</strong> <strong>the</strong> <strong>Upper</strong> <strong>Klamath</strong> <strong>Basin</strong>, <strong>Oregon</strong> <strong>and</strong> California<br />
GROUND-WATER INFLOW, IN CUBIC FEET PER SECOND<br />
500<br />
450<br />
400<br />
350<br />
300<br />
250<br />
200<br />
150<br />
Spring Creek discharge measurements<br />
Calculated September mean inflow between Kirk <strong>and</strong> Chiloquin<br />
Cumulative departure from precipitation at Crater Lake 1913-2005—<br />
Dotted where estimated from <strong>Klamath</strong> Falls data.<br />
350<br />
300<br />
250<br />
200<br />
150<br />
100<br />
50<br />
0<br />
-50<br />
-100<br />
CUMULATIVE DEPARTURE FROM AVERAGE PRECIPITATION, IN INCHES<br />
100<br />
1910<br />
1920<br />
1930<br />
1940<br />
1950<br />
1960<br />
1970<br />
1980<br />
1990<br />
2000<br />
-150<br />
Figure 12. Discharge measurements <strong>of</strong> Spring Creek, estimated ground-water discharge to <strong>the</strong> lower Williamson<br />
River between Kirk <strong>and</strong> Chiloquin, <strong>and</strong> cumulative departure from average precipitation at Crater Lake, <strong>Oregon</strong>. (Spring<br />
Creek measurements from Hubbard <strong>and</strong> o<strong>the</strong>rs, 1993, 1994; U.S. Geological Survey, various dates; <strong>and</strong> USGS <strong>and</strong> OWRD<br />
unpub. data; ground-water discharge estimated as <strong>the</strong> difference between <strong>the</strong> flow <strong>of</strong> <strong>the</strong> Williamson River below<br />
<strong>the</strong> Sprague River [gaging station 11502500] <strong>and</strong> <strong>the</strong> sum <strong>of</strong> flows <strong>of</strong> <strong>the</strong> Williamson River near Kirk [11493500] <strong>and</strong> <strong>the</strong><br />
Sprague River near Chiloquin [11501000].)<br />
The general hydrology <strong>of</strong> <strong>the</strong> subbasin is dominated by<br />
ground-water discharge from spring complexes coincident<br />
with fault scarps at <strong>the</strong> western <strong>and</strong> eastern edges <strong>of</strong> <strong>the</strong> Wood<br />
River Valley <strong>and</strong> <strong>Upper</strong> <strong>Klamath</strong> Lake (fig. 7). About one-half<br />
<strong>of</strong> <strong>the</strong> ground-water discharge in <strong>the</strong> subbasin occurs to <strong>the</strong><br />
Wood River <strong>and</strong> its tributaries (table 6). Approximately onethird<br />
<strong>of</strong> <strong>the</strong> discharge occurs directly into <strong>Upper</strong> <strong>Klamath</strong> Lake<br />
at known <strong>and</strong> unknown locations. The remaining ground-water<br />
discharge occurs in <strong>the</strong> tributaries draining <strong>the</strong> eastern flank <strong>of</strong><br />
<strong>the</strong> Cascade Range.<br />
The Wood River receives <strong>the</strong> largest amount <strong>of</strong> ground<br />
water in <strong>the</strong> <strong>Upper</strong> <strong>Klamath</strong> Lake subbasin (490 ft 3 /s), with<br />
most <strong>of</strong> <strong>the</strong> discharge occurring at discrete spring complexes<br />
along <strong>the</strong> fault scarp on <strong>the</strong> eastern boundary <strong>of</strong> <strong>the</strong> valley<br />
(table 6). Two tributaries originating on <strong>the</strong> flanks <strong>of</strong> <strong>the</strong><br />
Crater Lake highl<strong>and</strong>, Annie <strong>and</strong> Sun Creeks, contribute<br />
roughly 14 percent <strong>of</strong> ground water discharged into <strong>the</strong> river.<br />
The estimates were derived from miscellaneous measurements<br />
taken in <strong>the</strong> Wood River subbasin, with subsequent regressions<br />
to index gages.<br />
<strong>Ground</strong> water discharges from <strong>the</strong> Cascade Range to<br />
tributaries along <strong>the</strong> western margin <strong>of</strong> <strong>the</strong> subbasin at a rate <strong>of</strong><br />
about 120 ft 3 /s (table 6). The majority <strong>of</strong> that flow originates<br />
from tributary springs in <strong>the</strong> valley along <strong>the</strong> western fault<br />
scarp OR19-0048_fig12 <strong>of</strong> <strong>the</strong> region. The creek with <strong>the</strong> largest watershed<br />
in this subarea, Fourmile Creek south <strong>of</strong> Pelican Butte,<br />
contributes only 2 ft 3 /s <strong>of</strong> baseflow to <strong>the</strong> region. Estimates<br />
were derived from short-term gaging station records <strong>and</strong><br />
regression to index stations elsewhere in <strong>the</strong> basin.<br />
<strong>Ground</strong>-water inflow to <strong>Upper</strong> <strong>Klamath</strong> Lake was<br />
estimated using a monthly water balance for <strong>the</strong> 1965 through<br />
1967 water years. Hubbard (1970) measured or calculated<br />
all tributary inflows <strong>and</strong> outflows from <strong>the</strong> lake, including<br />
streamflow, diversions, precipitation, evapotranspiration, <strong>and</strong><br />
agricultural return flows. Hubbard’s monthly estimates <strong>of</strong><br />
ground-water inflow to <strong>the</strong> lake <strong>of</strong> averaged about 350 ft 3 /s<br />
from 1965 to 1967 (<strong>the</strong> median value is about 330 ft 3 /s). This<br />
is about 15 percent <strong>of</strong> <strong>the</strong> 2,330 ft 3 /s average total inflow to<br />
<strong>the</strong> lake during that period. Hubbard’s estimated ground-water<br />
discharge to <strong>the</strong> lake compares favorably with estimates <strong>of</strong><br />
<strong>the</strong> difference between <strong>Upper</strong> <strong>Klamath</strong> Lake inflows <strong>and</strong><br />
outflows (such as, ground-water inflow) by o<strong>the</strong>rs such as<br />
Cooper (2004) that cover a much longer base period (30 years<br />
compared to 3 years). Hubbard’s estimate <strong>of</strong> average groundwater<br />
inflow was revised downward to about 320 ft 3 /s by <strong>the</strong><br />
Bureau <strong>of</strong> Reclamation (2005) using updated stage-capacity<br />
curves for <strong>the</strong> lake. Although many springs have been mapped<br />
around <strong>the</strong> margins <strong>of</strong> <strong>Upper</strong> <strong>Klamath</strong> Lake, <strong>the</strong>ir combined<br />
discharge is much less than <strong>the</strong> estimated ground-water inflow.<br />
Consequently, <strong>the</strong> spatial distribution <strong>of</strong> much <strong>of</strong> <strong>the</strong> groundwater<br />
inflow directly to <strong>the</strong> lake is unknown.
<strong>Ground</strong>-<strong>Water</strong> <strong>Hydrology</strong> 31<br />
<strong>Upper</strong> <strong>Klamath</strong> Lake Subbasin—Temporal Variations in<br />
<strong>Ground</strong>-<strong>Water</strong> Discharge<br />
Temporal variations in ground-water discharge to Annie<br />
Spring can be evaluated using data from <strong>the</strong> gaging station<br />
(11503000) that has been operated on Annie Creek just below<br />
<strong>the</strong> spring since 1977 (fig. 13). The discharge from Annie<br />
Spring is small, averaging about 3 ft 3 /s. It is included here to<br />
illustrate <strong>the</strong> behavior <strong>of</strong> smaller flow systems. Annie Spring<br />
shows temporal variations that are different from those <strong>of</strong> <strong>the</strong><br />
large-scale systems discussed previously. The lowest flows<br />
<strong>of</strong> large-scale spring systems are typically August through<br />
September. The lowest flows <strong>of</strong> Annie Creek, in contrast, are<br />
January through March. The likely cause is that Annie Spring<br />
is fed by ground water recently recharged <strong>and</strong> following very<br />
short flow paths, <strong>and</strong> consequently much <strong>of</strong> <strong>the</strong> water feeding<br />
<strong>the</strong> springs is frozen as snow during <strong>the</strong> winter months. The<br />
annual low flows <strong>of</strong> large-scale systems typically increase<br />
each year during periods <strong>of</strong> successive wetter-than-average<br />
years. This is less pronounced with Annie Creek. A graph <strong>of</strong><br />
monthly <strong>and</strong> January to March mean flows <strong>of</strong> Annie Spring<br />
(fig. 13) shows that it peaks before <strong>the</strong> cumulative departure<br />
from average precipitation curve. This is because <strong>of</strong> <strong>the</strong> lack<br />
<strong>of</strong> storage effects in <strong>the</strong> small flow system. Annie Spring <strong>and</strong><br />
similar small-scale flow systems in <strong>the</strong> upper <strong>Klamath</strong> <strong>Basin</strong><br />
have <strong>the</strong> characteristics <strong>of</strong> run<strong>of</strong>f-dominated streams.<br />
Gaging stations have been operated intermittently on<br />
<strong>the</strong> Wood River since 1913. However, data are not easily<br />
compared because <strong>the</strong> stations have been operated at different<br />
locations that are affected differently by tributary inflow,<br />
return flow, <strong>and</strong> diversion, <strong>and</strong> <strong>the</strong> periods <strong>of</strong> record are short,<br />
ranging from roughly 1 to 14 years. Although <strong>the</strong> gaging<br />
station data do not provide a continuous long-term record <strong>of</strong><br />
ground-water discharge, <strong>the</strong>y do provide useful information<br />
on <strong>the</strong> magnitude <strong>and</strong> timing <strong>of</strong> ground-water discharge<br />
fluctuations. A USGS gaging station at Fort <strong>Klamath</strong><br />
(11504000) operated intermittently from 1913 to 1936 shows<br />
a probable drought-related decrease in annual mean flow from<br />
approximately 310 to 140 ft 3 /s during its period <strong>of</strong> operation<br />
(fig. 14). Ano<strong>the</strong>r USGS gaging station operated 4 mi south<br />
<strong>of</strong> Fort <strong>Klamath</strong> (11504100) from 1965 to 1967 shows a<br />
climate-related decrease in annual mean flow from 350 to<br />
290 ft 3 /s during that period. A gaging station was operated in<br />
<strong>the</strong> early 1990s, <strong>and</strong> recently near <strong>the</strong> headwaters springs <strong>of</strong><br />
<strong>the</strong> Wood River (about 1 mile downstream at Dixon Road)<br />
by Graham Mat<strong>the</strong>ws <strong>and</strong> Associates (GMA). Variations<br />
in ground-water discharge to <strong>the</strong> Wood River headwater<br />
springs can be evaluated using <strong>the</strong> GMA data (provided by<br />
Graham Mat<strong>the</strong>ws, written commun., May 13, 2003) along<br />
with a multitude <strong>of</strong> miscellaneous instantaneous discharge<br />
measurements made over several decades by USGS <strong>and</strong><br />
OWRD (fig. 14). The measurements near <strong>the</strong> headwaters<br />
DISCHARGE, IN CUBIC FEET PER SECOND<br />
16<br />
14<br />
12<br />
10<br />
8<br />
6<br />
4<br />
2<br />
Monthly mean discharge<br />
January to March mean discharge<br />
Cumulative departure from average precipitation at Crater Lake (1932-2005)<br />
0<br />
1975 1980 1985 1990 1995 2000<br />
150<br />
100<br />
50<br />
0<br />
-50<br />
-100<br />
CUMULATIVE DEPARTURE FROM AVERAGE PRECIPITATION, IN INCHES<br />
Figure 13. Monthly mean discharge <strong>and</strong> January to March mean discharge <strong>of</strong> Annie Spring near Crater Lake,<br />
<strong>Oregon</strong> (USGS gaging station number 11503000), <strong>and</strong> <strong>the</strong> cumulative departure from average precipitation at Crater<br />
Lake.
32 <strong>Ground</strong>-<strong>Water</strong> <strong>Hydrology</strong> <strong>of</strong> <strong>the</strong> <strong>Upper</strong> <strong>Klamath</strong> <strong>Basin</strong>, <strong>Oregon</strong> <strong>and</strong> California<br />
450<br />
300<br />
DISCHARGE, IN CUBIC FEET PER SECOND<br />
400<br />
350<br />
300<br />
250<br />
200<br />
150<br />
100<br />
50<br />
0<br />
1910<br />
1915<br />
1920<br />
1925<br />
1930<br />
1935<br />
1940<br />
1945<br />
1950<br />
1955<br />
Syn<strong>the</strong>tic hydrograph <strong>of</strong> discharge at Dixon Road<br />
Monthly mean flow at Dixon Road (GMA gage)<br />
Instantaneous discharge measurements at Dixon Road<br />
Monthly mean flow at Weed Road (USGS Gage 11504100)<br />
Monthly mean flow at State Hwy 62 (USGS Gage 1504000)<br />
Cumulative departure from precipitation at Crater Lake 1913-2005—<br />
Dotted where estimated from <strong>Klamath</strong> Falls data.<br />
1960<br />
1965<br />
1970<br />
1975<br />
1980<br />
1985<br />
1990<br />
1995<br />
2000<br />
2005<br />
250<br />
200<br />
150<br />
100<br />
50<br />
0<br />
-50<br />
-100<br />
CUMULATIVE DEPARTURE FROM AVERAGE PRECIPITATION, IN INCHES<br />
Figure 14. Discharge <strong>of</strong> <strong>the</strong> Wood River as measured or estimated at various sites, <strong>and</strong> <strong>the</strong> cumulative departure<br />
from average precipitation at Crater Lake, <strong>Oregon</strong>. (Monthly mean flow near headwaters from Graham Mat<strong>the</strong>ws,<br />
GMA, written commun. May 13, 2003; flow measurements near headwaters from USGS, various dates, <strong>and</strong> OWRD<br />
unpub. data; estimated discharge at Dixon road derived from regression with Fall River in upper Deschutes <strong>Basin</strong><br />
[USGS gaging station 14057500], a similar size spring-fed stream.)<br />
springs are largely unaffected by tributary inflow <strong>and</strong><br />
diversions, <strong>and</strong> are not noticeably influenced by <strong>the</strong> presently<br />
small amount <strong>of</strong> ground-water pumping in <strong>the</strong> area. Variations<br />
in ground-water discharge to <strong>the</strong> Wood River headwater<br />
springs correlate well with <strong>the</strong> cumulative departure from<br />
average precipitation at Crater Lake (r = 0.75). Measurements<br />
show <strong>the</strong> discharge <strong>of</strong> Wood River near <strong>the</strong> headwaters springs<br />
increasing from 180 to 320 ft 3 /s during wet conditions in <strong>the</strong><br />
early 1980s, <strong>and</strong> <strong>the</strong>n decreasing from 320 to 160 ft 3 /s owing<br />
to drought in <strong>the</strong> late 1980s <strong>and</strong> early 1990s. This reduction in<br />
ground-water discharge to this single spring complex applied<br />
over 1 year equates to 114,000 acre-ft <strong>of</strong> water.<br />
A syn<strong>the</strong>tic hydrograph <strong>of</strong> <strong>the</strong> Wood River near <strong>the</strong><br />
headwaters springs can be created by using <strong>the</strong> relation<br />
between Wood River discharge measurements <strong>and</strong> concurrent<br />
daily mean flows from <strong>the</strong> gaging station on Fall River<br />
(14057500), a similar-scale spring-fed stream about 70 mi<br />
north in <strong>the</strong> Deschutes <strong>Basin</strong> (fig. 14). The relation can be<br />
modeled using a second order polynomial with an R 2 <strong>of</strong> 0.80.<br />
This syn<strong>the</strong>tic hydrograph provides a reasonable depiction<br />
<strong>of</strong> <strong>the</strong> continuous temporal variations in <strong>the</strong> discharge <strong>of</strong> <strong>the</strong><br />
Wood River headwaters springs.<br />
Temporal variations in ground-water discharge directly<br />
to <strong>Upper</strong> <strong>Klamath</strong> Lake have not been measured. Given <strong>the</strong><br />
magnitude <strong>of</strong> <strong>the</strong> inflow (320 to 350 ft 3 /s), temporal variations<br />
can be inferred from o<strong>the</strong>r springs in <strong>the</strong> area with comparable<br />
discharge rates <strong>and</strong> flow-path lengths (such as Wood River<br />
Springs).<br />
Lost River Subbasin—Geographic Distribution <strong>of</strong><br />
<strong>Ground</strong>-<strong>Water</strong> Discharge<br />
The Lost River subbasin occupies about 1,650 mi 2<br />
sou<strong>the</strong>ast <strong>of</strong> <strong>Upper</strong> <strong>Klamath</strong> Lake. In its natural state, <strong>the</strong><br />
Lost River subbasin had no outlet <strong>and</strong> it drained internally.<br />
<strong>Water</strong> occasionally flowed to <strong>the</strong> subbasin, however, from <strong>the</strong><br />
<strong>Klamath</strong> River during floods through a slough connecting <strong>the</strong><br />
two drainages south <strong>of</strong> <strong>Klamath</strong> Falls (La Rue, 1922). With<br />
<strong>the</strong> development <strong>of</strong> Reclamation’s <strong>Klamath</strong> Project <strong>and</strong> <strong>the</strong><br />
construction <strong>of</strong> <strong>the</strong> Lost River diversion dam <strong>and</strong> channel<br />
(fig. 3), controlled flow between <strong>the</strong> <strong>Klamath</strong> <strong>and</strong> Lost Rivers<br />
in both directions now occurs. Major hydrologic features in<br />
this subbasin include Clear Lake <strong>and</strong> Gerber Reservoirs in <strong>the</strong><br />
upl<strong>and</strong>s, <strong>the</strong> Lost River, <strong>and</strong> <strong>the</strong> Tule Lake Sump.<br />
OR19-0048_fig14
<strong>Ground</strong>-<strong>Water</strong> <strong>Hydrology</strong> 33<br />
The Lost River proper originates at <strong>the</strong> outlet <strong>of</strong> Clear<br />
Lake Reservoir in <strong>the</strong> sou<strong>the</strong>astern part <strong>of</strong> <strong>the</strong> basin. From<br />
<strong>the</strong>re <strong>the</strong> river flows northwest, dropping from <strong>the</strong> plateau<br />
containing Clear Lake into <strong>the</strong> Langell Valley where <strong>the</strong> river<br />
flows to <strong>the</strong> town <strong>of</strong> Bonanza. From <strong>the</strong>re it flows west into<br />
Poe Valley <strong>and</strong> subsequently through Olene Gap into <strong>the</strong><br />
<strong>Klamath</strong> Valley before turning sou<strong>the</strong>ast <strong>and</strong> terminating in <strong>the</strong><br />
Tule Lake Sump in California.<br />
The hydrology <strong>of</strong> <strong>the</strong> Lost River subbasin is run<strong>of</strong>f<br />
dominated above Clear Lake <strong>and</strong> Gerber Reservoirs. The<br />
drainage area <strong>of</strong> Clear Lake consists <strong>of</strong> a broad, low relief,<br />
volcanic plateau with a mean altitude <strong>of</strong> roughly 5,000 ft<br />
covering more than 750 mi 2 south <strong>and</strong> east <strong>of</strong> <strong>the</strong> lake. Only<br />
one perennial stream, Willow Creek, exists in <strong>the</strong> plateau.<br />
Values for monthly mean inflows to Clear Lake (calculated<br />
from a mass balance) show that high flows occur in March<br />
(500 ft 3 /s), whereas low flows occur in late summer (30 ft 3 /s).<br />
The l<strong>and</strong>s draining to Gerber Reservoir are more mountainous<br />
than those draining to Clear Lake, but are geologically similar.<br />
Mean monthly inflows to Gerber Reservoir are highest in<br />
March (280 ft 3 /s) <strong>and</strong> lowest during <strong>the</strong> late summer (4–5<br />
ft 3 /s). <strong>Water</strong> from Gerber Reservoir flows to <strong>the</strong> Lost River via<br />
Miller Creek.<br />
Several springs contribute flow to <strong>the</strong> Lost River<br />
subbasin in <strong>the</strong> sediment filled Langell, Yonna, <strong>and</strong> Poe<br />
valleys. Bonanza Spring, near <strong>the</strong> town <strong>of</strong> Bonanza, is a major<br />
contributor <strong>of</strong> baseflow to <strong>the</strong> river as are a series <strong>of</strong> springs<br />
adjacent to <strong>the</strong> river near Olene Gap.<br />
Little historical data are available with which to estimate<br />
ground-water discharge in most <strong>of</strong> <strong>the</strong> Lost River subbasin.<br />
For Clear Lake <strong>and</strong> Gerber Reservoirs, USGS streamgaging<br />
data collected prior to <strong>the</strong> construction <strong>of</strong> <strong>the</strong> reservoirs were<br />
used along with inflows reported by Reclamation (Bureau <strong>of</strong><br />
Reclamation, 1954, Appendix B) to estimate ground-water<br />
discharge during fall. The average discharge during <strong>the</strong> period<br />
<strong>of</strong> record was 40 ft 3 /s <strong>and</strong> 10 ft 3 /s, respectively for <strong>the</strong> two<br />
reservoirs. Limited data for <strong>the</strong> remaining area are available<br />
from gages operated intermittently in <strong>the</strong> early 1900s <strong>and</strong><br />
late 1990s on <strong>the</strong> Lost River. Sets <strong>of</strong> synoptic measurements<br />
(Leonard <strong>and</strong> Harris, 1974; Grondin 2004) were sufficient<br />
to determine <strong>the</strong> location <strong>of</strong> gains to <strong>the</strong> river below <strong>the</strong><br />
reservoirs. These measurements demonstrate that most<br />
ground-water discharge into <strong>the</strong> Lost River proper occurs at<br />
two locations: Bonanza Springs <strong>and</strong> <strong>the</strong> area just upstream <strong>of</strong><br />
Olene Gap. The overall gain to <strong>the</strong> river between Olene <strong>and</strong><br />
<strong>the</strong> two reservoirs is about 140 ft 3 /s, largely on <strong>the</strong> basis <strong>of</strong><br />
synoptic measurements. The temporal variability <strong>of</strong> groundwater<br />
inflow is poorly known owing to <strong>the</strong> short periods <strong>of</strong><br />
record. Below Olene Gap, data were insufficient to estimate<br />
ground-water discharge to <strong>the</strong> river. Likewise, data were<br />
insufficient to estimate direct ground-water discharge to <strong>the</strong><br />
Tule Lake Sump.<br />
Lost River Subbasin—Temporal Variations in<br />
<strong>Ground</strong>-<strong>Water</strong> Discharge<br />
Bonanza Springs is <strong>the</strong> only location in <strong>the</strong> Lost River<br />
subbasin where data are sufficient to evaluate temporal<br />
variations in ground-water discharge. These springs discharge<br />
from basalt to <strong>the</strong> Lost River. Twenty-one discharge<br />
measurements <strong>of</strong> <strong>the</strong> springs, made by USGS, OWRD, or<br />
Reclamation, are in <strong>the</strong> published <strong>and</strong> unpublished literature<br />
(fig 15). Discharge <strong>of</strong> <strong>the</strong> springs is in all cases determined<br />
by comparing <strong>the</strong> difference in streamflow <strong>of</strong> <strong>the</strong> Lost River<br />
upstream <strong>and</strong> downstream from <strong>the</strong> town <strong>of</strong> Bonanza. Many<br />
upstream measurements were made between 2 <strong>and</strong> 3 mi<br />
from Bonanza, <strong>and</strong> some were made at a bridge about 5 mi<br />
upstream. Downstream measurements all have been made<br />
about 3 mi downstream at Harpold Dam. Some determinations<br />
<strong>of</strong> spring flow account for all tributary inflows (including<br />
agricultural drains) <strong>and</strong> diversions between <strong>the</strong> upstream <strong>and</strong><br />
downstream measurement sites. O<strong>the</strong>r than Bonanza Springs,<br />
<strong>the</strong>se gains <strong>and</strong> losses are minor outside <strong>of</strong> <strong>the</strong> irrigation<br />
season. Many determinations <strong>of</strong> spring flow include only <strong>the</strong><br />
upstream <strong>and</strong> downstream measurements <strong>and</strong> measurement<br />
<strong>of</strong> <strong>the</strong> single major tributary, Buck Creek. Determinations<br />
<strong>of</strong> spring discharge made by comparing flows only at Keller<br />
Bridge, Buck Creek, <strong>and</strong> Harpold Dam outside <strong>of</strong> <strong>the</strong><br />
irrigation season are considered reasonable because <strong>the</strong> spring<br />
discharge is much larger than <strong>the</strong> o<strong>the</strong>r stream gains <strong>and</strong><br />
losses.<br />
Discharge measurements <strong>of</strong> Bonanza Springs show<br />
considerable temporal variation (fig. 15). The largest<br />
measurement, 118 ft 3 /s in October 1958, occurred after a<br />
15-year period <strong>of</strong> wetter-than-average wea<strong>the</strong>r. The smallest<br />
measurement, 38 ft 3 /s in January 1992, occurred late in a<br />
drought that started in <strong>the</strong> mid-1980s. Overall, <strong>the</strong> pattern <strong>of</strong><br />
spring discharge follows <strong>the</strong> general pattern <strong>of</strong> precipitation,<br />
reflecting drought cycles <strong>and</strong> a general drying trend since<br />
<strong>the</strong> late 1950s. Unfortunately, no measurements are available<br />
from <strong>the</strong> very dry period in <strong>the</strong> early 1940s. Bonanza Springs<br />
discharge is affected by climate, ground-water pumping, <strong>and</strong><br />
artificial manipulation <strong>of</strong> <strong>the</strong> stage <strong>of</strong> <strong>the</strong> Lost River (Grondin,<br />
2004). Discharge from <strong>the</strong> main spring can cease entirely<br />
during <strong>the</strong> irrigation season in dry years. Most measurements<br />
after 1960 (fig. 15) were made well after <strong>the</strong> irrigation season<br />
(December to April), so <strong>the</strong> system should have mostly<br />
recovered from <strong>the</strong> seasonal effects <strong>of</strong> pumping <strong>and</strong> diversion.<br />
Present information is insufficient, however, to determine<br />
precisely how much <strong>of</strong> <strong>the</strong> variation in spring discharge is<br />
natural <strong>and</strong> how much is related to pumping.
34 <strong>Ground</strong>-<strong>Water</strong> <strong>Hydrology</strong> <strong>of</strong> <strong>the</strong> <strong>Upper</strong> <strong>Klamath</strong> <strong>Basin</strong>, <strong>Oregon</strong> <strong>and</strong> California<br />
150<br />
150<br />
DISCHARGE, IN CUBIC FEET PER SECOND<br />
125<br />
100<br />
75<br />
50<br />
25<br />
0<br />
1910<br />
1915<br />
1920<br />
1925<br />
1930<br />
1935<br />
1940<br />
1945<br />
1950<br />
1955<br />
Published measurements with estimated 95% confidence intervals<br />
Unverified measurements<br />
Cumulative departure from precipitation at Crater Lake 1913-2005—<br />
Dotted where estimated from <strong>Klamath</strong> Falls data.<br />
1960<br />
1965<br />
1970<br />
1975<br />
1980<br />
1985<br />
1990<br />
1995<br />
2000<br />
2005<br />
125<br />
100<br />
75<br />
50<br />
25<br />
0<br />
-25<br />
-50<br />
CUMULATIVE DEPARTURE FROM AVERAGE PRECIPITATION, IN INCHES<br />
Figure 15. Discharge <strong>of</strong> Bonanza Springs <strong>and</strong> cumulative departure from average precipitation at Crater Lake,<br />
<strong>Oregon</strong>. (Sources <strong>of</strong> data: Meinzer, 1927; U.S. Geological Survey, 1956, 1960a; Leonard <strong>and</strong> Harris, 1974; Grondin,<br />
2004; measurements labeled unverified appear in <strong>of</strong>ficial State <strong>of</strong> <strong>Oregon</strong> correspondence <strong>and</strong> are attributed to<br />
Reclamation <strong>and</strong> USGS, but no original records were found.)<br />
<strong>Klamath</strong> River Subbasin—Geographic Distribution <strong>of</strong><br />
<strong>Ground</strong>-<strong>Water</strong> Discharge<br />
The <strong>Klamath</strong> River subbasin encompasses <strong>the</strong> area<br />
between <strong>the</strong> outlet <strong>of</strong> <strong>Upper</strong> <strong>Klamath</strong> Lake <strong>and</strong> Iron Gate<br />
Dam. The main hydrologic features are John C. Boyle, Copco,<br />
<strong>and</strong> Iron Gate Reservoirs, Lake Ewauna, Lower <strong>Klamath</strong> Lake,<br />
<strong>and</strong> <strong>the</strong> <strong>Klamath</strong> River. The <strong>Klamath</strong> River begins at <strong>the</strong> outlet<br />
<strong>of</strong> <strong>Upper</strong> <strong>Klamath</strong> Lake, where, for <strong>the</strong> first mile or so, it is<br />
known as <strong>the</strong> Link River. From <strong>the</strong> dam, <strong>the</strong> Link River flows<br />
about 1 mi through a narrow gorge into a broad, flat valley<br />
containing Lake Ewauna, <strong>the</strong> head <strong>of</strong> <strong>Klamath</strong> River proper.<br />
Lake Ewauna, impounded by Keno Dam, is a long, narrow<br />
reservoir that traverses <strong>the</strong> nor<strong>the</strong>rn part <strong>of</strong> <strong>the</strong> Lower <strong>Klamath</strong><br />
Lake subbasin.<br />
Prior to development <strong>of</strong> <strong>the</strong> region, <strong>the</strong> <strong>Klamath</strong> River<br />
occasionally spilled across <strong>the</strong> low, nearly level divide<br />
into <strong>the</strong> Lost River subbasin during floods. La Rue (1922)<br />
hypo<strong>the</strong>sized that water also may have flowed from <strong>the</strong> Lost<br />
River to <strong>the</strong> <strong>Klamath</strong> River subbasin during floods. Recent<br />
analysis <strong>of</strong> topographic mapping from <strong>the</strong> early 1900s,<br />
however, suggests that <strong>the</strong> Lost River was incised to <strong>the</strong><br />
degree that flow from <strong>the</strong> Lost River system to <strong>the</strong> <strong>Klamath</strong><br />
River subbasin was highly unlikely (Jon Hicks, Bureau <strong>of</strong><br />
Reclamation, oral commun., 2006). <strong>Water</strong> also moved between<br />
<strong>the</strong> <strong>Klamath</strong> River <strong>and</strong> Lower <strong>Klamath</strong> Lake subbasin prior<br />
to development. <strong>Water</strong> flowed from <strong>the</strong> <strong>Klamath</strong> River into<br />
Lower <strong>Klamath</strong> Lake during periods <strong>of</strong> high flow, usually in<br />
winter or spring. After high flows, water would flow out <strong>of</strong> <strong>the</strong><br />
lake through <strong>the</strong> <strong>Klamath</strong> Strait back into <strong>the</strong> <strong>Klamath</strong> River.<br />
There is some uncertainty as to timing <strong>and</strong> duration <strong>of</strong> flow<br />
from <strong>the</strong> lake to <strong>the</strong> river, <strong>and</strong> it probably varied from year to<br />
year with hydrologic conditions (Weddell, 2000; Bureau <strong>of</strong><br />
Reclamation, 2005). Flows into <strong>and</strong> out <strong>of</strong> <strong>the</strong> Lost River <strong>and</strong><br />
Lower <strong>Klamath</strong> Lake subbasins are now controlled.<br />
Downstream from Lake Ewauna <strong>and</strong> Keno Dam, <strong>the</strong><br />
<strong>Klamath</strong> River enters a canyon <strong>and</strong> flows into John C. Boyle<br />
Reservoir (operated by PacifiCorp), near <strong>the</strong> confluence with<br />
Spencer Creek. Below John C. Boyle Dam, <strong>the</strong> river drops<br />
into ano<strong>the</strong>r steep canyon. About 1 mile below <strong>the</strong> dam,<br />
a large spring complex contributes significant flow to <strong>the</strong><br />
river. Numerous perennial streams originating from <strong>the</strong> High<br />
Cascades <strong>and</strong> older Western Cascades also add flow to <strong>the</strong><br />
river between Keno <strong>and</strong> Iron Gate Dams. These tributaries<br />
are predominately run<strong>of</strong>f dominated; however several (for<br />
example, Spencer <strong>and</strong> Fall Creeks) have large components <strong>of</strong><br />
ground-water discharge. Flows in <strong>the</strong> <strong>Klamath</strong> River above<br />
Iron Gate Dam are largely regulated by Reclamation <strong>and</strong><br />
PacifiCorp impoundments, including Link River Dam at <strong>the</strong><br />
outlet <strong>of</strong> <strong>Upper</strong> <strong>Klamath</strong> Lake. Gaging station data from below<br />
Iron Gate Dam (11516530) show a high mean monthly flow <strong>of</strong><br />
3,600 ft 3 /s in March <strong>and</strong> a low mean monthly flow <strong>of</strong> 770 ft 3 /s<br />
in August.<br />
OR19-0048_fig15
<strong>Ground</strong>-<strong>Water</strong> <strong>Hydrology</strong> 35<br />
Most ground-water discharge in this subbasin occurs<br />
along <strong>the</strong> <strong>Klamath</strong> River <strong>and</strong> principal tributaries. A small<br />
amount <strong>of</strong> ground water also discharges to springs southwest<br />
<strong>of</strong> Lower <strong>Klamath</strong> Lake. <strong>Ground</strong>-water discharge in <strong>the</strong><br />
<strong>Klamath</strong> River subbasin was calculated directly from longterm<br />
streamflow data <strong>and</strong> corrected for reservoir storage in<br />
reaches <strong>of</strong> <strong>the</strong> <strong>Klamath</strong> River from <strong>the</strong> gaging station at Keno<br />
(11509500) to <strong>the</strong> gaging station below <strong>the</strong> John C. Boyle<br />
Power Plant (11510700) (about 5 mi below <strong>the</strong> dam), <strong>and</strong><br />
from that gage to <strong>the</strong> gage below Iron Gate Dam (11516530).<br />
Some short-term streamflow records available for tributaries<br />
were useful for discriminating ground-water discharge directly<br />
to <strong>the</strong> river from discharge to tributaries. Gains <strong>and</strong> losses<br />
between Link River Dam <strong>and</strong> Keno were not estimated owing<br />
to large uncertainties in <strong>the</strong> data in that reach. Discharge to<br />
springs southwest <strong>of</strong> Lower <strong>Klamath</strong> Lake was not measured<br />
for this study, but measurements are available from Wood<br />
(1960) <strong>and</strong> Reclamation records.<br />
The largest source <strong>of</strong> ground-water discharge between<br />
<strong>the</strong> gage at Keno <strong>and</strong> <strong>the</strong> gage below <strong>the</strong> John C. Boyle<br />
Power Plant is a series <strong>of</strong> springs about a mile below <strong>the</strong><br />
dam (fig. 7 <strong>and</strong> table 6). Although early references to <strong>the</strong>se<br />
springs are scarce, Newcomb <strong>and</strong> Hart (1958) note that springs<br />
contribute “considerable inflow” to <strong>the</strong> river in this area.<br />
Their observations <strong>and</strong> those <strong>of</strong> local residents cited in <strong>the</strong>ir<br />
report predate construction <strong>of</strong> John C. Boyle Dam, indicating<br />
that <strong>the</strong>se springs do not merely represent reservoir seepage.<br />
Records show that average gain from <strong>the</strong> springs is about<br />
190 ft 3 /s (table 6). The temporal variation in <strong>the</strong> discharge <strong>of</strong><br />
<strong>the</strong>se springs is well characterized. The baseflow <strong>of</strong> Spencer<br />
Creek, tributary to <strong>the</strong> <strong>Klamath</strong> River in this reach, is about<br />
27 ft 3 /s.<br />
Between <strong>the</strong> gage below <strong>the</strong> John C. Boyle Power Plant<br />
<strong>and</strong> that below Iron Gate Dam, gains averaged 140 ft 3 /s from<br />
1967 to 2000 (table 6). The spatial location <strong>of</strong> <strong>the</strong> groundwater<br />
discharge in this reach is not well known; however, <strong>the</strong>re<br />
is evidence <strong>of</strong> inflow to <strong>the</strong> main stem <strong>of</strong> <strong>the</strong> <strong>Klamath</strong> River<br />
between river miles 207 <strong>and</strong> 213, roughly between Shovel<br />
<strong>and</strong> Rock Creeks. Thermal infrared remote sensing shows that<br />
<strong>the</strong> river cools in this reach, an indication <strong>of</strong> ground-water<br />
discharge (<strong>Water</strong>shed Sciences, 2002). This reach corresponds<br />
with <strong>the</strong> boundary between <strong>the</strong> High Cascade <strong>and</strong> Western<br />
Cascade subprovinces <strong>and</strong> is <strong>the</strong>refore an area <strong>of</strong> expected<br />
ground-water discharge. In addition, <strong>the</strong> reach traverses a<br />
large l<strong>and</strong>slide complex with numerous mapped springs. Some<br />
inflow in this reach is due to tributary streams. Fall Creek,<br />
which drains an area dominated by rocks <strong>of</strong> <strong>the</strong> High Cascade<br />
subprovince, is <strong>the</strong> largest known contributor, with a baseflow<br />
<strong>of</strong> about 36 ft 3 /s, whereas <strong>the</strong> much larger Jenny Creek<br />
watershed, which is underlain largely by low-permeability<br />
older volcanic rocks, contributes only about 9 ft 3 /s. Flow data<br />
are sparse for <strong>the</strong> remaining tributaries in <strong>Oregon</strong>, but regional<br />
regression techniques show that <strong>the</strong>se contributions probably<br />
amount to slightly greater than 1 ft 3 /s. The component <strong>of</strong><br />
baseflow to <strong>the</strong> reach from California tributaries is unknown.<br />
<strong>Ground</strong> water also discharges to a number <strong>of</strong> spring<br />
complexes southwest <strong>of</strong> Lower <strong>Klamath</strong> Lake (fig. 7<br />
<strong>and</strong> table 6). Reclamation engineer Louis Hall made a<br />
reconnaissance <strong>of</strong> <strong>the</strong> Lower <strong>Klamath</strong> Lake subbasin in<br />
September 1908 during which he inventoried springs along<br />
<strong>the</strong> margin <strong>of</strong> <strong>the</strong> lake <strong>and</strong> estimated <strong>the</strong>ir discharge. His<br />
estimates <strong>of</strong> spring discharge to <strong>the</strong> lake total 104 ft 3 /s,<br />
although his estimating methods are not known (Tom Perry,<br />
Bureau <strong>of</strong> Reclamation, written commun., 2006). Wood<br />
(1960) made several measurements <strong>of</strong> discharge at three<br />
<strong>of</strong> <strong>the</strong> principal spring complexes during water year 1955.<br />
He also reports CDWR observations that year for a fourth<br />
discharge measurement. Wood’s measurements are not directly<br />
comparable to Hall’s earlier estimates because <strong>of</strong> differences<br />
in locations; however, in cases where general comparisons can<br />
be made, Wood’s measured flows appear to be about one-half<br />
<strong>of</strong> Hall’s estimates. Averages <strong>of</strong> Wood’s measurements total<br />
about 35 ft 3 /s. Some small seasonal variability is evident in <strong>the</strong><br />
measurements, but <strong>the</strong> data are too sparse to define a pattern<br />
<strong>and</strong> identify <strong>the</strong> source <strong>of</strong> <strong>the</strong> variability. Measurements made<br />
in 1955 may reasonably represent <strong>the</strong> average flow during <strong>the</strong><br />
early 1950s. Precipitation during water year 1955 was less<br />
than average, but 1953 <strong>and</strong> 1954 were close to <strong>the</strong> long-term<br />
average. Discharge <strong>of</strong> <strong>the</strong>se springs probably is now less than<br />
it was in <strong>the</strong> mid-1950s, owing to dryer conditions in recent<br />
decades <strong>and</strong> increased ground-water development in <strong>the</strong> area.<br />
<strong>Klamath</strong> River Subbasin—Temporal Variations in <strong>Ground</strong>-<br />
<strong>Water</strong> Discharge<br />
The principal sources <strong>of</strong> data used to evaluate groundwater<br />
discharge variations in <strong>the</strong> <strong>Klamath</strong> River subbasin are<br />
stream-gaging stations at Keno (11509500), below <strong>the</strong> John<br />
C. Boyle power plant (11510700), <strong>and</strong> below Iron Gate Dam<br />
(11516530). These data are augmented with short-term gaging<br />
station records from Spencer <strong>and</strong> Fall Creeks (11510000<br />
<strong>and</strong> 11512000, respectively). Underst<strong>and</strong>ing ground-water<br />
discharge variations along <strong>the</strong> <strong>Klamath</strong> River, however, is<br />
complicated by inflow from ungaged tributaries, unmeasured<br />
diversions, <strong>and</strong> changes in reservoir storage.<br />
<strong>Ground</strong>-water discharges to <strong>the</strong> <strong>Klamath</strong> River between<br />
<strong>the</strong> Keno gage <strong>and</strong> <strong>the</strong> gage below <strong>the</strong> John C. Boyle power<br />
plant. Nearly all <strong>of</strong> <strong>the</strong> discharge is from a spring complex<br />
near river mile 224 about 1 mi below <strong>the</strong> John C. Boyle Dam<br />
<strong>and</strong> about 3.5 mi above <strong>the</strong> power plant. Thermal infrared<br />
remote sensing on July 15, 2002, showed that this spring<br />
complex cooled <strong>the</strong> river about 10°F (<strong>Water</strong>shed Sciences,<br />
2002). Gage data indicate <strong>the</strong> flow in <strong>the</strong> river just below <strong>the</strong><br />
springs was about 370 ft 3 /s on that date. Temporal variations
36 <strong>Ground</strong>-<strong>Water</strong> <strong>Hydrology</strong> <strong>of</strong> <strong>the</strong> <strong>Upper</strong> <strong>Klamath</strong> <strong>Basin</strong>, <strong>Oregon</strong> <strong>and</strong> California<br />
in net ground-water discharge to this reach can be evaluated<br />
by comparing August mean flows at <strong>the</strong> two gages <strong>and</strong><br />
accounting for changes in storage <strong>of</strong> John C. Boyle Reservoir<br />
(reservoir data from Rob Allerman, PacifiCorp, written<br />
commun, 2002). August means were used to evaluate temporal<br />
variations here instead <strong>of</strong> <strong>the</strong> September–November means to<br />
minimize <strong>the</strong> effects <strong>of</strong> fall storms. This can be done because<br />
diversions are insignificant <strong>and</strong> <strong>the</strong> mean August inflow (240<br />
ft 3 /s) is reasonably close to <strong>the</strong> mean September–November<br />
inflow (230 ft 3 /s).<br />
A graph showing <strong>the</strong> August mean net inflow to <strong>the</strong><br />
reach between Keno <strong>and</strong> <strong>the</strong> gage below <strong>the</strong> John C. Boyle<br />
power plant (fig. 16) shows that ground-water discharge to this<br />
reach varied from less than 200 ft 3 /s to greater than 300 ft 3 /s<br />
during <strong>the</strong> period <strong>of</strong> record. The average error in <strong>the</strong> individual<br />
inflow estimates is approximately ± 50 ft 3 /s on <strong>the</strong> basis <strong>of</strong><br />
measurement error <strong>of</strong> <strong>the</strong> stream gages. The general pattern<br />
<strong>of</strong> ground-water discharge loosely follows <strong>the</strong> decadal cycles<br />
seen in precipitation, with <strong>the</strong> lowest inflows corresponding to<br />
extended periods <strong>of</strong> drought, but that correlation is low<br />
(r = 0.30).<br />
<strong>Ground</strong>-water discharge also occurs to <strong>the</strong> <strong>Klamath</strong> River<br />
between <strong>the</strong> gaging station below <strong>the</strong> John C. Boyle power<br />
plant <strong>and</strong> <strong>the</strong> gaging station below Iron Gate Dam. Evaluating<br />
temporal variations in ground-water discharge to this reach<br />
is made difficult by ungaged tributary inflow <strong>and</strong> probable<br />
diversions. Moreover, calculated inflow values include<br />
cumulative errors in data from <strong>the</strong> two gaging stations <strong>and</strong><br />
in storage measurements <strong>of</strong> two large reservoirs. As with <strong>the</strong><br />
upstream reach, temporal variations in ground-water discharge<br />
can be evaluated by calculating <strong>the</strong> differences between flows<br />
at <strong>the</strong> two gages <strong>and</strong> accounting for changes in reservoir<br />
storage (fig. 16). September to November mean inflows are<br />
used here to minimize <strong>the</strong> effects <strong>of</strong> diversions.<br />
Between 1967 <strong>and</strong> 2002, <strong>the</strong> September to November<br />
mean inflow between <strong>the</strong> gaging stations below <strong>the</strong> John C.<br />
Boyle power plant <strong>and</strong> Iron Gate Dam ranged from 30 to 330<br />
ft 3 /s, averaging 140 ft 3 /s (fig. 17). About 45 ft 3 /s if this inflow<br />
is from Fall <strong>and</strong> Jenny Creeks (table 6). The uncertainty <strong>of</strong> <strong>the</strong><br />
inflow estimates due to measurement error is ± 110 ft 3 /s. The<br />
correlation between ground-water discharge <strong>and</strong> climate is not<br />
as apparent here as elsewhere in <strong>the</strong> basin owing to <strong>the</strong> small<br />
amount <strong>of</strong> net ground-water inflow relative to <strong>the</strong> streamflow<br />
measurement error.<br />
INFLOW, IN CUBIC FEET PER SECOND<br />
400<br />
350<br />
300<br />
250<br />
200<br />
150<br />
100<br />
50<br />
200<br />
150<br />
100<br />
50<br />
0<br />
-50<br />
PacifiCorp spring discharge estimates<br />
August mean inflow between gages at Keno <strong>and</strong> below <strong>the</strong> J.C. Boyle Dam<br />
Cumulative departure from average precipitation at Crater Lake (1932-2005)<br />
0<br />
-100<br />
1960 1965 1970 1975 1980 1985 1990 1995 2000 2005<br />
CUMULATIVE DEPARTURE FROM AVERAGE PRECIPITATION, IN INCHES<br />
Figure 16. August mean gains in flow (a proxy for ground-water discharge) between Keno (USGS gaging station number<br />
11509500) <strong>and</strong> <strong>the</strong> John C. Boyle power plant (11510700), estimates <strong>of</strong> inflow by PacifiCorp, <strong>and</strong> <strong>the</strong> cumulative departure<br />
from average precipitation at Crater Lake, <strong>Oregon</strong>. (PacifiCorp data from Rob Allerman, written commun., 2002).
<strong>Ground</strong>-<strong>Water</strong> <strong>Hydrology</strong> 37<br />
INFLOW, IN CUBIC FEET PER SECOND<br />
400<br />
350<br />
300<br />
250<br />
200<br />
150<br />
100<br />
50<br />
September-November mean inflow between J.C. Boyle Power Plant <strong>and</strong> Iron Gate Dam<br />
Cumulative departure from average precipitation at Crater Lake (1932-2005)<br />
0<br />
1965 1970 1975 1980 1985 1990 1995 2000<br />
250<br />
200<br />
150<br />
100<br />
50<br />
0<br />
-50<br />
CUMULATIVE DEPARTURE FROM AVERAGE PRECIPITATION, IN INCHES<br />
Figure 17. September to November mean gains in flow (a proxy for ground-water discharge) between <strong>the</strong> John C.<br />
Boyle power plant (USGS station number 11510700) <strong>and</strong> Iron Gate Dam (11516530), <strong>and</strong> <strong>the</strong> cumulative departure from<br />
average precipitation at Crater Lake, <strong>Oregon</strong>.<br />
Summary <strong>of</strong> Geographic <strong>and</strong> Temporal Variations<br />
<strong>of</strong> <strong>Ground</strong>-<strong>Water</strong> Discharge to Streams<br />
Analysis <strong>of</strong> streamflow data indicates that many streams<br />
in <strong>the</strong> upper <strong>Klamath</strong> <strong>Basin</strong> have a large component <strong>of</strong> ground<br />
water. Most streams throughout <strong>the</strong> world rely on groundwater<br />
discharge to support flows during <strong>the</strong> dry season. The<br />
upper <strong>Klamath</strong> <strong>Basin</strong> <strong>and</strong> o<strong>the</strong>r basins on <strong>the</strong> eastern flank <strong>of</strong><br />
<strong>the</strong> Cascade Range are unique in that ground water discharge<br />
composes a large proportion <strong>of</strong> <strong>the</strong> total streamflow. This is<br />
attributable to <strong>the</strong> substantial regional ground-water system<br />
that exists in <strong>the</strong> permeable volcanic terrane. Some major<br />
streams in <strong>the</strong> basin, such as <strong>the</strong> Wood River <strong>and</strong> Spring<br />
Creek, are virtually entirely ground water fed. It has long<br />
been recognized that much <strong>of</strong> <strong>the</strong> water flowing into <strong>Upper</strong><br />
<strong>Klamath</strong> Lake originates as ground-water discharge (Bureau <strong>of</strong><br />
Reclamation, 1954, p. 150). Of <strong>the</strong> 2,200–2,300 ft 3 /s average<br />
total inflow to <strong>the</strong> lake (from Hubbard, 1970, <strong>and</strong> Reclamation<br />
records), at least 60 percent can be attributed to ground-water<br />
discharge in <strong>the</strong> Wood River subbasin <strong>and</strong> springs in <strong>the</strong> lower<br />
Sprague River drainage <strong>and</strong> <strong>the</strong> Williamson River drainage<br />
below Kirk. This quantity does not include ground-water<br />
discharge to upper parts <strong>of</strong> <strong>the</strong> Williamson <strong>and</strong> Sprague River<br />
systems, which would make <strong>the</strong> figure even larger. The large<br />
component <strong>of</strong> ground water in streamflow influences <strong>the</strong><br />
hydrologic response <strong>of</strong> <strong>the</strong> basin to climate cycles, <strong>and</strong> has<br />
implications for flow forecasting (Risley <strong>and</strong> o<strong>the</strong>rs, 2005).<br />
OR19-0048_fig17<br />
Discharge from all major ground-water discharge areas<br />
in <strong>the</strong> basin fluctuates over time. <strong>Ground</strong>-water discharge<br />
fluctuations are primarily climate driven, <strong>and</strong>, <strong>the</strong>refore,<br />
discharge from <strong>the</strong> various sources tends to vary in unison.<br />
Owing to <strong>the</strong> effects <strong>of</strong> ground-water storage, regional-scale<br />
discharge areas integrate climate conditions over multiple<br />
years. Consequently, ground-water discharge fluctuations<br />
tend to follow a pattern similar to <strong>the</strong> cumulative departure<br />
from average precipitation. A practical implication <strong>of</strong> this<br />
observation is that ground-water discharge from storage may<br />
support robust streamflow during a dry year following a series<br />
<strong>of</strong> wet years. Conversely, it may take multiple years <strong>of</strong> average<br />
or above average conditions following a protracted drought to<br />
replace ground-water storage <strong>and</strong> return spring discharge (<strong>and</strong><br />
hence, streamflow) to predrought conditions.<br />
<strong>Ground</strong>-water discharge variations can represent<br />
substantial volumes <strong>of</strong> water on an annual basis. The<br />
combined ground-water discharge to <strong>the</strong> lower Williamson,<br />
Sprague, <strong>and</strong> Wood Rivers just upstream <strong>of</strong> <strong>Upper</strong> <strong>Klamath</strong><br />
Lake can vary by at least 450 ft 3 /s in response to climate<br />
cycles. This equates to an annual volume <strong>of</strong> 326,000 acreft.<br />
The actual variation in ground-water discharge to <strong>Upper</strong><br />
<strong>Klamath</strong> Lake <strong>and</strong> its tributaries is larger, because <strong>the</strong> probable<br />
variations in ground-water discharge to Fort Creek, Crooked<br />
Creek, <strong>and</strong> springs discharging directly to <strong>the</strong> lake have not<br />
been included. Gaging station data show that net ground-water<br />
inflow to <strong>the</strong> <strong>Klamath</strong> River (<strong>and</strong> ground-water fed tributaries)<br />
between Keno <strong>and</strong> Iron Gate Dam probably varies at least 150<br />
ft 3 /s in response to climate.
38 <strong>Ground</strong>-<strong>Water</strong> <strong>Hydrology</strong> <strong>of</strong> <strong>the</strong> <strong>Upper</strong> <strong>Klamath</strong> <strong>Basin</strong>, <strong>Oregon</strong> <strong>and</strong> California<br />
<strong>Ground</strong>-<strong>Water</strong> Discharge to Wells<br />
<strong>Ground</strong> water pumped from wells in <strong>the</strong> upper <strong>Klamath</strong><br />
<strong>Basin</strong> is used primarily for public supply <strong>and</strong> agriculture.<br />
For public supply, ground water is provided by public or<br />
privately owned utilities for drinking, municipal, industrial,<br />
<strong>and</strong> commercial purposes. Most ground water pumped for<br />
irrigation is used for agriculture; however, some is used for<br />
irrigation <strong>of</strong> cemeteries, parks, <strong>and</strong> golf courses. The following<br />
discussion is limited to ground-water withdrawals for publicsupply<br />
<strong>and</strong> agricultural irrigation. Industrial <strong>and</strong> domestic<br />
withdrawals from individual private wells are not discussed<br />
because <strong>the</strong>ir proportion <strong>of</strong> <strong>the</strong> total ground-water use in <strong>the</strong><br />
basin is small.<br />
Methods<br />
<strong>Ground</strong>-water pumping for public-supply <strong>and</strong> irrigation<br />
was estimated using different methods. Since 1985, OWRD<br />
has required public suppliers to report ground-water pumpage<br />
annually. Public suppliers in <strong>Oregon</strong> report monthly pumpage<br />
totals by individual well for each water year. The totals<br />
typically are based on direct flowmeter measurements or<br />
calculated from pumping rates <strong>and</strong> duration <strong>of</strong> pumping. The<br />
totals for this report were based on reported pumpage in 2000.<br />
No pumpage data were available for <strong>the</strong> small California<br />
communities <strong>of</strong> Dorris, Macdoel, <strong>and</strong> Tulelake. <strong>Ground</strong>water<br />
withdrawals for <strong>the</strong>se suppliers were estimated using<br />
population data.<br />
Nei<strong>the</strong>r <strong>Oregon</strong> nor California requires well owners<br />
to report ground-water withdrawals for irrigation. Some<br />
irrigators in <strong>Oregon</strong> report <strong>the</strong>ir yearly pumpage to OWRD<br />
ei<strong>the</strong>r voluntarily or as required by conditions in <strong>the</strong>ir waterright<br />
permit, but such reporting is rare. The lack <strong>of</strong> any<br />
comprehensive reporting system by both States means that<br />
indirect methods based on water right information, satellite<br />
imagery, <strong>and</strong> l<strong>and</strong> <strong>and</strong> water surveys must be used to estimate<br />
<strong>the</strong> rate <strong>and</strong> distribution <strong>of</strong> ground-water withdrawal.<br />
<strong>Ground</strong>-<strong>Water</strong> Pumpage for Public-Supply Use<br />
<strong>Ground</strong> water is <strong>the</strong> source <strong>of</strong> water supplied by eight<br />
public systems <strong>and</strong> one quasi-public system in <strong>the</strong> study area.<br />
Public suppliers <strong>of</strong> ground water include <strong>the</strong> communities <strong>of</strong><br />
<strong>Klamath</strong> Falls, Bly, Chiloquin, Merrill, <strong>and</strong> Malin. One resort<br />
community northwest <strong>of</strong> <strong>Klamath</strong> Falls is considered a quasimunicipal<br />
system on <strong>the</strong> basis <strong>of</strong> <strong>the</strong> variety <strong>of</strong> water uses.<br />
<strong>Ground</strong>-water withdrawals for <strong>the</strong> communities <strong>of</strong> Dorris,<br />
Macdoel, <strong>and</strong> Tulelake were estimated using recent population<br />
totals <strong>and</strong> a per capita use <strong>of</strong> 150 gallons per day (according<br />
to <strong>the</strong> methods <strong>of</strong> Broad <strong>and</strong> Collins, 1996). Public-supply<br />
systems that served more than 25 people or had at least 15<br />
connections pumped approximately 9.3 Mgal/d (million<br />
gallons per day) or about 14.4 ft 3 /s in 2000. By comparison,<br />
in <strong>the</strong> 5-year period from 1996 through 2000, public supply<br />
withdrawals in <strong>the</strong> basin averaged an estimated 8.2 Mgal/d<br />
(12.7 ft 3 /s). The City <strong>of</strong> <strong>Klamath</strong> Falls, with a population <strong>of</strong><br />
19,400, accounted for 84 percent <strong>of</strong> <strong>the</strong> 2000 total, reporting<br />
withdrawals <strong>of</strong> 7.8 Mgal/d (12.1 ft 3 /s) from 9 city wells. Per<br />
capita use in cities such as <strong>Klamath</strong> Falls is larger than in rural<br />
areas <strong>and</strong> small towns due to <strong>the</strong> larger relative amount <strong>of</strong><br />
commercial, industrial, <strong>and</strong> irrigation included.<br />
<strong>Ground</strong>-<strong>Water</strong> Pumping for Irrigation<br />
In <strong>Oregon</strong>, ground-water pumpage for irrigation was<br />
estimated by matching maps <strong>of</strong> primary <strong>and</strong> supplemental<br />
irrigation ground-water rights to areas that were determined<br />
to be irrigated by using a l<strong>and</strong>-cover data set created from<br />
30-meter resolution L<strong>and</strong>sat satellite imagery taken during<br />
<strong>the</strong> 2000 irrigation season. The L<strong>and</strong>sat image data were<br />
analyzed to help identify vegetation types <strong>and</strong> conditions (such<br />
as <strong>the</strong> stage <strong>of</strong> growth) in a process known as “classification.”<br />
The ground-water rights data sets consisted <strong>of</strong> geographic<br />
information system (GIS) layers showing places <strong>of</strong> use<br />
(POUs) <strong>and</strong> points <strong>of</strong> appropriation (POAs), <strong>and</strong> were<br />
provided by <strong>the</strong> OWRD along with data from <strong>the</strong>ir <strong>Water</strong><br />
Rights Information System. The POUs represent <strong>the</strong> fields<br />
where water is applied under <strong>the</strong> terms <strong>of</strong> <strong>the</strong> water right. That<br />
right might be a primary right for ground-water irrigation,<br />
or a supplemental right under which ground water is used<br />
to supplement a primary surface-water right on <strong>the</strong> same<br />
l<strong>and</strong>. A water-right can cover a single tract or several tracts<br />
not necessarily adjacent to one ano<strong>the</strong>r. POAs correspond to<br />
specific wells at particular locations on ground-water rights.<br />
A single ground-water right may include more than one<br />
well. Pumpage was estimated only for active primary <strong>and</strong><br />
supplemental ground-water rights for irrigation outside <strong>of</strong><br />
irrigation district boundaries. It was assumed that no primary<br />
ground-water rights are in areas included in irrigation districts<br />
within <strong>the</strong> <strong>Klamath</strong> Project, <strong>and</strong> that supplemental groundwater<br />
irrigation within irrigation districts was negligible in<br />
2000.<br />
The POU boundaries were overlaid with <strong>the</strong> l<strong>and</strong>s<br />
determined to be irrigated using <strong>the</strong> classified L<strong>and</strong>sat imagery<br />
(fig. 18). The purpose <strong>of</strong> <strong>the</strong> overlay was to match specific<br />
water rights to irrigated areas shown on <strong>the</strong> l<strong>and</strong>-cover map<br />
developed from <strong>the</strong> imagery. The results reveal which fields<br />
with ground-water rights were actually irrigated during <strong>the</strong><br />
2000 irrigation season. Partial overlay matches, where ei<strong>the</strong>r<br />
<strong>the</strong> irrigated l<strong>and</strong>s from <strong>the</strong> imagery did not completely fill a<br />
POU field boundary or <strong>the</strong> imagery showed many small blocks<br />
<strong>of</strong> irrigated areas within a field boundary, were evaluated<br />
individually <strong>and</strong> <strong>the</strong> acres included or dropped (considered<br />
irrigated or not irrigated) on <strong>the</strong> basis <strong>of</strong> specific criteria.<br />
Any irrigated fields smaller than 3 acres were eliminated.<br />
<strong>Ground</strong>-water pumpage used in irrigated areas was assigned<br />
to a specific well based on water right information. Where<br />
<strong>the</strong> l<strong>and</strong>-cover data showed an obvious irrigated field (for
<strong>Ground</strong>-<strong>Water</strong> <strong>Hydrology</strong> 39<br />
example, from a center pivot) but no matching water right in<br />
<strong>the</strong> GIS data set, a withdrawal location based on <strong>the</strong> centroid<br />
<strong>of</strong> <strong>the</strong> field was used. In total, 19,250 acres <strong>of</strong> cropl<strong>and</strong> in <strong>the</strong><br />
upper <strong>Klamath</strong> <strong>Basin</strong> in <strong>Oregon</strong> was estimated to have been<br />
irrigated with ground water in 2000, or about 30 percent <strong>of</strong><br />
<strong>the</strong> 64,000 acres with <strong>Oregon</strong> primary ground-water rights<br />
evaluated in this analysis.<br />
The estimation method produced a conservative number<br />
<strong>of</strong> irrigated acres <strong>and</strong> points <strong>of</strong> appropriation. The apparent<br />
low percentage <strong>of</strong> ground-water rights exercised in 2000<br />
may be attributable to counting only <strong>the</strong> acres appearing to<br />
be irrigated on L<strong>and</strong>sat images ra<strong>the</strong>r than <strong>the</strong> total acreage<br />
carried on <strong>the</strong> water right, <strong>and</strong> editing criteria that were<br />
more likely to eliminate than include fields where evidence<br />
<strong>of</strong> irrigation was questionable on <strong>the</strong> satellite image. Any<br />
irrigation in areas not included in <strong>the</strong> OWRD digital water<br />
right POU maps is not included in <strong>the</strong> estimate. Estimates<br />
<strong>of</strong> pumpage within irrigation district boundaries under a<br />
pilot water bank <strong>and</strong> similar programs starting in 2001 are<br />
discussed in a separate section<br />
The crop types in areas irrigated with ground water in<br />
<strong>Oregon</strong> were determined from <strong>the</strong> classified L<strong>and</strong>sat satellite<br />
imagery using <strong>the</strong> methodology described in appendix A.<br />
Specific crop types could not be reliably identified using <strong>the</strong><br />
L<strong>and</strong>sat imagery. Five vegetative classes <strong>of</strong> crop types were<br />
identified, however, on <strong>the</strong> basis <strong>of</strong> spectral signatures <strong>and</strong><br />
potential water requirements. The five classes are (1) alfalfa<br />
<strong>and</strong> irrigated grasses, (2) small grains, (3) onions <strong>and</strong> garlic,<br />
(4) potatoes <strong>and</strong> corn, <strong>and</strong> (5) strawberries.<br />
About 40,000 acres were irrigated with ground water in<br />
<strong>the</strong> upper <strong>Klamath</strong> <strong>Basin</strong> in California during 2000. California<br />
water law does not require a permit or approval to withdraw<br />
ground water from wells (California State <strong>Water</strong> Resources<br />
Control Board, 1990). The estimation <strong>of</strong> ground-water<br />
withdrawals in this report relied primarily on data compiled<br />
from a comprehensive l<strong>and</strong> <strong>and</strong> water survey by <strong>the</strong> CDWR’s<br />
Nor<strong>the</strong>rn District in summer 2000 for <strong>the</strong> State water plan<br />
update (Todd Hillaire, CWDR, written commun., April, 28,<br />
2003). For each tract <strong>of</strong> l<strong>and</strong> surveyed, CDWR determined<br />
<strong>the</strong> source <strong>of</strong> water, crop type <strong>and</strong> in most instances, <strong>the</strong> type<br />
<strong>of</strong> irrigation system used. The estimate in this report includes<br />
only those l<strong>and</strong>s assessed through <strong>the</strong> survey as entirely or<br />
partially irrigated with ground water.<br />
Irrigation water use on individual parcels was estimated<br />
based on <strong>the</strong> crop type, acreage, crop-water requirements,<br />
<strong>and</strong> irrigation method used. Alfalfa, pasture, grains, potatoes,<br />
onions, <strong>and</strong> garlic represented <strong>the</strong> predominant crop types,<br />
but mint, sunflowers, strawberries, <strong>and</strong> sugar beets also<br />
were grown. Crop-water requirements were derived using<br />
published data (Cuenca <strong>and</strong> o<strong>the</strong>rs, 1992), evapotranspiration<br />
(ET) totals recorded at Bureau <strong>of</strong> Reclamation Agrimet sites<br />
in <strong>Klamath</strong> Falls <strong>and</strong> Worden, <strong>and</strong> information provided<br />
by State <strong>and</strong> county agricultural agencies. The irrigation<br />
seasons for certain crop types were determined from Agrimet<br />
data, interviews with county <strong>and</strong> State agricultural agencies,<br />
<strong>and</strong> from published crop reports by <strong>the</strong> U.S. Department <strong>of</strong><br />
Agriculture (2004). Sprinkler application efficiency rates<br />
were not field measured but obtained from published sources,<br />
including King <strong>and</strong> o<strong>the</strong>rs (1978) <strong>and</strong> from communication<br />
with State agricultural agents. Efficiencies assigned ranged<br />
from 45 percent for gravity systems, to 75 percent for most<br />
center pivots, to 90 percent for drip systems. Most groundwater<br />
irrigation was done using sprinkler systems. The average<br />
application efficiency was estimated to be about 72 percent.<br />
Withdrawals were computed by dividing <strong>the</strong> crop-water<br />
requirements by <strong>the</strong> irrigation method efficiency.<br />
On l<strong>and</strong>s with primary surface-water rights (outside <strong>of</strong><br />
irrigation districts) <strong>and</strong> supplemental ground-water rights, <strong>the</strong><br />
wells were assumed to have been used <strong>and</strong> were assigned 50<br />
percent <strong>of</strong> <strong>the</strong> computed total irrigation requirement. About<br />
620 acres with supplemental ground-water rights outside<br />
<strong>of</strong> irrigation districts were estimated to have been irrigated<br />
in 2000. This estimate may be conservative for reasons<br />
previously listed.<br />
During <strong>the</strong> 2000 irrigation season, an estimated 150,000<br />
acre-ft <strong>of</strong> ground water was pumped to irrigate about 59,600<br />
acres (table 4 <strong>and</strong> fig. 18). In <strong>Oregon</strong>, 19,200 acres were<br />
irrigated with ground water (about 32 percent <strong>of</strong> <strong>the</strong> total),<br />
<strong>and</strong> 40,400 acres (68 percent <strong>of</strong> <strong>the</strong> total) were irrigated with<br />
ground water in California. Withdrawals in <strong>the</strong> Butte Valley<br />
were about 75,600 acre-ft, or 50 percent <strong>of</strong> <strong>the</strong> total in <strong>the</strong><br />
upper <strong>Klamath</strong> <strong>Basin</strong>. All withdrawals for this subbasin were<br />
in California. Pumpage in <strong>the</strong> upper Lost River subbasin,<br />
which includes Swan Lake, Langell, Yonna, <strong>and</strong> Poe Valleys<br />
in <strong>Oregon</strong>, totaled about 28,800 acre-ft, or 19 percent <strong>of</strong> <strong>the</strong><br />
total withdrawals. All irrigated acres for this subbasin were<br />
in <strong>Oregon</strong>. In <strong>the</strong> Sprague River <strong>Basin</strong>, approximately 11,600<br />
acre-ft <strong>of</strong> water was pumped, about 8 percent <strong>of</strong> <strong>the</strong> total<br />
pumpage in <strong>the</strong> study area. Pumpage in <strong>the</strong> lower Lost River<br />
<strong>and</strong> Lower <strong>Klamath</strong> Lake subbasin, which span both States,<br />
totaled about 28,600 acre-ft, or about 19 percent <strong>of</strong> <strong>the</strong> total<br />
pumpage. <strong>Ground</strong>-water pumpage for irrigation in <strong>the</strong> Wood<br />
River subbasin totaled only about 1,100 acre-ft.<br />
Table 4. Estimated ground-water pumping for irrigation in <strong>the</strong><br />
upper <strong>Klamath</strong> <strong>Basin</strong>, <strong>Oregon</strong> <strong>and</strong> California, during water year<br />
2000.<br />
Subbasin<br />
Area irrigated<br />
with ground water<br />
(acres)<br />
Estimated<br />
pumpage<br />
(acre-feet)<br />
<strong>Upper</strong> Williamson River 2,100 4,600<br />
Sprague River 4,300 11,600<br />
Wood River 360 1,100<br />
<strong>Upper</strong> Lost River 10,500 28,800<br />
Lower Lost River 4,700 11,500<br />
Lower <strong>Klamath</strong> Lake 5,600 17,100<br />
Butte Valley 32,000 75,600<br />
Total (rounded) 59,600 150,000
Creek<br />
40 <strong>Ground</strong>-<strong>Water</strong> <strong>Hydrology</strong> <strong>of</strong> <strong>the</strong> <strong>Upper</strong> <strong>Klamath</strong> <strong>Basin</strong>, <strong>Oregon</strong> <strong>and</strong> California<br />
43°15'<br />
122°30' 15'<br />
138<br />
Tokatee<br />
Falls<br />
Clearwater<br />
D O U G L A S<br />
230<br />
122°00'<br />
DiamondMount<br />
Lake ThielsenBeaver<br />
Marsh<br />
138<br />
97<br />
45'<br />
Chemult<br />
30'<br />
Road<br />
15'<br />
31<br />
Silver<br />
Lake<br />
121°00'<br />
EXPLANATION<br />
Area with primary<br />
ground-water rights<br />
in <strong>Oregon</strong><br />
Area irrigated with<br />
ground water in 2000<br />
Irrigated area within<br />
<strong>the</strong> Bureau <strong>of</strong><br />
Reclamation’s<br />
<strong>Klamath</strong> Project<br />
43°00'<br />
Prospect<br />
45'<br />
62<br />
Cascade<br />
Gorge<br />
30'<br />
15'<br />
42°00'<br />
45'<br />
Butte<br />
Falls<br />
66<br />
Dry Cr<br />
Union<br />
Creek<br />
J A C K S O N<br />
Mt<br />
McLoughlin<br />
Mill Cr<br />
Jenny<br />
Cr<br />
Fall<br />
Cr<br />
<strong>Klamath</strong><br />
Iron<br />
Gate<br />
Res<br />
Montague<br />
Little<br />
Shasta<br />
Lake<br />
<strong>of</strong> <strong>the</strong><br />
Woods<br />
River<br />
River<br />
Annie<br />
Sun<br />
Creek<br />
Creek<br />
S<strong>and</strong><br />
Creek<br />
Wood<br />
River<br />
<strong>Upper</strong><br />
Agency<br />
Lake<br />
<strong>Klamath</strong><br />
Lake<br />
John C. Boyle<br />
Reservoir<br />
Pinehurst Keno<br />
Keno Midl<strong>and</strong><br />
Lincoln<br />
Bogus<br />
Crater Lake<br />
Copco<br />
Lake<br />
Pelican<br />
Butte<br />
Rocky<br />
Point<br />
Edge Cr<br />
<strong>Klamath</strong><br />
Agency<br />
Fort<br />
<strong>Klamath</strong><br />
140<br />
62<br />
Dorris<br />
Butte<br />
Valley<br />
Larkin<br />
Creek<br />
Dam<br />
<strong>Klamath</strong><br />
Strait<br />
66<br />
Lenz<br />
Kirk<br />
Silver<br />
Solomon<br />
Butte<br />
Sprague<br />
Dairy<br />
<strong>Klamath</strong> Falls<br />
Altamont<br />
Lake<br />
Ewauna<br />
Olene<br />
Henley<br />
Lost River<br />
Diversion<br />
Channel<br />
Lower<br />
<strong>Klamath</strong><br />
Lake<br />
Lake<br />
Whitehorse<br />
Spring<br />
McReady<br />
Chiloquin Spring<br />
Narrows<br />
ChiloquinKamkaun<br />
Spring<br />
Modoc<br />
Point<br />
<strong>Klamath</strong> Valley<br />
<strong>Klamath</strong> Hills<br />
Worden<br />
S I S K I Y O U<br />
Red Rock Valley<br />
<strong>Klamath</strong><br />
Marsh<br />
Wildhorse<br />
Ridge<br />
Merrill<br />
Lost<br />
River<br />
Williamson<br />
Sprague<br />
River<br />
Tule<br />
Lake<br />
Sump<br />
River<br />
K L A M AT H<br />
Swan Lake Valley<br />
Yonna Valley<br />
Sheepy Ridge<br />
Taylor<br />
Butte<br />
Lost<br />
Rocky<br />
Ford<br />
River<br />
Bly<br />
Mt<br />
70<br />
Malin<br />
River<br />
Tulelake<br />
Sycan<br />
Bonanza<br />
Yamsay<br />
Mountain<br />
Torrent<br />
Spring<br />
Study<br />
Spodue<br />
Mountain<br />
Bryant Mountain<br />
Langell<br />
Valley<br />
River<br />
Beatty<br />
Yainax<br />
Butte<br />
Lorella<br />
Miller Cr<br />
Clear<br />
Lake<br />
Res<br />
area<br />
Sycan<br />
Marsh<br />
Bly Ridge<br />
N<br />
Bly<br />
Fk<br />
S Fork<br />
Gerber<br />
Reservoir<br />
Willow<br />
Boles<br />
River<br />
Sprague<br />
Summer<br />
Lake<br />
boundary<br />
L A K E<br />
M O D O C<br />
Creek<br />
River<br />
Sprague<br />
Creek<br />
Winter Ridge<br />
120°45'<br />
Summer Lake<br />
Barns Rim<br />
OREGON<br />
CALIFORNIA<br />
Modoc Plateau<br />
31<br />
Gearhart<br />
Mountain<br />
Coleman Rim<br />
Quartz<br />
Mountain<br />
140<br />
41°30'<br />
Shasta River<br />
5<br />
Whitney<br />
Creek<br />
97<br />
Butte<br />
Medicine<br />
Lake<br />
Volcano<br />
Scale 1:1,000,000<br />
5 0 5 10 15 20 MILES<br />
5 0 5 10 15 20 KILOMETERS<br />
139<br />
299<br />
Pit<br />
River<br />
See table <strong>of</strong> contents for mapping sources<br />
Figure 18. Areas irrigated with ground water in <strong>the</strong> upper <strong>Klamath</strong> <strong>Basin</strong>, <strong>Oregon</strong> <strong>and</strong> California, during <strong>the</strong> 2000 water year,<br />
<strong>and</strong> areas with primary ground-water irrigation rights in <strong>Oregon</strong>.<br />
OR19-0048_fig18
<strong>Ground</strong>-<strong>Water</strong> <strong>Hydrology</strong> 41<br />
Recent Increases in <strong>the</strong> Rate <strong>of</strong> <strong>Ground</strong>-<strong>Water</strong><br />
Pumping<br />
The number <strong>of</strong> acres irrigated with ground water in <strong>the</strong><br />
<strong>Oregon</strong> part <strong>of</strong> <strong>the</strong> upper <strong>Klamath</strong> <strong>Basin</strong> increased by about<br />
1,800 acres per year between 1950 <strong>and</strong> 2000. Figure 19<br />
shows that <strong>the</strong> total acres in <strong>the</strong> <strong>Klamath</strong> <strong>Basin</strong> with primary<br />
ground-water rights in <strong>Oregon</strong> increased slowly with time,<br />
with periodic larger increases associated with droughts in <strong>the</strong><br />
late 1960s, late 1970s, <strong>and</strong> early 1990s. Historical information<br />
on ground-water use in California was not readily available.<br />
<strong>Ground</strong>-water withdrawal in <strong>the</strong> entire upper <strong>Klamath</strong><br />
<strong>Basin</strong> during water year 2000 is estimated to have been<br />
about 150,000 acre-ft (table 4). The amounts <strong>of</strong> historical<br />
supplemental ground-water pumping are not known, but<br />
generally are assumed to be a fraction <strong>of</strong> <strong>the</strong> total amount<br />
pumped. The number <strong>of</strong> acres with supplemental ground-water<br />
rights is less than one-half <strong>the</strong> number with primary rights, <strong>and</strong><br />
supplemental ground-water use presumably occurs only during<br />
dry years or parts <strong>of</strong> irrigation seasons when surface water is<br />
not available.<br />
Since 2001, <strong>the</strong>re has been a marked increase in groundwater<br />
pumping in <strong>the</strong> upper <strong>Klamath</strong> <strong>Basin</strong> in response<br />
to changes in surface-water management <strong>and</strong> to a series<br />
<strong>of</strong> consecutive dryer-than-average years. The increase is<br />
largely due to government programs such as Reclamation’s<br />
ground-water acquisition program in 2001 <strong>and</strong> pilot water<br />
bank in 2003, 2004, <strong>and</strong> 2005 designed to augment surfacewater<br />
supplies. The pilot water bank was m<strong>and</strong>ated by <strong>the</strong><br />
2002 NOAA Fisheries Biological Opinion (National Marine<br />
Fisheries Service, 2002) regarding operation <strong>of</strong> <strong>the</strong> <strong>Klamath</strong><br />
Project <strong>and</strong> its effects on <strong>Klamath</strong> River coho salmon.<br />
Pumping for Reclamation programs, which accounts for<br />
most <strong>the</strong> new use, is metered <strong>and</strong> <strong>the</strong>refore reasonably well<br />
quantified. The amounts <strong>of</strong> pumping related to Reclamation<br />
programs are shown in table 5. Flow-meter data provided to<br />
Reclamation by well owners indicates that <strong>the</strong> total amounts<br />
<strong>of</strong> ground water pumped for <strong>the</strong> water bank in 2003 <strong>and</strong> 2004<br />
were approximately 55,700 <strong>and</strong> 75,800 acre-ft respectively.<br />
The reported pumpage for <strong>the</strong> water bank in 2003 represents a<br />
41-percent increase over <strong>the</strong> estimated pumping during 2000<br />
in <strong>the</strong> upper <strong>Klamath</strong> <strong>Basin</strong>. The 2004 pumpage represents<br />
a 56-percent increase. The spatial distribution <strong>of</strong> 2003 <strong>and</strong><br />
2004 water-bank pumping is shown in figure 20. Most <strong>of</strong> this<br />
increased pumping (about 61,000 acre-ft) was in <strong>the</strong> lower<br />
Lost River <strong>and</strong> Lower <strong>Klamath</strong> Lake subbasins. <strong>Ground</strong>-water<br />
pumping in this area prior to 2001 is estimated to be about<br />
28,600 acre-ft. Therefore, <strong>the</strong> additional 61,000 acre-ft <strong>of</strong><br />
water-bank pumping during 2004 represents an approximate<br />
3-fold increase in <strong>the</strong> total ground-water use in that area. The<br />
response to this increased pumping is discussed in <strong>the</strong> section<br />
on hydraulic head fluctuations.<br />
175<br />
150<br />
All ground-water irrigated acres (<strong>Oregon</strong> only)<br />
Acres with primary rights (<strong>Oregon</strong> only)<br />
Acres with supplemental rights (<strong>Oregon</strong> only)<br />
125<br />
ACRES, IN THOUSANDS<br />
100<br />
75<br />
50<br />
25<br />
0<br />
1940<br />
1945<br />
1950<br />
1955<br />
1960<br />
1965<br />
1970<br />
1975<br />
1980<br />
1985<br />
1990<br />
1995<br />
2000<br />
Figure 19. Growth in total acreage with ground-water irrigation rights (primary <strong>and</strong> supplemental) in <strong>the</strong> upper<br />
<strong>Klamath</strong> <strong>Basin</strong> in <strong>Oregon</strong> through 2005.
42 <strong>Ground</strong>-<strong>Water</strong> <strong>Hydrology</strong> <strong>of</strong> <strong>the</strong> <strong>Upper</strong> <strong>Klamath</strong> <strong>Basin</strong>, <strong>Oregon</strong> <strong>and</strong> California<br />
Table 5. <strong>Ground</strong>-water pumping for <strong>the</strong> Bureau <strong>of</strong> Reclamation<br />
pilot water bank <strong>and</strong> ground-water acquisition program, upper<br />
<strong>Klamath</strong> <strong>Basin</strong>, <strong>Oregon</strong> <strong>and</strong> California.<br />
[Data from Bureau <strong>of</strong> Reclamation <strong>and</strong> <strong>Oregon</strong> <strong>Water</strong> Resources Department.<br />
Values in acre-feet]<br />
Source<br />
<strong>Water</strong> year<br />
2001 2002 2003 2004<br />
Reported pumpage from 29,000 0 38,900 62,900<br />
private wells 1<br />
Pumpage from Tule Lake 10,300 18,600 16,800 12,900<br />
Irrigation District wells<br />
Total 2 39,300 18,600 55,700 75,800<br />
1<br />
Includes some irrigation district wells in <strong>Oregon</strong>.<br />
2<br />
Totals include only pumpage related to government sponsored programs.<br />
Hydraulic Head Distribution <strong>and</strong> <strong>Ground</strong>-<strong>Water</strong><br />
Flow Directions<br />
Hydraulic head provides <strong>the</strong> driving force for groundwater<br />
flow. <strong>Ground</strong> water flows from areas <strong>of</strong> high head<br />
toward areas <strong>of</strong> low head. The change <strong>of</strong> head with distance<br />
is referred to as <strong>the</strong> “head gradient.” In <strong>the</strong> uppermost parts <strong>of</strong><br />
aquifer systems, <strong>the</strong> head generally follows topography <strong>and</strong><br />
is highest in upl<strong>and</strong> areas, where recharge typically occurs,<br />
<strong>and</strong> lowest in lowl<strong>and</strong> areas, where ground water typically<br />
discharges to streams. Hydraulic head <strong>of</strong>ten changes with<br />
depth as well as horizontally, so ground-water movement<br />
typically includes a vertical component <strong>of</strong> flow. Vertical head<br />
gradients are downward in recharge areas; as a result, <strong>the</strong><br />
elevation <strong>of</strong> <strong>the</strong> static (nonpumping) water levels in wells in<br />
recharge areas decreases (becomes deeper) with increasing<br />
well depth. Head gradients are typically upward in discharge<br />
areas, causing <strong>the</strong> elevation <strong>of</strong> <strong>the</strong> static water levels in wells<br />
to increase (become shallower) with increasing well depth.<br />
If an upward vertical gradient is sufficient, wells <strong>of</strong> a certain<br />
depth may flow at <strong>the</strong> surface. Flowing artesian wells are<br />
common in parts <strong>of</strong> <strong>the</strong> Wood <strong>and</strong> Sprague River subbasins.<br />
Knowing <strong>the</strong> distribution <strong>of</strong> hydraulic head is critical to<br />
underst<strong>and</strong>ing <strong>the</strong> directions <strong>of</strong> ground-water flow. Figure 21<br />
shows <strong>the</strong> generalized hydraulic head distribution in <strong>the</strong><br />
upper <strong>Klamath</strong> <strong>Basin</strong>. Information used to map hydraulic<br />
head is obtained from water wells, springs, <strong>and</strong> streams.<br />
The static water level in a well represents <strong>the</strong> hydraulic<br />
head in <strong>the</strong> aquifer at <strong>the</strong> depth <strong>of</strong> <strong>the</strong> open interval <strong>of</strong> <strong>the</strong><br />
well. <strong>Water</strong> levels in wells open to more than one aquifer,<br />
or to large vertical thicknesses in a single aquifer, represent<br />
an average <strong>of</strong> <strong>the</strong> heads in <strong>the</strong> open interval. Springs also<br />
provide information on hydraulic head distribution, as springs<br />
represent places where <strong>the</strong> water table intersects l<strong>and</strong> surface.<br />
Large-volume springs provide useful information on <strong>the</strong> head<br />
in <strong>the</strong> regional ground-water flow system. Stream reaches<br />
that gain flow from ground-water discharge also provide<br />
information on <strong>the</strong> hydraulic head distribution <strong>of</strong> <strong>the</strong> groundwater<br />
system. Streams that gain large volumes <strong>of</strong> water due to<br />
ground-water inflow are at or below <strong>the</strong> elevation <strong>of</strong> <strong>the</strong> head<br />
in <strong>the</strong> adjacent aquifer system. The mapping <strong>of</strong> <strong>the</strong> hydraulic<br />
head distribution in <strong>the</strong> upper <strong>Klamath</strong> <strong>Basin</strong> relied upon data<br />
from all <strong>of</strong> <strong>the</strong>se sources. <strong>Water</strong> level measurements from<br />
approximately 1,000 field-located water wells provided most<br />
<strong>of</strong> <strong>the</strong> detailed information in populated parts <strong>of</strong> <strong>the</strong> basin. In<br />
sparsely populated <strong>and</strong> unpopulated parts <strong>of</strong> <strong>the</strong> basin, where<br />
wells are scarce, springs provided much <strong>of</strong> <strong>the</strong> information.<br />
Spring elevations generally were obtained from 1:24,000-<br />
scale topographic maps. Gaining stream reaches were used to<br />
constrain head elevations in <strong>the</strong> Williamson River drainage,<br />
Wood River Valley, <strong>and</strong> in <strong>the</strong> <strong>Klamath</strong> River canyon below<br />
John C. Boyle Dam. Heads shown on figure 21 in <strong>the</strong> Lost<br />
River subbasin from <strong>the</strong> outlet <strong>of</strong> Clear Lake Reservoir<br />
(Malone Dam) to Olene Gap were modified from Grondin<br />
(2004), <strong>and</strong> contours in <strong>the</strong> Butte Valley area were modified<br />
from Wood (1960).<br />
The head distribution depicted in figure 21 is a<br />
generalization. Limited available data prevented mapping<br />
all <strong>the</strong> complexities <strong>of</strong> <strong>the</strong> true head distribution. The map<br />
depicts <strong>the</strong> top <strong>of</strong> <strong>the</strong> saturated zone as closely as possible,<br />
<strong>and</strong> generally represents <strong>the</strong> water-table surface. For low-lying<br />
areas, <strong>the</strong> map is based on static water levels in wells <strong>and</strong> may<br />
not reflect water levels in temporarily saturated soil horizons<br />
in irrigated areas. For <strong>the</strong> Wood River subbasin, <strong>the</strong> map<br />
was drawn using wells penetrating an artesian aquifer, where<br />
<strong>the</strong> heads are locally above l<strong>and</strong> surface. Contours are most<br />
detailed <strong>and</strong> have <strong>the</strong> smallest intervals in areas where data are<br />
plentiful, <strong>and</strong> more generalized with large intervals where data<br />
area sparse.<br />
The highest water-level elevations in <strong>the</strong> upper <strong>Klamath</strong><br />
<strong>Basin</strong> occur in <strong>the</strong> principal recharge areas. These include <strong>the</strong><br />
Cascade Range, <strong>the</strong> highl<strong>and</strong> around Medicine Lake Volcano,<br />
<strong>and</strong> upl<strong>and</strong>s along <strong>the</strong> eastern margin <strong>of</strong> <strong>the</strong> basin, including<br />
Yamsay Mountain, Winter Ridge, Gearhart Mountain, <strong>and</strong><br />
Coleman <strong>and</strong> Barns Rims. <strong>Ground</strong> water flows from <strong>the</strong><br />
Cascade Range eastward toward <strong>the</strong> lower elevations <strong>of</strong> <strong>the</strong><br />
basin. From Crater Lake, head gradients are toward <strong>Klamath</strong><br />
Marsh <strong>and</strong> sou<strong>the</strong>astward toward <strong>the</strong> Wood River valley.<br />
South <strong>of</strong> Crater Lake, ground water flows eastward toward<br />
<strong>the</strong> Wood River Valley <strong>and</strong> <strong>Upper</strong> <strong>Klamath</strong> Lake. Where <strong>the</strong><br />
<strong>Klamath</strong> River cuts through <strong>the</strong> Cascade Range, ground-water<br />
flow is generally parallel to <strong>the</strong> axis <strong>of</strong> <strong>the</strong> range <strong>and</strong> toward<br />
<strong>the</strong> river. From <strong>the</strong> Medicine Lake highl<strong>and</strong>s, ground water<br />
flows generally northward toward Butte Valley <strong>and</strong> <strong>the</strong> Lower<br />
<strong>Klamath</strong> <strong>and</strong> Tule Lake subbasins. Head gradients along <strong>the</strong><br />
eastern margin <strong>of</strong> <strong>the</strong> basin are generally westward. From<br />
Yamsay Mountain, ground water flows westward toward <strong>the</strong><br />
upper Williamson River, <strong>and</strong> sou<strong>the</strong>astward toward Sycan<br />
Marsh. <strong>Ground</strong> water flows from <strong>the</strong> Gearhart Mountain area<br />
generally southwestward toward <strong>the</strong> Sycan <strong>and</strong> Sprague River<br />
drainages. From <strong>the</strong> Barns Rim area, ground water flows<br />
generally toward Gerber Reservoir <strong>and</strong> <strong>the</strong> upper Lost River.<br />
In <strong>the</strong> Modoc Plateau area east <strong>and</strong> south <strong>of</strong> Clear Lake, head<br />
gradients slope westward toward <strong>the</strong> Tule Lake subbasin.
<strong>Ground</strong>-<strong>Water</strong> <strong>Hydrology</strong> 43<br />
122°00' 45' 30' 121°15'<br />
Modoc<br />
Point<br />
Sprague<br />
Sprague<br />
River<br />
River<br />
Beatty<br />
Bly Ridge<br />
42°15'<br />
<strong>Upper</strong><br />
<strong>Klamath</strong><br />
Bly<br />
Mt<br />
Lake<br />
Swan Lake Valley<br />
Yainax<br />
Butte<br />
<strong>Klamath</strong> Falls<br />
Dairy<br />
42°00'<br />
Lake<br />
Ewauna<br />
Keno<br />
Keno<br />
Dam<br />
<strong>Klamath</strong><br />
Strait<br />
Worden<br />
KLAMATH<br />
RIVER<br />
Midl<strong>and</strong><br />
Altamont<br />
Olene<br />
Henley<br />
<strong>Klamath</strong> Hills<br />
<strong>Klamath</strong> Valley<br />
Lost River<br />
Diversion<br />
Channel<br />
Merrill<br />
Lost<br />
Malin<br />
River<br />
Bonanza<br />
Bryant Mountain<br />
Lorella<br />
Miller Cr<br />
Langell<br />
Valley<br />
OREGON<br />
CALIFORNIA<br />
Dorris<br />
Butte<br />
Valley<br />
EXPLANATION<br />
2003 annual estimated pumpage—<br />
In acre-feet per well included<br />
in <strong>the</strong> water bank<br />
Lower<br />
<strong>Klamath</strong><br />
Lake<br />
Sheepy Ridge<br />
Lost<br />
River<br />
Tule<br />
Lake<br />
Sump<br />
Tulelake<br />
Clear<br />
Lake<br />
Res<br />
0–250<br />
41°45'<br />
251–750<br />
751–1500<br />
1501–3000<br />
More than 3000<br />
0 5 10 15 MILES<br />
0 5 10 KILOMETERS<br />
See table <strong>of</strong> contents for mapping sources<br />
Figure 20. Distribution <strong>of</strong> ground-water pumping for <strong>the</strong> Bureau <strong>of</strong> Reclamation pilot water bank during water years 2003 <strong>and</strong><br />
2004, upper <strong>Klamath</strong> <strong>Basin</strong>, <strong>Oregon</strong> <strong>and</strong> California. (Data from Reclamation water bank records <strong>and</strong> OWRD meter readings.)<br />
OR19-0048_fig20a
44 <strong>Ground</strong>-<strong>Water</strong> <strong>Hydrology</strong> <strong>of</strong> <strong>the</strong> <strong>Upper</strong> <strong>Klamath</strong> <strong>Basin</strong>, <strong>Oregon</strong> <strong>and</strong> California<br />
122°00' 45' 30' 121°15'<br />
Modoc<br />
Point<br />
Sprague<br />
Sprague<br />
River<br />
River<br />
Beatty<br />
Bly Ridge<br />
42°15'<br />
<strong>Upper</strong><br />
<strong>Klamath</strong><br />
Bly<br />
Mt<br />
Lake<br />
Swan Lake Valley<br />
Yainax<br />
Butte<br />
<strong>Klamath</strong> Falls<br />
Dairy<br />
42°00'<br />
Lake<br />
Ewauna<br />
Keno<br />
Keno<br />
Dam<br />
<strong>Klamath</strong><br />
Strait<br />
Worden<br />
KLAMATH<br />
RIVER<br />
Midl<strong>and</strong><br />
Altamont<br />
Olene<br />
Henley<br />
<strong>Klamath</strong> Hills<br />
<strong>Klamath</strong> Valley<br />
Lost River<br />
Diversion<br />
Channel<br />
Merrill<br />
Lost<br />
Malin<br />
River<br />
Bonanza<br />
Bryant Mountain<br />
Lorella<br />
Miller Cr<br />
Langell<br />
Valley<br />
OREGON<br />
CALIFORNIA<br />
Dorris<br />
Butte<br />
Valley<br />
EXPLANATION<br />
2004 annual estimated pumpage—<br />
In acre-feet per well included<br />
in <strong>the</strong> water bank<br />
Lower<br />
<strong>Klamath</strong><br />
Lake<br />
Sheepy Ridge<br />
Lost<br />
River<br />
Tule<br />
Lake<br />
Sump<br />
Tulelake<br />
Clear<br />
Lake<br />
Res<br />
0–250<br />
41°45'<br />
251–750<br />
751–1500<br />
1501–3000<br />
More than 3000<br />
0 5 10 15 MILES<br />
0 5 10 KILOMETERS<br />
See table <strong>of</strong> contents for mapping sources<br />
Figure 20.—Continued.<br />
OR19-0048_fig20b
Creek<br />
<strong>Ground</strong>-<strong>Water</strong> <strong>Hydrology</strong> 45<br />
43°15'<br />
43°00'<br />
45'<br />
30'<br />
15'<br />
42°00'<br />
45'<br />
122°30' 15'<br />
138<br />
D O U G L A S<br />
62<br />
Butte<br />
Falls<br />
66<br />
Dry Cr<br />
5000<br />
Prospect<br />
J A C K S O N<br />
Mt<br />
McLoughlin<br />
Mill Cr<br />
4000<br />
3000<br />
Jenny<br />
Cr<br />
4200<br />
<strong>Klamath</strong><br />
Iron<br />
Gate<br />
Res<br />
Little<br />
Pinehurst<br />
Fall<br />
Creek<br />
3000<br />
Bogus<br />
Shasta<br />
Copco<br />
Lake<br />
4000<br />
Diamond<br />
Lake<br />
230<br />
Crater Lake<br />
5000<br />
5000<br />
6000<br />
Lake<br />
<strong>of</strong> <strong>the</strong><br />
Woods<br />
River<br />
Crater<br />
Lake<br />
River<br />
Annie<br />
Pelican<br />
Butte<br />
Rocky<br />
Point<br />
Sun<br />
Creek<br />
John C. Boyle<br />
Reservoir<br />
Edge Cr<br />
5000<br />
122°00'<br />
Mount<br />
Thielsen<br />
4800<br />
4100<br />
Creek<br />
4180<br />
4160<br />
S<strong>and</strong><br />
Creek<br />
Wood<br />
River<br />
4140<br />
4200<br />
<strong>Upper</strong><br />
Agency<br />
Lake<br />
140<br />
138<br />
Fort<br />
<strong>Klamath</strong><br />
4120<br />
4100<br />
Dorris<br />
<strong>Klamath</strong><br />
Lake<br />
66<br />
97<br />
Lenz<br />
45'<br />
Chemult<br />
Silver<br />
Lower<br />
<strong>Klamath</strong><br />
Lake<br />
Lake<br />
Kirk<br />
Solomon<br />
Butte<br />
<strong>Klamath</strong><br />
Agency<br />
Whitehorse<br />
Spring<br />
McReady<br />
62 Chiloquin Spring<br />
Narrows<br />
Chiloquin Kamkaun<br />
Spring<br />
Larkin<br />
Creek<br />
Keno<br />
Keno<br />
Dam<br />
<strong>Klamath</strong><br />
Strait<br />
4240<br />
4220<br />
Miller<br />
Creek<br />
4140<br />
Butte<br />
Valley<br />
5000<br />
4600<br />
4540<br />
Modoc<br />
Point<br />
4140<br />
4220<br />
4080<br />
4120<br />
4520<br />
<strong>Klamath</strong> Valley<br />
<strong>Klamath</strong> Hills<br />
S I S K I Y O U<br />
Red Rock Valley<br />
<strong>Klamath</strong><br />
Marsh<br />
Wildhorse<br />
Ridge<br />
Sprague<br />
Merrill<br />
Lost<br />
River<br />
30'<br />
Williamson<br />
Sprague<br />
River<br />
Tule<br />
Lake<br />
Sump<br />
Sheep<br />
Creek<br />
River<br />
Lost<br />
Road<br />
K L A M AT H<br />
Swan Lake Valley<br />
Yonna Valley<br />
Sheepy Ridge<br />
Taylor<br />
Butte<br />
Dairy<br />
<strong>Klamath</strong> Falls<br />
Lake Ewauna The<br />
Gap<br />
Olene<br />
Lost River<br />
Diversion<br />
Channel<br />
Stukel<br />
Mountain<br />
4080<br />
4400<br />
4200<br />
4600<br />
4040<br />
4060<br />
4500<br />
4700<br />
4120<br />
Poe Valley<br />
4120<br />
4280<br />
5000<br />
Rocky<br />
Ford<br />
River<br />
Bly<br />
Mt<br />
70<br />
Malin<br />
5500<br />
Wickiup<br />
Spring<br />
4300<br />
River<br />
Tulelake<br />
Sycan<br />
Bonanza<br />
15'<br />
Torrent<br />
Spring<br />
Brown<br />
Spring<br />
4120<br />
6000<br />
Study<br />
Bryant Mountain<br />
Langell<br />
Valley<br />
31<br />
Yamsay<br />
Mountain<br />
4340<br />
4140<br />
4200<br />
5500<br />
5000<br />
River<br />
Spodue<br />
Mountain<br />
4900<br />
4800<br />
4500<br />
4400<br />
Beatty<br />
Yainax<br />
Butte<br />
Lorella<br />
5000<br />
Miller Cr<br />
Clear<br />
Lake<br />
Res<br />
Silver<br />
Lake<br />
121°00'<br />
5500<br />
4540<br />
area<br />
Sycan<br />
Marsh<br />
Bly Ridge<br />
N<br />
Bly<br />
Fk<br />
S Fork<br />
Gerber<br />
Reservoir<br />
Willow<br />
Boles<br />
River<br />
Sprague<br />
Well with water-level<br />
measurements<br />
120°45'<br />
Summer<br />
Lake<br />
boundary<br />
L A K E<br />
5000<br />
M O D O C<br />
Creek<br />
River<br />
Sprague<br />
Creek<br />
Winter Ridge<br />
Summer Lake<br />
Barns Rim<br />
140<br />
Modoc Plateau<br />
31<br />
Gearhart<br />
Mountain<br />
Coleman Rim<br />
OREGON<br />
CALIFORNIA<br />
4600<br />
EXPLANATION<br />
Equal elevation <strong>of</strong> water<br />
level contour—<br />
Interval <strong>of</strong> solid lines is<br />
100, 200, 500, <strong>and</strong> 1,000<br />
feet. Interval <strong>of</strong> dotted<br />
lines is 20 feet. Datum<br />
is NGVD 1929.<br />
Direction <strong>of</strong> groundwater<br />
flow<br />
4700<br />
4800<br />
41°30'<br />
Shasta River<br />
5<br />
Whitney<br />
Creek<br />
97<br />
5500<br />
Butte<br />
4400<br />
4600<br />
6000<br />
5500<br />
4800<br />
5500<br />
Medicine<br />
Lake<br />
Volcano<br />
Scale 1:1,000,000<br />
5 0 5 10 15 20 MILES<br />
6000<br />
5 0 5 10 15 20 KILOMETERS<br />
4000<br />
4020<br />
4100<br />
4200<br />
4300<br />
139<br />
4400<br />
4500<br />
299<br />
Pit<br />
River<br />
See table <strong>of</strong> contents for mapping sources<br />
Figure 21. Generalized water-level contours <strong>and</strong> approximate directions <strong>of</strong> regional ground-water flow in <strong>the</strong> upper <strong>Klamath</strong><br />
<strong>Basin</strong>, <strong>Oregon</strong> <strong>and</strong> California.<br />
OR19-0048_fig21
46 <strong>Ground</strong>-<strong>Water</strong> <strong>Hydrology</strong> <strong>of</strong> <strong>the</strong> <strong>Upper</strong> <strong>Klamath</strong> <strong>Basin</strong>, <strong>Oregon</strong> <strong>and</strong> California<br />
Sprague River Subbasin<br />
Hydraulic head data in <strong>the</strong> Sprague River subbasin are<br />
largely limited to valley bottoms <strong>and</strong> are sparse in upl<strong>and</strong><br />
areas. Head data from wells <strong>and</strong> springs indicate regional<br />
ground water flows generally westward from upl<strong>and</strong> areas<br />
around Gearhart Mountain. Between Bly <strong>and</strong> Beatty, ground<br />
water flows toward <strong>the</strong> valley from local recharge areas around<br />
Yainax Butte. <strong>Ground</strong> water also flows toward this part <strong>of</strong> <strong>the</strong><br />
valley from <strong>the</strong> north. These head gradients are consistent with<br />
<strong>the</strong> observed ground-water discharge to <strong>the</strong> river between Bly<br />
<strong>and</strong> Beatty. Head data also show ground water flowing toward<br />
<strong>the</strong> Whisky Creek area from Yainax Butte <strong>and</strong> Bly Mountain.<br />
<strong>Ground</strong> water discharges to streams in <strong>the</strong> Whisky Creek area.<br />
The general pattern <strong>of</strong> ground-water flow toward <strong>the</strong> valley<br />
occurs over most <strong>of</strong> <strong>the</strong> length <strong>of</strong> <strong>the</strong> Sprague River, although<br />
discharge occurs only at specific locations. An upward vertical<br />
head gradient occurs locally in <strong>the</strong> Sprague River Valley.<br />
Numerous flowing artesian wells have been mapped in <strong>the</strong><br />
area between Beatty <strong>and</strong> <strong>the</strong> town <strong>of</strong> Sprague River (Leonard<br />
<strong>and</strong> Harris, 1974). The localized artesian aquifer consists <strong>of</strong><br />
volcanic, fluvial, <strong>and</strong> volcaniclastic deposits confined by finegrained<br />
lacustrine deposits.<br />
Wells are sparse in <strong>the</strong> Sycan River subbasin, so<br />
ground-water flow directions are inferred mostly from spring<br />
altitudes <strong>and</strong> topography. <strong>Ground</strong> water appears to flow from<br />
Winter Ridge <strong>and</strong> upl<strong>and</strong>s south <strong>of</strong> Sycan Marsh generally<br />
westward. <strong>Ground</strong> water flows sou<strong>the</strong>astward toward <strong>the</strong><br />
Sycan River subbasin from Yamsay Mountain. North <strong>of</strong><br />
Spodue Mountain, <strong>the</strong> head gradient is generally northward<br />
toward <strong>the</strong> Sycan River. This is consistent with <strong>the</strong> groundwater<br />
discharge at Torrent Spring. West <strong>and</strong> south <strong>of</strong> Spodue<br />
Mountain, ground water flows generally southward toward<br />
<strong>the</strong> Sprague River subbasin. Piezometer data from Sycan<br />
Marsh show a downward head gradient over most <strong>of</strong> <strong>the</strong> area<br />
(Leslie Bach, The Nature Conservancy, oral commun., 2005).<br />
At <strong>the</strong> nor<strong>the</strong>rn end <strong>of</strong> Sycan Marsh an area on <strong>the</strong> valley<br />
floor contains numerous springs, indicating that upward head<br />
gradients occur locally.<br />
Williamson River Subbasin<br />
The Williamson River originates near Taylor Butte <strong>and</strong><br />
flows generally northward between Yamsay Mountain <strong>and</strong><br />
<strong>the</strong> faulted volcanic upl<strong>and</strong> to <strong>the</strong> west. Two local recharge<br />
areas exist in <strong>the</strong> upper Williamson River drainage. Head<br />
data from wells <strong>and</strong> springs, along with precipitation data,<br />
indicate that Yamsay Mountain is a significant local recharge<br />
area <strong>and</strong> that ground water flows westward from Yamsay<br />
Mountain toward <strong>the</strong> upper Williamson River. Head data,<br />
mostly from springs, indicates that <strong>the</strong> faulted upl<strong>and</strong> west<br />
<strong>of</strong> <strong>the</strong> uppermost Williamson River also is an area <strong>of</strong> local<br />
recharge, <strong>and</strong> that ground water flows from that area eastward<br />
toward <strong>the</strong> Williamson River. Head gradients sloping toward<br />
<strong>the</strong> Williamson River from both <strong>of</strong> <strong>the</strong>se recharge areas causes<br />
<strong>the</strong> river to gain flow due to ground-water discharge in its<br />
uppermost reaches.<br />
Data from wells <strong>and</strong> springs show that <strong>the</strong> head gradient<br />
slopes toward <strong>Klamath</strong> Marsh from recharge areas in <strong>the</strong><br />
Cascade Range. Out on <strong>the</strong> broad plain east <strong>of</strong> <strong>the</strong> Cascade<br />
Range, <strong>the</strong> water table is relatively flat, sloping gently toward<br />
<strong>the</strong> marsh. <strong>Ground</strong>-water flow directions between <strong>Klamath</strong><br />
Marsh <strong>and</strong> Kirk are poorly understood due to <strong>the</strong> lack <strong>of</strong><br />
data. South <strong>of</strong> Kirk <strong>and</strong> west <strong>of</strong> Solomon Butte, a substantial<br />
southward head gradient exists, indicating that ground water<br />
flows from this area toward major discharge (spring) areas<br />
along <strong>the</strong> lower Williamson River <strong>and</strong> tributaries. <strong>Ground</strong><br />
water also appears to flow south <strong>of</strong> Solomon Butte toward<br />
discharge areas along <strong>the</strong> lower Sprague River.<br />
Upward vertical gradients are apparent locally in spring<br />
areas near <strong>the</strong> headwaters <strong>of</strong> <strong>the</strong> Williamson River <strong>and</strong> west<br />
<strong>of</strong> <strong>Klamath</strong> Marsh, where numerous flowing artesian wells<br />
have been mapped. Downward head gradients are apparent in<br />
well data along <strong>the</strong> Williamson River near Sheep Creek <strong>and</strong> in<br />
upl<strong>and</strong>s north <strong>of</strong> <strong>the</strong> marsh. Well 28S/09E-20BAB northwest<br />
<strong>of</strong> <strong>the</strong> marsh had a water-level altitude <strong>of</strong> about 4,510 ft in July<br />
2006, below <strong>the</strong> altitude <strong>of</strong> nearby springs <strong>and</strong> at roughly <strong>the</strong><br />
same altitude as <strong>the</strong> marsh. The water level altitude in well<br />
28S/10E-27DBD was about 4,503 ft in April 2006, several feet<br />
below <strong>the</strong> water level in <strong>the</strong> marsh. This raises <strong>the</strong> possibility<br />
<strong>of</strong> subsurface drainage <strong>of</strong> <strong>the</strong> nor<strong>the</strong>rn part <strong>of</strong> <strong>Klamath</strong> Marsh,<br />
at least during dry climate cycles.<br />
The lower Williamson River (below Kirk) is one <strong>of</strong> <strong>the</strong><br />
most significant ground-water discharge areas in <strong>the</strong> upper<br />
<strong>Klamath</strong> <strong>Basin</strong>. Between its descent from Kirk <strong>and</strong> <strong>the</strong> point<br />
where it emerges onto its delta, <strong>the</strong> Williamson River is largely<br />
confined to a relatively narrow valley. Head gradients slope<br />
toward <strong>the</strong> Williamson River in this area from <strong>the</strong> east <strong>and</strong><br />
west<br />
<strong>Upper</strong> <strong>Klamath</strong> Lake Subbasin<br />
Well <strong>and</strong> spring data show that <strong>the</strong> head gradient<br />
slopes eastward from <strong>the</strong> Cascade Range toward <strong>the</strong> Wood<br />
River Valley north <strong>of</strong> <strong>Upper</strong> <strong>Klamath</strong> Lake. Consequently,<br />
many streams emerging from <strong>the</strong> Cascade Range have large<br />
baseflow, <strong>and</strong> several large springs discharge at <strong>the</strong> western<br />
edge <strong>of</strong> <strong>the</strong> valley. A steep gradient toward <strong>the</strong> basin from <strong>the</strong><br />
east indicates <strong>the</strong> potential for ground-water flow across <strong>the</strong><br />
bounding escarpments from upl<strong>and</strong>s immediately to <strong>the</strong> east.<br />
This gradient from <strong>the</strong> east appears to extend southward at<br />
least to Modoc Point.<br />
A southward hydraulic head gradient from Crater Lake<br />
extends to <strong>the</strong> nor<strong>the</strong>rn edge <strong>of</strong> Agency Lake. Between Crater<br />
Lake <strong>and</strong> <strong>the</strong> nor<strong>the</strong>rn end <strong>of</strong> <strong>the</strong> Wood River Valley, <strong>the</strong><br />
gradient is 100 to 300 ft/mi. The gradient decreases to about<br />
40 ft/mi from <strong>the</strong> nor<strong>the</strong>rn end <strong>of</strong> <strong>the</strong> valley to <strong>the</strong> area <strong>of</strong><br />
Fort <strong>Klamath</strong>, where <strong>the</strong> gradient continues south at less than
<strong>Ground</strong>-<strong>Water</strong> <strong>Hydrology</strong> 47<br />
5 ft/mi. The head altitudes shown in <strong>the</strong> Wood River Valley<br />
on figure 21 represent water bearing strata (generally s<strong>and</strong><br />
<strong>and</strong> pumice) in <strong>the</strong> upper 100–300 ft <strong>of</strong> <strong>the</strong> basin-fill deposits.<br />
These strata are overlain <strong>and</strong> confined by clay layers, resulting<br />
in artesian conditions, with heads above l<strong>and</strong> surface over<br />
much <strong>of</strong> <strong>the</strong> area. This is <strong>the</strong> principal developed aquifer in <strong>the</strong><br />
Wood River Valley.<br />
Little head data exist for <strong>the</strong> ridge east <strong>of</strong> <strong>Upper</strong> <strong>Klamath</strong><br />
Lake; however, springs along <strong>the</strong> margin <strong>of</strong> <strong>Upper</strong> <strong>Klamath</strong><br />
Lake indicate a head gradient toward <strong>the</strong> lake, consistent<br />
with <strong>the</strong> area to <strong>the</strong> north. Head data in <strong>the</strong> Rocky Point area<br />
indicate a gradient toward <strong>the</strong> lake ranging from more than<br />
100 ft/mi in <strong>the</strong> Cascade Range to about 15 ft/mi on <strong>the</strong> valley<br />
floor. The gradients toward <strong>Upper</strong> <strong>Klamath</strong> Lake from <strong>the</strong><br />
north, east, <strong>and</strong> west suggest that ground water is discharging<br />
to <strong>the</strong> lake. South <strong>of</strong> <strong>Upper</strong> <strong>Klamath</strong> Lake, however, <strong>the</strong> head<br />
gradient slopes sou<strong>the</strong>astward toward <strong>the</strong> <strong>Klamath</strong> River<br />
Valley <strong>and</strong> <strong>the</strong> Lower <strong>Klamath</strong> Lake subbasin.<br />
<strong>Upper</strong> Lost River Subbasin<br />
Much <strong>of</strong> head data <strong>and</strong> analysis for <strong>the</strong> upper Lost River<br />
subbasin are from Grondin (2004). The Lost River originates<br />
at Clear Lake Reservoir <strong>and</strong> winds through a complex <strong>of</strong><br />
interconnected structural basins north to Bonanza, west to<br />
Olene Gap, <strong>and</strong> <strong>the</strong>n generally southwestward to Tule Lake.<br />
Head gradients indicate that ground water flows generally<br />
toward <strong>the</strong> upper Lost River Valley from regional recharge<br />
areas to <strong>the</strong> east <strong>and</strong> from local recharge associated with<br />
Bryant Mountain <strong>and</strong> o<strong>the</strong>r upl<strong>and</strong>s surrounding <strong>the</strong> subbasin.<br />
Although data are scarce, ground water appears also to flow<br />
from recharge areas associated with upl<strong>and</strong>s around Yainax<br />
Butte <strong>and</strong> Bly Mountain. The hydraulic head gradient is<br />
exceedingly flat in <strong>the</strong> alluvial valleys <strong>of</strong> <strong>the</strong> upper Lost River<br />
subbasin; however, <strong>the</strong> water-table surface likely is variably<br />
influenced by pumping. Although <strong>the</strong> head gradient in <strong>the</strong><br />
valley is small, it does indicate that ground water moves<br />
generally down valley.<br />
<strong>Ground</strong>-water flow directions in structural valleys<br />
adjacent to <strong>the</strong> upper Lost River subbasin, such as Swan Lake<br />
<strong>and</strong> Yonna Valleys, appear to be generally toward <strong>the</strong> Lost<br />
River. One exception is <strong>the</strong> sou<strong>the</strong>rnmost Poe Valley, where<br />
<strong>the</strong> head gradient slopes steeply southward toward <strong>the</strong> Tule<br />
Lake subbasin. Ano<strong>the</strong>r exception is <strong>the</strong> sou<strong>the</strong>rn part <strong>of</strong><br />
Swan Lake Valley, where <strong>the</strong> gradient appears to slope steeply<br />
toward <strong>the</strong> southwest. The path that ground water follows<br />
out <strong>of</strong> <strong>the</strong> southwestern margin <strong>of</strong> <strong>the</strong> Swan Lake Valley is<br />
unclear, but most likely it is southward toward Olene Gap.<br />
Vertical head gradients are variable in <strong>the</strong> upper<br />
Lost River subbasin. Grondin (2004) evaluated well log<br />
information, geophysical data, <strong>and</strong> water-level measurements,<br />
<strong>and</strong> found downward vertical gradients between basin-fill<br />
sediments <strong>and</strong> <strong>the</strong> underlying basalt to be common along<br />
valley margins <strong>and</strong> upward gradients in valley centers in<br />
<strong>the</strong> eastern Lost River subbasin. Vertical gradients within<br />
<strong>the</strong> sedimentary section or <strong>the</strong> basalt were not common.<br />
Downward vertical gradients were observed in <strong>the</strong> Swan<br />
Lake Valley, but heads in that area generally were above <strong>the</strong><br />
elevation <strong>of</strong> <strong>the</strong> Lost River.<br />
<strong>Klamath</strong> Valley<br />
The <strong>Klamath</strong> Valley area comprises <strong>the</strong> Lost River<br />
drainage from Olene Gap to about Merrill <strong>and</strong> includes <strong>the</strong><br />
area immediately south <strong>of</strong> <strong>Klamath</strong> Falls <strong>and</strong> nor<strong>the</strong>ast <strong>of</strong><br />
<strong>the</strong> <strong>Klamath</strong> Hills. <strong>Ground</strong> water flows into <strong>the</strong> <strong>Klamath</strong><br />
Valley from <strong>the</strong> area <strong>of</strong> <strong>Klamath</strong> Falls <strong>and</strong> <strong>the</strong> upl<strong>and</strong>s to <strong>the</strong><br />
southwest. <strong>Ground</strong> water also flows into <strong>the</strong> <strong>Klamath</strong> Valley<br />
from upl<strong>and</strong>s to <strong>the</strong> nor<strong>the</strong>ast <strong>and</strong> <strong>the</strong> Olene Gap area. Local<br />
recharge creates a gradient toward <strong>the</strong> valley from <strong>the</strong> <strong>Klamath</strong><br />
Hills as well. Within <strong>the</strong> <strong>Klamath</strong> Valley, ground water flows<br />
sou<strong>the</strong>astward toward <strong>the</strong> Tule Lake subbasin. Head gradients<br />
on <strong>the</strong> valley floor are low, averaging 2–3 ft/mi. Sou<strong>the</strong>ast <strong>of</strong><br />
Merrill <strong>and</strong> north <strong>of</strong> Sheepy Ridge, <strong>the</strong> head gradient steepens<br />
to about 20 ft/mi. This steepening coincides with a possible<br />
subsurface extension <strong>of</strong> Sheepy Ridge <strong>and</strong> <strong>the</strong> margin <strong>of</strong> <strong>the</strong><br />
Tule Lake structural basin.<br />
Butte Valley/Red Rock Valley Area<br />
Butte Valley is an internally drained structural basin.<br />
The head distribution in <strong>the</strong> Butte Valley area shown on<br />
figure 21 is modified from Wood (1960) <strong>and</strong> augmented in<br />
adjacent upl<strong>and</strong>s using additional well <strong>and</strong> spring data. Since<br />
<strong>the</strong> creation <strong>of</strong> Wood’s (1960) water-table map, water levels<br />
have declined in parts <strong>of</strong> Butte Valley as much as 15–25 ft in<br />
response to pumping <strong>and</strong> climate. Declines occurred primarily<br />
during 1975–1990 <strong>and</strong> since 2000. The declines appear to be<br />
localized, as water levels have been stable in o<strong>the</strong>r parts <strong>of</strong><br />
Butte Valley. Localized declines since <strong>the</strong> 1950s have changed<br />
<strong>the</strong> configuration <strong>of</strong> <strong>the</strong> water-table surface in Butte Valley,<br />
but have not changed <strong>the</strong> overall regional ground-water flow<br />
directions.<br />
Head data show a steep gradient toward Butte Valley<br />
from volcanic upl<strong>and</strong>s to <strong>the</strong> south <strong>and</strong> west. Gradients from<br />
<strong>the</strong> upl<strong>and</strong>s to <strong>the</strong> south <strong>and</strong> around Medicine Lake Volcano<br />
range from 100 to 300 ft/mi. In <strong>the</strong> lower elevation parts <strong>of</strong> <strong>the</strong><br />
Butte Valley/Red Rock Valley area, gradients flatten markedly<br />
to less than a few feet per mile. <strong>Water</strong>-table altitudes are<br />
between 4,200 <strong>and</strong> 4,230 ft over much <strong>of</strong> this area. The watertable<br />
surface is not smooth, but is affected by local geology,<br />
surface-water hydrology, <strong>and</strong> pumping. There is a regional<br />
nor<strong>the</strong>astward slope to <strong>the</strong> gradient, indicating ground-water<br />
flow from <strong>the</strong> Butte Valley/Red Rock Valley area toward <strong>the</strong><br />
Lower <strong>Klamath</strong> Lake subbasin across <strong>the</strong> intervening upl<strong>and</strong>s.<br />
The gradient steepens beneath <strong>the</strong> intervening upl<strong>and</strong>s to<br />
roughly 50 ft/mi.
48 <strong>Ground</strong>-<strong>Water</strong> <strong>Hydrology</strong> <strong>of</strong> <strong>the</strong> <strong>Upper</strong> <strong>Klamath</strong> <strong>Basin</strong>, <strong>Oregon</strong> <strong>and</strong> California<br />
Lower <strong>Klamath</strong> Lake Subbasin<br />
Lower <strong>Klamath</strong> Lake occupies a structural basin bounded<br />
roughly by <strong>the</strong> <strong>Klamath</strong> River, <strong>the</strong> <strong>Klamath</strong> Hills, upl<strong>and</strong>s<br />
to <strong>the</strong> southwest, <strong>and</strong> Sheepy Ridge. Hydraulic head data<br />
(fig. 21) indicate ground-water flow toward Lower <strong>Klamath</strong><br />
Lake from upl<strong>and</strong>s just north <strong>of</strong> <strong>the</strong> <strong>Klamath</strong> River. There also<br />
is flow from <strong>the</strong> Butte Valley/Red Rock Valley area southwest<br />
<strong>of</strong> <strong>the</strong> basin. Heads in <strong>the</strong> Lower <strong>Klamath</strong> Lake subbasin <strong>and</strong><br />
<strong>Klamath</strong> Valley are similar; however, in <strong>the</strong> <strong>Klamath</strong> Hills,<br />
which separate <strong>the</strong> two subbasins, heads are slightly higher,<br />
indicating local recharge or regional discharge. The higher<br />
heads cause a small gradient toward <strong>the</strong> Lower <strong>Klamath</strong> Lake<br />
subbasin from <strong>the</strong> <strong>Klamath</strong> Hills.<br />
The hydraulic head gradient is very small on <strong>the</strong><br />
floor <strong>of</strong> <strong>the</strong> Lower <strong>Klamath</strong> Lake subbasin, sloping gently<br />
sou<strong>the</strong>astward at 1 to 2 ft/mi over most <strong>of</strong> <strong>the</strong> area. East <strong>of</strong><br />
<strong>the</strong> Lower <strong>Klamath</strong> Lake, near Sheepy Ridge, <strong>the</strong> gradient<br />
steepens to approximately 16 ft/mi toward <strong>the</strong> Tule Lake<br />
subbasin, indicating ground-water flow in that direction. This<br />
is consistent with isotopic data from deep wells in <strong>the</strong> Tule<br />
Lake subbasin, which indicate <strong>the</strong> deep aquifer <strong>the</strong>re contains<br />
a fraction <strong>of</strong> water from <strong>the</strong> Lower <strong>Klamath</strong> Lake subbasin<br />
(Palmer <strong>and</strong> o<strong>the</strong>rs, 2007).<br />
Tule Lake Subbasin<br />
Hydraulic head data from wells shows that ground<br />
water flows toward <strong>the</strong> Tule Lake subbasin from <strong>the</strong> north,<br />
east, <strong>and</strong> west. <strong>Ground</strong> water flows from <strong>the</strong> north from <strong>the</strong><br />
<strong>Klamath</strong> Valley <strong>and</strong> sou<strong>the</strong>rnmost Poe Valley. <strong>Ground</strong> water<br />
flows eastward from <strong>the</strong> Lower <strong>Klamath</strong> Lake subbasin into<br />
<strong>the</strong> Tule Lake subbasin as described in <strong>the</strong> preceding section.<br />
A relatively steep gradient <strong>of</strong> up to 100 ft/mi toward <strong>the</strong><br />
Tule Lake subbasin occurs in <strong>the</strong> Clear Lake area <strong>and</strong> on <strong>the</strong><br />
Modoc Plateau to <strong>the</strong> south. The ground-water flow directions<br />
inferred from hydraulic head gradients are consistent with<br />
isotopic data that suggest that water produced by deep wells<br />
in <strong>the</strong> Tule Lake subbasin originated as recharge in <strong>the</strong> interior<br />
<strong>and</strong> eastern parts <strong>of</strong> <strong>the</strong> upper <strong>Klamath</strong> <strong>Basin</strong> with a probable<br />
component <strong>of</strong> water from <strong>the</strong> Lower <strong>Klamath</strong> Lake subbasin<br />
(Palmer <strong>and</strong> o<strong>the</strong>rs, 2007). Head gradients are small on <strong>the</strong><br />
valley floor, being less than 1 ft/mi in much <strong>of</strong> <strong>the</strong> area.<br />
Analysis by CDWR (Eaves <strong>and</strong> o<strong>the</strong>rs, 2002) indicates that<br />
<strong>the</strong> head gradients in lavas underlying basin-filling sediments<br />
slope gently toward <strong>the</strong> south at 2.5 ft/mi or less. Gradients<br />
are much smaller in <strong>the</strong> shallow water-bearing zones in <strong>the</strong><br />
sedimentary section, <strong>and</strong> are generally toward <strong>the</strong> Tule Lake<br />
Sump. Head data from wells indicate ground-water flow<br />
southward out <strong>of</strong> <strong>the</strong> Tule Lake subbasin, east <strong>of</strong> Medicine<br />
Lake Volcano, toward <strong>the</strong> Pit River <strong>Basin</strong> south <strong>of</strong> <strong>the</strong> study<br />
area.<br />
Subsurface drainage from <strong>the</strong> Tule Lake subbasin is<br />
consistent with historical observations in <strong>the</strong> area, many <strong>of</strong><br />
which were summarized by La Rue (1922). Much <strong>of</strong> this<br />
evidence was manifest prior to <strong>the</strong> draining <strong>of</strong> Tule Lake,<br />
which covered an area <strong>of</strong> about 150 mi 2 prior to draining<br />
(according to a 1905 Reclamation survey map). La Rue cited<br />
Native American accounts <strong>of</strong> a whirlpool in <strong>the</strong> lake, <strong>and</strong><br />
stated that at high stage water discharged into lava flows along<br />
<strong>the</strong> sou<strong>the</strong>rn margin (a phenomenon common in <strong>the</strong> lavas<br />
<strong>of</strong> central <strong>Oregon</strong>). Early efforts to drain <strong>the</strong> lake included<br />
construction <strong>of</strong> pits in <strong>the</strong> lava designed to act as drains. La<br />
Rue noted that silt deposits in <strong>the</strong> lava slope southward, away<br />
from <strong>the</strong> lake. He also considered <strong>the</strong> fact that “waters <strong>of</strong> Tule<br />
Lake are fresh <strong>and</strong> <strong>the</strong> lake bed comparatively free <strong>of</strong> salts” as<br />
pro<strong>of</strong> that <strong>the</strong> lake “in <strong>the</strong> past had an outlet.”<br />
<strong>Klamath</strong> Canyon Area<br />
The <strong>Klamath</strong> Canyon area includes <strong>the</strong> reach <strong>of</strong> <strong>the</strong><br />
<strong>Klamath</strong> River between John C. Boyle <strong>and</strong> Iron Gate Dams.<br />
Along most <strong>of</strong> this reach, <strong>the</strong> river occupies a steep-walled<br />
canyon as it cuts through <strong>the</strong> Cascade Range. The canyon<br />
widens between <strong>the</strong> upper end <strong>of</strong> Copco Lake reservoir <strong>and</strong><br />
Iron Gate Dam, becoming narrow again downstream. Data<br />
from sparse wells <strong>and</strong> numerous springs indicate that ground<br />
water flows toward <strong>the</strong> river throughout <strong>the</strong> <strong>Klamath</strong> Canyon<br />
area.<br />
Fluctuations in Hydraulic Head<br />
Hydraulic head fluctuates with time in response to<br />
external stresses, <strong>the</strong> most important <strong>of</strong> which are variations in<br />
natural recharge from precipitation, pumping, lake stage, <strong>and</strong><br />
recharge from canal leakage. These fluctuations are manifest<br />
as variations in <strong>the</strong> water levels in wells.<br />
<strong>Ground</strong>-water-level fluctuation data are collected by<br />
taking multiple water-level measurements in <strong>the</strong> same well<br />
over a period <strong>of</strong> time. Multiple water-level measurements<br />
are available for 257 wells in <strong>the</strong> upper <strong>Klamath</strong> <strong>Basin</strong>.<br />
Observation wells are monitored periodically by <strong>the</strong> USGS,<br />
OWRD, <strong>and</strong> CDWR. Wells have been monitored for periods<br />
ranging from less than 1 year to more than 50 years, <strong>and</strong><br />
measurements have been made at intervals ranging from once<br />
every 2 hours (using automated recording devices) to a few<br />
times a year. The short-interval measurements effectively<br />
create a continuous record <strong>of</strong> water-level fluctuations.<br />
Ninety-one wells in <strong>the</strong> basin have been monitored by<br />
OWRD, some for periods greater than 50 years. Twenty wells<br />
with relatively long-term (10–50 years) records currently are<br />
being measured by OWRD (fig. 22). Measurements in those<br />
wells generally are made one to four times a year. Sixty-two
Creek<br />
<strong>Ground</strong>-<strong>Water</strong> <strong>Hydrology</strong> 49<br />
43°15'<br />
43°00'<br />
45'<br />
30'<br />
15'<br />
42°00'<br />
45'<br />
122°30' 15'<br />
D O U G L A S<br />
Camp Cr<br />
Scotch Cr<br />
Dry Cr<br />
138<br />
62<br />
Butte<br />
Falls<br />
66<br />
Prospect<br />
J A C K S O N<br />
Mt<br />
McLoughlin<br />
Mill Cr<br />
Jenny<br />
Cr<br />
Little<br />
Fall<br />
Cr<br />
<strong>Klamath</strong><br />
Iron<br />
Gate<br />
Res<br />
Pinehurst<br />
Bogus<br />
Cr<br />
Shasta<br />
Diamond<br />
Lake<br />
Copco<br />
Lake<br />
230<br />
R A N G E<br />
Crater<br />
Lake<br />
C A S C A D E<br />
Spencer<br />
Edge Cr<br />
Lake<br />
<strong>of</strong> <strong>the</strong><br />
Woods<br />
Shovel<br />
River<br />
Cr<br />
Crater<br />
Lake<br />
35S/06E-10ACC<br />
Pelican<br />
Butte<br />
Rocky<br />
Point<br />
Annie<br />
Creek<br />
Sevenmile<br />
122°00'<br />
Scott<br />
Creek<br />
S<strong>and</strong><br />
Creek<br />
Sun<br />
Creek<br />
Cr<br />
Fourmile<br />
Creek<br />
Rock<br />
Creek<br />
River<br />
Creek<br />
Aspen<br />
Lake<br />
John C. Boyle<br />
Reservoir<br />
Mount<br />
Thielsen<br />
138<br />
30S/07E-06AAA<br />
Wood<br />
River<br />
Spring<br />
Creek<br />
Agency<br />
Lake<br />
Keno<br />
Dam<br />
<strong>Klamath</strong><br />
Strait<br />
41S/09E-12AAB<br />
Butte<br />
Valley<br />
Macdoel<br />
Larkin<br />
Creek<br />
Big<br />
Springs<br />
Creek<br />
45'<br />
Lower<br />
<strong>Klamath</strong><br />
Lake<br />
S I S K I Y O U<br />
Red Rock Valley<br />
Jack<br />
Chemult<br />
28S/09E-20BAB<br />
97<br />
Lenz<br />
<strong>Klamath</strong><br />
30'<br />
K L A M AT H<br />
Sprague<br />
Trout Cr<br />
Creek<br />
Wildhorse<br />
Ridge<br />
Fort<br />
<strong>Klamath</strong><br />
Kirk<br />
Solomon<br />
Butte<br />
<strong>Klamath</strong><br />
Agency<br />
Whitehorse<br />
Spring<br />
McReady<br />
62 Chiloquin Spring<br />
Narrows<br />
Chiloquin Kamkaun<br />
Spring<br />
<strong>Klamath</strong> Valley<br />
<strong>Klamath</strong> Hills<br />
Marsh<br />
Yonna Valley<br />
Lost<br />
River<br />
Sheepy Ridge<br />
Williamson<br />
Tule<br />
Lake<br />
Sump<br />
Sheep<br />
Creek<br />
River<br />
Taylor<br />
Butte<br />
Rocky<br />
Ford<br />
River<br />
Lost<br />
Whisky<br />
Creek<br />
River<br />
Long<br />
Sycan<br />
Knot Tablel<strong>and</strong><br />
36S/10E-14ACC<br />
Modoc<br />
<strong>Upper</strong> Point<br />
Sprague<br />
River<br />
<strong>Klamath</strong><br />
36S/11E-20DCA Bly<br />
Mt<br />
38S/09E-17CBC<br />
140 Lake<br />
Keno<br />
Dorris<br />
66<br />
Silver<br />
15'<br />
Yamsay<br />
Mountain<br />
Torrent<br />
Spring<br />
Spodue<br />
Mountain<br />
Bryant Mountain<br />
Creek<br />
River<br />
Brown<br />
Creek<br />
Yainax<br />
Butte<br />
Fivemile<br />
Miller Cr<br />
Clear<br />
Lake<br />
Res<br />
Silver<br />
Lake<br />
Sycan<br />
Marsh<br />
Creek<br />
Meryl<br />
Bly Ridge<br />
121°00'<br />
Fork<br />
EXPLANATION<br />
Wells in <strong>the</strong> <strong>Upper</strong> <strong>Klamath</strong><br />
<strong>Basin</strong><br />
Well monitored quarterly by<br />
USGS<br />
Well equipped with USGS<br />
continuous recorder<br />
<strong>Oregon</strong> <strong>Water</strong> Resources<br />
Department observation<br />
well<br />
California Department <strong>of</strong><br />
<strong>Water</strong> Resources<br />
observation 120°45' well<br />
L A K E<br />
Creek<br />
S Fork<br />
Swan Lake Valley<br />
Dairy<br />
Gerber<br />
<strong>Klamath</strong> Falls<br />
39S/11E-20AAD Reservoir<br />
Lake Ewauna<br />
70 Bonanza<br />
39S/11E-26ABD<br />
Lorella<br />
Olene<br />
39S/12E-35ABB<br />
Lost River<br />
Diversion<br />
39S/12E-35ADD<br />
Channel 40S/11E-11BAD<br />
40S/09E-28ADB 40S/12E-30DCB Langell<br />
Valley<br />
Malin<br />
Merrill<br />
40S/12E-32CDB 41S/14E-08CAA<br />
Tulelake<br />
48N/04E-35L02<br />
46N/01E-06N01<br />
28S/10E-27DBD<br />
Lake<br />
Road<br />
35S/12E-26DCD<br />
Study<br />
31<br />
area<br />
Willow<br />
Boles<br />
M O D O C<br />
River<br />
Sprague<br />
Summer<br />
Lake<br />
boundary<br />
N 36S/14E-25BCB<br />
Beatty<br />
Beatty<br />
Gap<br />
Bly<br />
Deming<br />
Creek<br />
Creek<br />
Cr<br />
Winter Ridge<br />
River<br />
Sprague<br />
Summer Lake<br />
Barns Rim<br />
Modoc Plateau<br />
Gearhart<br />
Mountain<br />
Brownsworth<br />
Creek<br />
140<br />
Coleman Rim<br />
OREGON<br />
CALIFORNIA<br />
31<br />
41°30'<br />
Shasta River<br />
5<br />
Whitney<br />
Creek<br />
97<br />
Butte<br />
Medicine<br />
139<br />
Lake<br />
Volcano<br />
Scale 1:1,000,000<br />
5 0 5 10 15 20 MILES<br />
5 0 5 10 15 20 KILOMETERS<br />
299<br />
Pit<br />
River<br />
See table <strong>of</strong> contents for mapping sources<br />
Figure 22. Selected observation wells in <strong>the</strong> upper <strong>Klamath</strong> <strong>Basin</strong>, <strong>Oregon</strong> <strong>and</strong> California. Location information is only shown<br />
for wells specifically referenced in this report.<br />
OR19-0048_fig22
50 <strong>Ground</strong>-<strong>Water</strong> <strong>Hydrology</strong> <strong>of</strong> <strong>the</strong> <strong>Upper</strong> <strong>Klamath</strong> <strong>Basin</strong>, <strong>Oregon</strong> <strong>and</strong> California<br />
wells were measured quarterly during this study by <strong>the</strong> USGS<br />
for periods ranging from 1 to 6 years (fig. 22). Nineteen wells<br />
were instrumented with continuous recorders, devices that<br />
measure <strong>and</strong> record <strong>the</strong> water-level elevation every 2 hours.<br />
Graphs <strong>of</strong> water-level fluctuations in all <strong>of</strong> <strong>the</strong> wells monitored<br />
by <strong>the</strong> USGS are available on <strong>the</strong> USGS web site (http://<br />
waterdata.usgs.gov/or/nwis/gw). Not all wells monitored in<br />
<strong>the</strong> upper <strong>Klamath</strong> <strong>Basin</strong> are shown in figure 22. Scores <strong>of</strong><br />
additional wells have been or currently are monitored by <strong>the</strong><br />
CDWR <strong>and</strong> <strong>the</strong> OWRD for specific purposes. Data from <strong>the</strong><br />
wells shown in figure 22, which includes all wells monitored<br />
by <strong>the</strong> USGS, provide a comprehensive picture <strong>of</strong> <strong>the</strong> dynamic<br />
nature <strong>of</strong> <strong>the</strong> regional ground-water system.<br />
Climate-Induced Fluctuations<br />
<strong>Water</strong> levels in most wells fluctuate in response to natural,<br />
climate-induced changes in recharge. The greatest response<br />
to climate-induced water-level fluctuations in <strong>the</strong> upper<br />
<strong>Klamath</strong> <strong>Basin</strong> occurs in <strong>the</strong> Cascade Range. The response to<br />
diminished precipitation (<strong>and</strong> hence recharge) in <strong>the</strong> Cascade<br />
Range during <strong>the</strong> current drought cycle is exemplified by <strong>the</strong><br />
hydrograph <strong>of</strong> well 30S/07E-06AAA on <strong>the</strong> lower eastern<br />
flank <strong>of</strong> <strong>the</strong> Crater Lake highl<strong>and</strong>s (fig. 23). The water level in<br />
that well has declined approximately 12 ft since 2000 because<br />
<strong>of</strong> climate-related decreased recharge. On <strong>the</strong> eastern side <strong>of</strong><br />
<strong>the</strong> basin, a similar post-2000 trend exists in well 36S/14E-<br />
25BCB (fig. 24), but <strong>the</strong> magnitude <strong>of</strong> <strong>the</strong> recent decline is<br />
less. A comparison <strong>of</strong> <strong>the</strong>se water-level fluctuations with<br />
precipitation at Crater Lake in <strong>the</strong> Cascade Range (fig. 24)<br />
shows that periods <strong>of</strong> rising ground-water levels generally<br />
correspond to periods <strong>of</strong> increasing precipitation, <strong>and</strong> falling<br />
water-levels correspond to periods <strong>of</strong> decreasing precipitation.<br />
Figure 24 also shows that <strong>the</strong> decadal drought cycles are<br />
responsible for <strong>the</strong> largest water-level fluctuations. During<br />
periods <strong>of</strong> abundant precipitation, <strong>the</strong> rate <strong>of</strong> ground-water<br />
recharge exceeds, at least temporarily, <strong>the</strong> rate <strong>of</strong> discharge.<br />
When ground-water recharge exceeds discharge, <strong>the</strong> amount <strong>of</strong><br />
ground water in storage must increase, causing <strong>the</strong> water table<br />
to rise. During dry periods, in contrast, <strong>the</strong> rate <strong>of</strong> discharge<br />
exceeds <strong>the</strong> rate <strong>of</strong> recharge, <strong>and</strong> ground-water levels decline<br />
as a result.<br />
<strong>Water</strong> table fluctuations in response to variations in<br />
recharge are most prominent in <strong>the</strong> Cascade Range, <strong>the</strong><br />
primary recharge area. Climate-related fluctuations may be<br />
difficult to discern in some interior parts <strong>of</strong> <strong>the</strong> basin, for<br />
two reasons. First, precipitation <strong>and</strong>, hence, recharge are<br />
comparatively small in <strong>the</strong> interior parts <strong>of</strong> <strong>the</strong> basin, so<br />
climate-induced water-level fluctuations are correspondingly<br />
small. Second, water levels in <strong>the</strong>se areas are affected by<br />
ground-water pumping, canal operation, <strong>and</strong> irrigation, <strong>the</strong><br />
effects <strong>of</strong> which can mask <strong>the</strong> climate signal.<br />
186<br />
188<br />
190<br />
DEPTH TO WATER, IN FEET<br />
192<br />
194<br />
196<br />
198<br />
200<br />
J M M J S N J M M J S N J M M J S N J M M J S N J M M J S N J M M J S N<br />
2000 2001 2002 2003 2004 2005<br />
Figure 23.<br />
<strong>Water</strong>-level fluctuations in well 30S/07E-06AAA near Bear Creek nor<strong>the</strong>ast <strong>of</strong> Crater Lake, <strong>Oregon</strong>.
<strong>Ground</strong>-<strong>Water</strong> <strong>Hydrology</strong> 51<br />
DEPTH TO WATER, IN FEET<br />
0<br />
2<br />
4<br />
6<br />
8<br />
10<br />
12<br />
14<br />
16<br />
18<br />
Depth to water in well 36S/14E-25BCB<br />
Cumulative departure from average precipitation at Crater Lake<br />
20<br />
1960 1965 1970 1975 1980 1985 1990 1995 2000<br />
100<br />
80<br />
60<br />
40<br />
20<br />
0<br />
-20<br />
-40<br />
-60<br />
-80<br />
2005 -100<br />
CUMULATIVE DEPARTURE FROM AVERAGE PRECIPITATION, IN INCHES<br />
Figure 24. <strong>Water</strong>-level fluctuations in well 36S/14E-25BCB near Bly <strong>and</strong> <strong>the</strong> cumulative departure from average<br />
precipitation at Crater Lake, <strong>Oregon</strong>.<br />
Pumping-Induced Fluctuations<br />
When a well is pumped, <strong>the</strong> water table near <strong>the</strong> well<br />
declines due to <strong>the</strong> removal <strong>of</strong> ground water from storage.<br />
A conical depression centered on <strong>the</strong> well develops on <strong>the</strong><br />
water table (or potentiometric surface in <strong>the</strong> case <strong>of</strong> a confined<br />
aquifer) <strong>and</strong> exp<strong>and</strong>s until it captures sufficient discharge <strong>and</strong><br />
(or) induces enough new recharge to equal <strong>the</strong> pumping rate.<br />
After pumping ceases, <strong>the</strong> water table recovers as <strong>the</strong> aquifer<br />
returns to pre-pumping conditions. Key factors that determine<br />
<strong>the</strong> magnitude <strong>of</strong> water-table fluctuations caused by pumping<br />
are <strong>the</strong> aquifer characteristics, <strong>the</strong> rate <strong>and</strong> duration <strong>of</strong><br />
pumping, <strong>the</strong> presence <strong>of</strong> aquifer boundaries, <strong>and</strong> <strong>the</strong> number<br />
<strong>of</strong> wells affecting <strong>the</strong> water table in a given area. In aquifers<br />
that have low permeability, pumping-induced water-table<br />
fluctuations can be large <strong>and</strong> even interfere with <strong>the</strong> operation<br />
<strong>of</strong> nearby wells. If <strong>the</strong> long-term average pumping rate exceeds<br />
<strong>the</strong> rate at which <strong>the</strong> aquifer can supply water, water levels will<br />
not recover fully <strong>and</strong> long-term water-level declines will occur.<br />
Seasonal pumping affects many wells throughout <strong>the</strong><br />
upper <strong>Klamath</strong> <strong>Basin</strong>. <strong>Water</strong>-level fluctuations from pumping<br />
generally range from a few feet to 20 ft. Pumping effects<br />
can be seen in <strong>the</strong> hydrographs for a well 35S/12E-26DCD<br />
near Beatty (fig. 25) <strong>and</strong> well 40S/12E-32CDB near Malin<br />
(fig. 26). Hydrographs for both wells have a steep drawdown<br />
curve during <strong>the</strong> summer followed by a broad recovery curve<br />
that rises throughout <strong>the</strong> winter <strong>and</strong> spring. Hydrographs for<br />
<strong>the</strong> wells in figures 25 <strong>and</strong> 26 also show slight year-to-year<br />
declines, probably due to a combination <strong>of</strong> pumping <strong>and</strong><br />
climate.<br />
OR19-0048_fig24<br />
Response to Canal Leakage<br />
<strong>Water</strong>-level fluctuations due to irrigation-canal leakage<br />
occur in many wells throughout <strong>the</strong> irrigated areas in <strong>the</strong><br />
central part <strong>of</strong> <strong>the</strong> study area, with water levels rising<br />
during <strong>the</strong> irrigation season when canals are flowing, <strong>and</strong><br />
falling when canals are dry. The magnitude <strong>of</strong> <strong>the</strong>se annual<br />
fluctuations varies with <strong>the</strong> proximity <strong>of</strong> <strong>the</strong> well to <strong>the</strong><br />
canal, <strong>the</strong> depth <strong>of</strong> <strong>the</strong> well, <strong>and</strong> <strong>the</strong> local geology. Annual<br />
fluctuations due to canal leakage <strong>of</strong> more than 10 ft have been<br />
documented (fig. 27), although fluctuations in <strong>the</strong> range <strong>of</strong> 4 to<br />
5 ft are more common.<br />
The water-level response in well 40S/09E-28ADB<br />
(fig. 27) is an example <strong>of</strong> canal <strong>and</strong> drain influences on wells<br />
open to sedimentary materials. This well is constructed into<br />
late Tertiary sediment on <strong>the</strong> northwest flank <strong>of</strong> <strong>the</strong> <strong>Klamath</strong><br />
Hills, about 900 ft from <strong>the</strong> North Canal. The North Canal is<br />
diverted directly from <strong>the</strong> <strong>Klamath</strong> River <strong>and</strong> operates almost<br />
continuously. Although <strong>the</strong> water-level in <strong>the</strong> well responds<br />
to <strong>the</strong> canal operation nearly year-round, <strong>the</strong> response is<br />
most prevalent during <strong>the</strong> summer irrigation season. Note<br />
that <strong>the</strong> ground-water response to canal leakage was almost<br />
nonexistent in 2001, when no water flowed through <strong>the</strong><br />
<strong>Klamath</strong> Project canals for most <strong>of</strong> <strong>the</strong> irrigation season<br />
(fig. 27).<br />
<strong>Ground</strong>-water levels can respond rapidly to canal<br />
leakage, even at considerable depths, particularly in areas<br />
where fractured lava is <strong>the</strong> predominant rock type. Well<br />
39S/12E-35ABB was constructed to allow separate waterlevel<br />
measurements in two distinct water-bearing intervals.
52 <strong>Ground</strong>-<strong>Water</strong> <strong>Hydrology</strong> <strong>of</strong> <strong>the</strong> <strong>Upper</strong> <strong>Klamath</strong> <strong>Basin</strong>, <strong>Oregon</strong> <strong>and</strong> California<br />
18<br />
19<br />
20<br />
DEPTH TO WATER, IN FEET<br />
21<br />
22<br />
23<br />
24<br />
25<br />
J A J O J A J S J A J O J A J S J A J O J A J O J A J O<br />
1999 2000 2001 2002 2003 2004 2005<br />
Figure 25.<br />
<strong>Water</strong>-level fluctuations in well 35S/12E-26DCD north <strong>of</strong> Beatty, <strong>Oregon</strong>.<br />
145<br />
150<br />
155<br />
DEPTH TO WATER, IN FEET<br />
160<br />
165<br />
170<br />
175<br />
180<br />
J M M J S N J M M J S N J M M J S N J M M J S N J M M J S N J M M J S N<br />
2000 2001 2002 2003 2004 2005<br />
Figure 26.<br />
<strong>Water</strong>-level fluctuations in well 40S/12E-32CDB northwest <strong>of</strong> Malin, <strong>Oregon</strong>.<br />
OR19-0048_fig25
<strong>Ground</strong>-<strong>Water</strong> <strong>Hydrology</strong> 53<br />
35<br />
37<br />
Depth to water in well 40S/9E-28ADB01<br />
Discharge in North Canal<br />
40<br />
35<br />
DEPTH TO WATER, IN FEET<br />
39<br />
41<br />
43<br />
45<br />
30<br />
25<br />
20<br />
15<br />
10<br />
DISCHARGE, IN THOUSANDS OF ACRE FEET<br />
47<br />
5<br />
49<br />
J M M J S N J M M J S N J M M J S N J M M J S N J M M J S N J M M J S N 0<br />
2000 2001 2002 2003 2004 2005<br />
Figure 27. <strong>Water</strong>-level fluctuations in well 40S/09E-28ADB on <strong>the</strong> southwest side <strong>of</strong> <strong>the</strong> <strong>Klamath</strong> Hills, <strong>Oregon</strong>, <strong>and</strong><br />
monthly discharge in <strong>the</strong> nearby North Canal.<br />
The upper interval, which responds primarily to <strong>the</strong> canal<br />
operation, is open from 92 to 516 ft below l<strong>and</strong> surface. The<br />
main water-bearing zone is in pyroclastic material between<br />
305 <strong>and</strong> 360 ft below l<strong>and</strong> surface, <strong>and</strong> is overlain by lava<br />
flows. The water level in <strong>the</strong> upper interval <strong>of</strong> this well<br />
responds in a matter <strong>of</strong> days to <strong>the</strong> operation <strong>of</strong> <strong>the</strong> Langell<br />
Valley Irrigation District canal system (fig. 28). The water<br />
level starts to rise shortly after <strong>the</strong> canals start flowing,<br />
peaking late in <strong>the</strong> irrigation season, <strong>and</strong> dropping soon after<br />
canals are shut <strong>of</strong>f for <strong>the</strong> season. The rapid response <strong>of</strong> <strong>the</strong><br />
water table to canal leakage at such depth likely is due to rapid<br />
downward movement <strong>of</strong> water through interconnected vertical<br />
fractures in <strong>the</strong> lava flows. The lower water-bearing interval in<br />
<strong>the</strong> observation well is open from 950 to 1,005 ft below l<strong>and</strong><br />
surface, <strong>and</strong> is not influenced by canal operation. Both <strong>the</strong><br />
upper <strong>and</strong> lower water-bearing zones in this well respond to<br />
<strong>the</strong> pumping effects <strong>of</strong> nearby wells (fig. 29). Individual wells<br />
can respond to both canal operation <strong>and</strong> pumping.<br />
Response to Lake Stage<br />
As previously discussed, ground water discharges to<br />
<strong>Upper</strong> <strong>Klamath</strong> Lake. The lake, <strong>the</strong>refore, represents a local<br />
boundary to <strong>the</strong> regional ground-water system. As a result,<br />
water levels in most wells near <strong>the</strong> lake track variations in<br />
lake stage. The water-level in well 35S/06E-10ACC (fig. 30),<br />
drilled on <strong>the</strong> lower nor<strong>the</strong>ast flank <strong>of</strong> Pelican Butte, closely<br />
follows <strong>the</strong> stage in <strong>Upper</strong> <strong>Klamath</strong> Lake. The well, about<br />
OR19-0048_fig27<br />
3,500 ft from <strong>the</strong> shoreline <strong>of</strong> <strong>the</strong> lake, is constructed into<br />
layered lava flows that are saturated below a depth <strong>of</strong> about<br />
470 ft (altitude 4,140). Well 38S/09E-17CBC, located near <strong>the</strong><br />
<strong>Oregon</strong> Institute <strong>of</strong> Technology campus in <strong>Klamath</strong> Falls, also<br />
fluctuates with <strong>the</strong> stage <strong>of</strong> <strong>Upper</strong> <strong>Klamath</strong> Lake (fig. 31). The<br />
well is about 5,200 ft from <strong>the</strong> lake, <strong>and</strong> is constructed into<br />
interbedded sediment <strong>and</strong> lava to a total depth <strong>of</strong> 425 ft.<br />
Long-Term <strong>Water</strong>-Table Fluctuations<br />
<strong>Water</strong> levels in wells in <strong>the</strong> upper <strong>Klamath</strong> <strong>Basin</strong> that<br />
have been monitored for several decades show fluctuations in<br />
response to many <strong>of</strong> <strong>the</strong> stresses just discussed. In addition,<br />
measurements in most <strong>of</strong> <strong>the</strong> wells also reflect decadal scale,<br />
wet-dry climate cycles, with some showing <strong>the</strong> effects <strong>of</strong><br />
multiyear pumping stresses. <strong>Water</strong> level trends observed near<br />
Bly (well 36S/14E-25BCB), Bonanza (well 39S/11E-20AAD),<br />
<strong>and</strong> <strong>the</strong> sou<strong>the</strong>rn Langell Valley (well 41S/14E-08CAA)<br />
exemplify areas where ground-water levels are responding<br />
mostly to variations in recharge (climate) (fig. 32), showing<br />
decadal scale fluctuations <strong>of</strong> 4–5 ft.<br />
The ground-water flow system appears to be responding<br />
to prolonged pumping stresses in several o<strong>the</strong>r areas in<br />
<strong>the</strong> upper <strong>Klamath</strong> <strong>Basin</strong>, including <strong>the</strong> area between <strong>the</strong><br />
communities <strong>of</strong> Sprague River <strong>and</strong> Beatty, parts <strong>of</strong> Butte<br />
Valley, south Poe Valley <strong>and</strong> <strong>the</strong> area <strong>of</strong> <strong>the</strong> Shasta View<br />
Irrigation District just north <strong>of</strong> Malin, parts <strong>of</strong> west Langell<br />
Valley, an area east <strong>of</strong> Lorella, <strong>and</strong> <strong>the</strong> <strong>Klamath</strong> Valley.
54 <strong>Ground</strong>-<strong>Water</strong> <strong>Hydrology</strong> <strong>of</strong> <strong>the</strong> <strong>Upper</strong> <strong>Klamath</strong> <strong>Basin</strong>, <strong>Oregon</strong> <strong>and</strong> California<br />
25<br />
30<br />
Canal system <strong>of</strong>f<br />
35<br />
DEPTH TO WATER, IN FEET<br />
40<br />
45<br />
50<br />
Canal system on<br />
55<br />
Deep open interval<br />
Shallow open interval<br />
60<br />
J M M J S N J M M J S N J M M J S N J M M J S N J M M J S N J M M J S N<br />
2000 2001 2002 2003 2004 2005<br />
Figure 28. <strong>Water</strong>-level fluctuations in shallow <strong>and</strong> deep water-bearing zones in double-completion well 39S/12E-<br />
35ABB near Lorella, <strong>Oregon</strong>.<br />
25<br />
51<br />
DEPTH TO WATER, SHALLOW INTERVAL, IN FEET<br />
30<br />
35<br />
40<br />
45<br />
Shallow open interval<br />
52<br />
53<br />
54<br />
55<br />
DEPTH TO WATER, DEEP INTERVAL, IN FEET<br />
Deep open interval<br />
50<br />
APRIL MAY JUNE<br />
2002<br />
JULY AUGUST SEPTEMBER<br />
56<br />
Figure 29. <strong>Water</strong>-level fluctuations in shallow <strong>and</strong> deep water-bearing zones in double-completion well 39S/12E-<br />
35ABB near Lorella, <strong>Oregon</strong>, with time scale exp<strong>and</strong>ed to show effects <strong>of</strong> nearby ground-water pumping.<br />
OR19-0048_fig28
<strong>Ground</strong>-<strong>Water</strong> <strong>Hydrology</strong> 55<br />
4144<br />
4143<br />
ELEVATION, IN FEET ABOVE NGVD29<br />
4142<br />
4141<br />
4140<br />
4139<br />
4138<br />
4137<br />
Stage <strong>of</strong> <strong>Upper</strong> <strong>Klamath</strong> Lake (USGS gage 11507001)<br />
<strong>Water</strong> level elevation in well 35S/06E-10ACC<br />
4136<br />
J A J O J A J S J A J O J A J S J A J O J A J O J A J O<br />
1999 2000 2001 2002 2003 2004 2005<br />
Figure 30.<br />
<strong>Oregon</strong>.<br />
<strong>Water</strong>-level fluctuations in well 35S/06E-10ACC near Pelican Butte <strong>and</strong> stage in <strong>Upper</strong> <strong>Klamath</strong> Lake,<br />
4153<br />
4143<br />
WATER-LEVEL ELEVATION IN WELL, IN FEET ABOVE NGVD29<br />
4152<br />
4151<br />
4150<br />
4149<br />
4148<br />
4147<br />
<strong>Water</strong> level in well 38S/09E-17CBC<br />
Stage <strong>of</strong> <strong>Upper</strong> <strong>Klamath</strong> Lake (USGS gage 11507001)<br />
4146<br />
J M M J S N J M M J S N J M M J S N J M M J S N J M M J S N J M M J S N<br />
2000 2001 2002 2003 2004 2005<br />
Figure 31. <strong>Water</strong>-level fluctuations in well 38S/09E-17CBC in <strong>the</strong> north part <strong>of</strong> <strong>Klamath</strong> Falls <strong>and</strong> stage in <strong>Upper</strong><br />
<strong>Klamath</strong> Lake, <strong>Oregon</strong>.<br />
4142<br />
4141<br />
4140<br />
4139<br />
4138<br />
4137<br />
4136<br />
LAKE-STAGE ELEVATION, IN FEET<br />
OR19-0048_fig30
56 <strong>Ground</strong>-<strong>Water</strong> <strong>Hydrology</strong> <strong>of</strong> <strong>the</strong> <strong>Upper</strong> <strong>Klamath</strong> <strong>Basin</strong>, <strong>Oregon</strong> <strong>and</strong> California<br />
0<br />
2<br />
36S/14E-25BCB<br />
4<br />
6<br />
8<br />
10<br />
12<br />
14<br />
16<br />
18<br />
20<br />
DEPTH TO WATER, IN FEET<br />
60<br />
62<br />
64<br />
66<br />
68<br />
70<br />
72<br />
39S/11E-20AAD<br />
74<br />
10<br />
12<br />
41S/14E-08CCA<br />
14<br />
16<br />
18<br />
20<br />
22<br />
24<br />
1955<br />
1960<br />
1965<br />
1970<br />
1975<br />
1980<br />
1985<br />
1990<br />
1995<br />
2000<br />
2005<br />
26<br />
28<br />
30<br />
Figure 32. <strong>Water</strong>-level fluctuations in wells 36S/14E-25BCB near Bly, 39S/11E-20AAD near Bonanza, <strong>and</strong> 41S/14E-<br />
08CCA in <strong>the</strong> sou<strong>the</strong>rn Langell Valley, <strong>Oregon</strong>.<br />
OR19-0048_fig32
<strong>Ground</strong>-<strong>Water</strong> <strong>Hydrology</strong> 57<br />
<strong>Water</strong> levels in two observation wells near <strong>the</strong> town<br />
<strong>of</strong> Sprague River, 36S/10E-14ACC <strong>and</strong> 36S/11E-20DCA<br />
(fig. 33), have declined over 30 ft since monitoring began<br />
in <strong>the</strong> early 1960s. Leonard <strong>and</strong> Harris (1974) hypo<strong>the</strong>sized<br />
that <strong>the</strong> relatively steady, <strong>and</strong> somewhat localized, longterm<br />
decline represented a loss <strong>of</strong> hydraulic head caused<br />
by discharge from free-flowing wells. The OWRD later<br />
attributed <strong>the</strong> decline, at least in part, to some wells in <strong>the</strong><br />
area constructed in a manner that allowed ground water<br />
from a <strong>the</strong> confined basalt aquifer in <strong>the</strong> lower parts <strong>of</strong> <strong>the</strong><br />
wells to flow uphole <strong>and</strong> into sedimentary units (with lower<br />
head) in shallower parts <strong>of</strong> <strong>the</strong> well bores (<strong>Oregon</strong> <strong>Water</strong><br />
Resources Department, 1987). Borehole geophysical logging<br />
has confirmed <strong>the</strong> interaquifer leakage; however <strong>the</strong> geologic<br />
units receiving <strong>the</strong> leakage appear to be rhyolitic lavas mapped<br />
in <strong>the</strong> area by Sherrod <strong>and</strong> Pickthorn (1992) (Mark Norton,<br />
<strong>Oregon</strong> <strong>Water</strong> Resources Department, unpub. data). For<br />
example, geophysical logs for one nearby well show uphole<br />
interaquifer flow <strong>of</strong> about 200 gal/min into a unit with a<br />
relatively high natural gamma signature indicative <strong>of</strong> silicic<br />
material. The driller described <strong>the</strong> material as “broken lava<br />
rock.” <strong>Water</strong> levels in both wells have been more stable since<br />
<strong>the</strong> mid-1990s (fig. 33), likely owing to <strong>the</strong> ground-water-flow<br />
system beginning to reach a new equilibrium.<br />
<strong>Water</strong> levels in long-term observation well 46N/01E-<br />
06N01 in Butte Valley were stable from <strong>the</strong> 1950s to <strong>the</strong> mid-<br />
1970s (fig. 34). Since 1975, <strong>the</strong> water level has declined about<br />
20 ft. The trend likely reflects increased pumping stresses<br />
during times when precipitation is low, with intermittent times<br />
<strong>of</strong> partial recovery during wet years in <strong>the</strong> mid-1980s <strong>and</strong> mid-<br />
1990s.<br />
An observation well in sou<strong>the</strong>rn Poe Valley (40S/11E-<br />
11BAD) shows a series <strong>of</strong> responses to development from<br />
which it has never fully recovered (fig. 35). Most notable is<br />
<strong>the</strong> water-level decline <strong>of</strong> about 20 ft between 1985 <strong>and</strong> 1995,<br />
a recovery <strong>of</strong> less than 5 ft between 1995 <strong>and</strong> 1998, <strong>and</strong> a<br />
decline <strong>of</strong> about 12 ft since 1998. Ano<strong>the</strong>r observation well<br />
(40S/12E-30DCB) about 3 mi south-sou<strong>the</strong>ast <strong>of</strong> <strong>the</strong> Poe<br />
Valley well, in <strong>the</strong> area <strong>of</strong> <strong>the</strong> Shasta View Irrigation District,<br />
has a similar water-level trend where <strong>the</strong> records overlap from<br />
1994 to present (fig. 35). The total decline in well 40S/12E-<br />
30DCB since 1998, however, is slightly greater at about 19 ft.<br />
The similarity <strong>of</strong> <strong>the</strong> head fluctuations suggests that <strong>the</strong> effects<br />
<strong>of</strong> pumping stresses in both areas may migrate across <strong>the</strong><br />
subbasin boundary.<br />
0<br />
10<br />
36S/10E-14ACC<br />
20<br />
30<br />
40<br />
50<br />
DEPTH TO WATER, IN FEET<br />
60<br />
70<br />
80<br />
90<br />
40<br />
50<br />
60<br />
70<br />
80<br />
90<br />
100<br />
1960<br />
36S/11E-20DCA<br />
1965<br />
1970<br />
1975<br />
1980<br />
1985<br />
1990<br />
1995<br />
2000<br />
2005<br />
Figure 33.<br />
<strong>Water</strong>-level fluctuations in wells 36S/10E-14ACC <strong>and</strong> 36S/11E-20DCA in <strong>the</strong> Sprague River Valley, <strong>Oregon</strong>.
58 <strong>Ground</strong>-<strong>Water</strong> <strong>Hydrology</strong> <strong>of</strong> <strong>the</strong> <strong>Upper</strong> <strong>Klamath</strong> <strong>Basin</strong>, <strong>Oregon</strong> <strong>and</strong> California<br />
0<br />
10<br />
46N/01E-06N01<br />
DEPTH TO WATER, IN FEET<br />
20<br />
30<br />
40<br />
50<br />
60<br />
70<br />
1950<br />
1955<br />
1960<br />
1965<br />
1970<br />
1975<br />
1980<br />
1985<br />
1990<br />
1995<br />
2000<br />
2005<br />
Figure 34.<br />
<strong>Water</strong>-level fluctuations in well 46N/01E-06N01 in Butte Valley, California.<br />
0<br />
10<br />
40S/11E-11BAD<br />
20<br />
30<br />
40<br />
50<br />
DEPTH TO WATER, IN FEET<br />
60<br />
70<br />
80<br />
90<br />
100<br />
190<br />
200<br />
40S/12E-30DCB<br />
210<br />
220<br />
230<br />
240<br />
250<br />
1950<br />
1955<br />
1960<br />
1965<br />
1970<br />
1975<br />
1980<br />
1985<br />
1990<br />
1995<br />
2000<br />
2005<br />
Figure 35. <strong>Water</strong>-level fluctuations in wells 40S/11E-11BAD in <strong>the</strong> sou<strong>the</strong>rn Poe Valley <strong>and</strong> well 40S/12E-30DCB north<br />
<strong>of</strong> Malin, <strong>Oregon</strong>.<br />
OR19-0048_fig34
<strong>Ground</strong>-<strong>Water</strong> <strong>Hydrology</strong> 59<br />
Long-term water-level trends in northwest Langell Valley<br />
<strong>and</strong> east <strong>of</strong> Lorella indicate that pumping stresses in those<br />
areas are periodically greater than average (for <strong>the</strong> area),<br />
probably resulting from <strong>the</strong> occasional use <strong>of</strong> supplemental<br />
ground-water rights. The water level in <strong>the</strong> observation well<br />
in northwest Langell Valley (39S/11E-26ABD) apparently<br />
responded to increased pumping during <strong>the</strong> 1970s, again in <strong>the</strong><br />
early 1990s, <strong>and</strong> again starting in 2001 (fig. 36). The groundwater<br />
flow system nearly recovered after each <strong>of</strong> <strong>the</strong> earlier<br />
cycles. In 2005, <strong>the</strong> water level was about 13 ft below <strong>the</strong> level<br />
measured during 1998, <strong>the</strong> most recent wet period. A trend<br />
similar to that observed in <strong>the</strong> Langell Valley well, but with<br />
a smaller amplitude <strong>of</strong> fluctuation, is seen in <strong>the</strong> long-term<br />
record at well 39S/12E-35ADD, just east <strong>of</strong> Lorella (fig. 36).<br />
The 2005 water level in <strong>the</strong> Lorella well was only about 4 ft<br />
below <strong>the</strong> 1998 measurement. Recharge from canal leakage in<br />
<strong>the</strong> area may also be influencing <strong>the</strong> water-level trend in <strong>the</strong><br />
Lorella well (Grondin, 2004).<br />
Recent pumping stresses in <strong>the</strong> <strong>Klamath</strong> Valley area<br />
are reflected in water levels measured in observation well<br />
41S/09E-12AAB (fig. 37). With <strong>the</strong> exception <strong>of</strong> a sharp<br />
decline in 1970, <strong>the</strong> water-level trend in <strong>the</strong> well appears to<br />
have been in dynamic equilibrium until 2001. The increased<br />
pumping stresses combined with drought contributed to a<br />
water-level decline <strong>of</strong> about 12 ft between 2001 <strong>and</strong> 2004.<br />
Fluctuations in Hydraulic Head in Response to<br />
Recent Increases in <strong>Ground</strong>-<strong>Water</strong> Pumping<br />
Prior to 2001, <strong>the</strong> ground-water system in most <strong>of</strong> <strong>the</strong><br />
upper <strong>Klamath</strong> <strong>Basin</strong> was in a state <strong>of</strong> dynamic equilibrium,<br />
under which water levels rose <strong>and</strong> fell in response to climate<br />
cycles <strong>and</strong> seasonal pumping, but generally without chronic<br />
long-term declines. (<strong>Water</strong> levels in some wells near <strong>the</strong> town<br />
<strong>of</strong> Sprague River [fig. 33] are an exception.) Historically,<br />
water levels declined for several years during droughts, but,<br />
with local exceptions, water levels eventually rose to (or<br />
nearly to) predrought levels during subsequent multiyear<br />
wet periods. Wells generally have been drilled deep enough<br />
<strong>and</strong> pumps set low enough to accommodate <strong>the</strong>se historical<br />
water-level fluctuations. Pumping in <strong>the</strong> upper <strong>Klamath</strong> <strong>Basin</strong><br />
increased an estimated 50 percent starting in 2001 in response<br />
to changes in water management <strong>and</strong> a prolonged drought. The<br />
ground-water system has responded to <strong>the</strong> increased pumping<br />
with water levels showing acute, seasonal, <strong>and</strong> long-term<br />
effects.<br />
Acute effects occur close to pumping wells, generally<br />
within hundreds to thous<strong>and</strong>s <strong>of</strong> feet. These effects typically<br />
are <strong>the</strong> result <strong>of</strong> <strong>the</strong> cone <strong>of</strong> depression <strong>of</strong> <strong>the</strong> pumping<br />
well spreading to neighboring wells, resulting in a decline<br />
in <strong>the</strong> static water levels, sometimes referred to as “well<br />
interference.” These effects typically have a rapid onset <strong>and</strong><br />
dissipate relatively soon after pumping ends.<br />
0<br />
10<br />
39S/11E-26ABD<br />
20<br />
30<br />
DEPTH TO WATER, IN FEET<br />
40<br />
50<br />
30<br />
40<br />
50<br />
60<br />
70<br />
80<br />
1950<br />
39S/12E-35ADD<br />
1955<br />
1960<br />
1965<br />
1970<br />
1975<br />
1980<br />
1985<br />
1990<br />
1995<br />
2000<br />
2005<br />
Figure 36.<br />
<strong>Water</strong>-level fluctuations in wells 39S/11E-26ABD <strong>and</strong> 39S/12E-35ADD in <strong>the</strong> western Langell Valley, <strong>Oregon</strong>.
60 <strong>Ground</strong>-<strong>Water</strong> <strong>Hydrology</strong> <strong>of</strong> <strong>the</strong> <strong>Upper</strong> <strong>Klamath</strong> <strong>Basin</strong>, <strong>Oregon</strong> <strong>and</strong> California<br />
DEPTH TO WATER, IN FEET<br />
130<br />
140<br />
150<br />
160<br />
170<br />
180<br />
41S/09E-12AAB<br />
190<br />
1960 1965 1970 1975 1980 1985 1990 1995 2000<br />
2005<br />
Figure 37.<br />
<strong>Water</strong>-level fluctuations in well 41S/09E-12AAB at <strong>the</strong> sou<strong>the</strong>rn end <strong>of</strong> <strong>the</strong> <strong>Klamath</strong> Hills, <strong>Oregon</strong>.<br />
Seasonal effects reflect <strong>the</strong> general lowering <strong>of</strong> <strong>the</strong><br />
water table over a broad area (several square miles to tens <strong>of</strong><br />
square miles) in response to <strong>the</strong> combined seasonal pumping<br />
<strong>of</strong> multiple wells <strong>and</strong>, in some places, seasonal variations in<br />
recharge. These effects typically build up over <strong>the</strong> irrigation<br />
season <strong>and</strong> largely recover over <strong>the</strong> following winter.<br />
Figure 38 shows seasonal water-level declines between spring<br />
<strong>and</strong> fall 2004 caused by increased pumping in <strong>the</strong> basin. <strong>Water</strong><br />
levels declined more than 10 ft over more than 130 mi 2 <strong>and</strong><br />
more than 20 ft over about 20 mi 2 during <strong>the</strong> 2004 irrigation<br />
season. Declines <strong>of</strong> 10–20 ft are apparent in an area extending<br />
from north <strong>of</strong> <strong>the</strong> <strong>Klamath</strong> Hills, through <strong>the</strong> <strong>Klamath</strong> Valley,<br />
into <strong>the</strong> nor<strong>the</strong>rn <strong>and</strong> eastern parts <strong>of</strong> <strong>the</strong> Tulelake subbasin.<br />
Smaller areas in <strong>the</strong> <strong>Klamath</strong> Valley <strong>and</strong> <strong>the</strong> sou<strong>the</strong>astern part<br />
<strong>of</strong> <strong>the</strong> Tulelake subbasin show seasonal water-level declines<br />
exceeding 20 ft in some wells. Seasonal water-level declines<br />
<strong>of</strong> 1–3 ft were measured in most wells distant from pumping<br />
centers. These widespread declines are due to natural seasonal<br />
fluctuation, possibly amplified by dispersed pumping <strong>and</strong><br />
ongoing drought. Although a general decline in water levels<br />
was measured during this period, levels in some wells that<br />
are hydraulically connected to <strong>the</strong> shallow aquifer system in<br />
<strong>the</strong> basin-fill sediments rose between spring <strong>and</strong> fall, ranging<br />
from a fraction <strong>of</strong> a foot to as much as 3 ft. This is an annual<br />
occurrence entirely due to artificial recharge to <strong>the</strong> shallow<br />
system by canal leakage <strong>and</strong> deep percolation <strong>of</strong> irrigation<br />
water.<br />
Long-term pumping effects refer to <strong>the</strong> lowering <strong>of</strong> <strong>the</strong><br />
water table for more than a season, <strong>of</strong>ten years. Long-term<br />
effects can be caused by both climate <strong>and</strong> pumping stresses.<br />
Long-term water level declines typically occur over broad<br />
regions, such as an entire subbasin. Long-term decline<br />
generally is measured by comparing <strong>the</strong> spring high water<br />
levels each year. Such lowering <strong>of</strong> <strong>the</strong> water table has been<br />
observed over most <strong>of</strong> <strong>the</strong> upper <strong>Klamath</strong> <strong>Basin</strong> since about<br />
2000 because <strong>of</strong> ongoing drought. The only exception is in<br />
shallow aquifers in <strong>the</strong> <strong>Klamath</strong> Project area, where water<br />
levels are maintained by recharge from canal leakage <strong>and</strong><br />
deep percolation <strong>of</strong> irrigation water. Long-term declines due<br />
to pumping have occurred locally in addition to this droughtrelated<br />
decline. Distinguishing pumping related declines from<br />
drought related declines in <strong>the</strong> basin is difficult because <strong>of</strong> <strong>the</strong><br />
scarcity <strong>of</strong> data from previous drought cycles. However, near<br />
<strong>the</strong> town <strong>of</strong> Tulelake, where long-term water-level data exist,<br />
<strong>the</strong> rate <strong>of</strong> <strong>the</strong> year-to-year decline observed in <strong>the</strong> present<br />
drought cycle in well 48N/04E-35L02 appears to be about<br />
twice that observed in <strong>the</strong> most recent previous drought, from<br />
<strong>the</strong> late 1980s through mid-1990s (fig. 39).<br />
OR19-0048_fig37
<strong>Ground</strong>-<strong>Water</strong> <strong>Hydrology</strong> 61<br />
122°00' 45' 30' 121°15'<br />
Modoc<br />
Point<br />
Sprague<br />
Sprague<br />
River<br />
River<br />
Beatty<br />
Bly Ridge<br />
42°15'<br />
<strong>Upper</strong><br />
<strong>Klamath</strong><br />
Bly<br />
Mt<br />
Lake<br />
Swan Lake Valley<br />
Yainax<br />
Butte<br />
<strong>Klamath</strong> Falls<br />
Dairy<br />
42°00'<br />
Lake<br />
Ewauna<br />
Keno<br />
Keno<br />
Dam<br />
<strong>Klamath</strong><br />
Strait<br />
Worden<br />
KLAMATH<br />
RIVER<br />
Midl<strong>and</strong><br />
Altamont<br />
Olene<br />
Henley<br />
<strong>Klamath</strong> Hills<br />
<strong>Klamath</strong> Valley<br />
Lost River<br />
Diversion<br />
Channel<br />
Merrill<br />
Lost<br />
Malin<br />
River<br />
Bonanza<br />
Bryant Mountain<br />
Lorella<br />
Miller Cr<br />
Langell<br />
Valley<br />
OREGON<br />
CALIFORNIA<br />
Dorris<br />
Butte<br />
Valley<br />
Lower<br />
<strong>Klamath</strong><br />
Lake<br />
Sheepy Ridge<br />
Lost<br />
River<br />
Tule<br />
Lake<br />
Sump<br />
Tulelake<br />
Clear<br />
Lake<br />
Res<br />
41°45'<br />
EXPLANATION<br />
Area <strong>of</strong> water-level decline—In feet.<br />
Dashed where approximately located.<br />
10–20<br />
More than 20<br />
Measurement site<br />
0 5 10 15 MILES<br />
0 5 10 KILOMETERS<br />
See table <strong>of</strong> contents for mapping sources<br />
Figure 38. <strong>Water</strong>-level decline between spring <strong>and</strong> fall 2004 in <strong>the</strong> <strong>Klamath</strong> Valley <strong>and</strong> Tule Lake areas, upper <strong>Klamath</strong> <strong>Basin</strong>,<br />
<strong>Oregon</strong> <strong>and</strong> California.<br />
OR19-0048_fig38
62 <strong>Ground</strong>-<strong>Water</strong> <strong>Hydrology</strong> <strong>of</strong> <strong>the</strong> <strong>Upper</strong> <strong>Klamath</strong> <strong>Basin</strong>, <strong>Oregon</strong> <strong>and</strong> California<br />
DEPTH TO WATER, IN FEET<br />
0<br />
10<br />
20<br />
30<br />
40<br />
50<br />
48N/04E-35L02<br />
60<br />
1985 1990 1995 2000 2005<br />
Figure 39.<br />
<strong>Water</strong>-level fluctuations in well 48N/04E-35L02 near <strong>the</strong> town <strong>of</strong> Tulelake, California.<br />
The year-to-year water-level declines can be evaluated<br />
by observing <strong>the</strong> changes in water levels between spring 2001<br />
<strong>and</strong> spring 2004 (fig. 40). Although data are sparse in <strong>the</strong><br />
nor<strong>the</strong>rn part <strong>of</strong> <strong>the</strong> area, measurements show that over <strong>the</strong><br />
3-year period, water levels declined more than 10 ft in deep<br />
water-bearing zones (primarily basalt underlying basin-filling<br />
sediments) over more than 135 mi 2 <strong>of</strong> <strong>the</strong> <strong>Klamath</strong> Valley<br />
<strong>and</strong> nor<strong>the</strong>rn Tule Lake subbasin. Declines exceed 15 ft over<br />
an area <strong>of</strong> about 37 mi 2 encompassing <strong>the</strong> State line in <strong>the</strong><br />
Tule Lake subbasin <strong>and</strong> extending southward to <strong>the</strong> town <strong>of</strong><br />
Tulelake <strong>and</strong> northward to Malin. Declines <strong>of</strong> 10–15 ft during<br />
this period are common north <strong>of</strong> Malin. Declines <strong>of</strong> 5 to 10 ft<br />
are common in <strong>the</strong> sou<strong>the</strong>ast part <strong>of</strong> <strong>the</strong> Tule Lake subbasin.<br />
Levels in three wells on <strong>the</strong> Modoc Plateau sou<strong>the</strong>ast <strong>of</strong> <strong>the</strong><br />
Tule Lake subbasin declined 5 to 10 ft (fig. 40). The decline in<br />
this sou<strong>the</strong>rnmost area, where no new pumping has occurred,<br />
is somewhat enigmatic, but may indicate that effects are<br />
propagating sou<strong>the</strong>astward from pumping centers in <strong>the</strong> Tule<br />
Lake subbasin.<br />
If <strong>the</strong> post-2000 pumping rates continue in <strong>the</strong> future, <strong>the</strong><br />
regional ground-water system possibly will eventually achieve<br />
a new state <strong>of</strong> dynamic equilibrium. This will occur when<br />
<strong>the</strong> depression in <strong>the</strong> water table is large enough to redirect<br />
sufficient regional ground-water flow into <strong>the</strong> area to <strong>of</strong>fset<br />
<strong>the</strong> increased pumping. At equilibrium, however, <strong>the</strong> increased<br />
discharge in <strong>the</strong> area <strong>of</strong> pumping must be <strong>of</strong>fset by decreased<br />
discharge elsewhere, likely manifesting itself as a combination<br />
<strong>of</strong> decreased discharge to adjacent basins <strong>and</strong> decreased<br />
discharge to streams, lakes, <strong>and</strong> wetl<strong>and</strong>s.<br />
Certain details are readily apparent from <strong>the</strong> recently<br />
collected data <strong>and</strong> existing knowledge <strong>of</strong> <strong>the</strong> area. <strong>Ground</strong>water<br />
pumping is accompanied by declines in water levels that<br />
occur at a variety <strong>of</strong> temporal <strong>and</strong> spatial scales. The amount<br />
<strong>of</strong> ground water that can be pumped in a period <strong>of</strong> time will<br />
be determined in part by how much drawdown water users<br />
<strong>and</strong> regulatory agencies will tolerate, <strong>and</strong> in part by how<br />
much interference with streams <strong>and</strong> lakes will be considered<br />
acceptable. The drawdown can be easily measured. Where<br />
drawdowns acutely affect individual springs, <strong>the</strong> effects on<br />
discharge may be easy to measure. However, where <strong>the</strong> effects<br />
are to larger streams or lakes <strong>and</strong> represent a small part <strong>of</strong> <strong>the</strong><br />
overall flow, <strong>the</strong>y usually are difficult to discriminate from<br />
o<strong>the</strong>r fluctuations by measurement. Such effects, however, can<br />
be calculated using computer models or analytical methods.<br />
OR19-0048_fig39
<strong>Ground</strong>-<strong>Water</strong> <strong>Hydrology</strong> 63<br />
122°00' 45' 30' 121°15'<br />
Modoc<br />
Point<br />
Sprague<br />
Sprague<br />
River<br />
River<br />
Beatty<br />
Bly Ridge<br />
42°15'<br />
<strong>Upper</strong><br />
<strong>Klamath</strong><br />
Bly<br />
Mt<br />
Lake<br />
Swan Lake Valley<br />
Yainax<br />
Butte<br />
<strong>Klamath</strong> Falls<br />
Dairy<br />
42°00'<br />
Lake<br />
Ewauna<br />
Keno<br />
Keno<br />
Dam<br />
<strong>Klamath</strong><br />
Strait<br />
Worden<br />
KLAMATH<br />
RIVER<br />
Midl<strong>and</strong><br />
Altamont<br />
Olene<br />
Henley<br />
<strong>Klamath</strong> Hills<br />
<strong>Klamath</strong> Valley<br />
Lost River<br />
Diversion<br />
Channel<br />
Merrill<br />
Lost<br />
Malin<br />
River<br />
Bonanza<br />
Bryant Mountain<br />
Lorella<br />
Miller Cr<br />
Langell<br />
Valley<br />
OREGON<br />
CALIFORNIA<br />
Dorris<br />
Butte<br />
Valley<br />
Lower<br />
<strong>Klamath</strong><br />
Lake<br />
Sheepy Ridge<br />
Lost<br />
River<br />
Tule<br />
Lake<br />
Sump<br />
Tulelake<br />
Clear<br />
Lake<br />
Res<br />
41°45'<br />
EXPLANATION<br />
Area <strong>of</strong> water-level decline—In feet.<br />
Dashed where approximately located.<br />
5–10<br />
10–15<br />
More than 15<br />
Measurement site<br />
0 5 10 15 MILES<br />
0 5 10 KILOMETERS<br />
See table <strong>of</strong> contents for mapping sources<br />
Figure 40.<br />
California.<br />
<strong>Water</strong>-level decline between spring 2001 <strong>and</strong> spring 2004 in <strong>the</strong> <strong>Klamath</strong> Valley <strong>and</strong> Tule Lake areas, <strong>Oregon</strong> <strong>and</strong><br />
OR19-0048_fig40
64 <strong>Ground</strong>-<strong>Water</strong> <strong>Hydrology</strong> <strong>of</strong> <strong>the</strong> <strong>Upper</strong> <strong>Klamath</strong> <strong>Basin</strong>, <strong>Oregon</strong> <strong>and</strong> California<br />
Summary <strong>and</strong> Discussion<br />
The dem<strong>and</strong> for water has increased in recent years in <strong>the</strong><br />
upper <strong>Klamath</strong> <strong>Basin</strong> owing to changes in water management<br />
resulting from endangered species issues. Problems associated<br />
with <strong>the</strong> increased dem<strong>and</strong> have been exacerbated by drought.<br />
As a result, interest has increased in <strong>the</strong> use <strong>of</strong> ground water<br />
<strong>and</strong> in underst<strong>and</strong>ing how <strong>the</strong> regional ground-water system<br />
can be utilized to prevent future water shortages. Until<br />
recently, key aspects <strong>of</strong> <strong>the</strong> regional ground-water system<br />
were not well known, <strong>and</strong> information was insufficient to<br />
make informed ground-water-management decisions. This<br />
report describes part <strong>of</strong> <strong>the</strong> results <strong>of</strong> cooperative efforts by<br />
<strong>the</strong> U.S. Geological Survey <strong>and</strong> <strong>the</strong> <strong>Oregon</strong> <strong>Water</strong> Resources<br />
Department to quantitatively characterize <strong>the</strong> regional groundwater<br />
flow system in <strong>the</strong> upper <strong>Klamath</strong> <strong>Basin</strong> to provide<br />
resource managers <strong>and</strong> basin residents <strong>the</strong> information needed<br />
to make sound resource-management decisions.<br />
The 8,000-square-mile upper <strong>Klamath</strong> <strong>Basin</strong> is semiarid,<br />
with most <strong>of</strong> <strong>the</strong> basin interior receiving less than 20 inches<br />
per year <strong>of</strong> precipitation. Upl<strong>and</strong> areas in <strong>the</strong> basin are<br />
mostly forested, <strong>and</strong> broad river valleys <strong>and</strong> lake basins in<br />
<strong>the</strong> basin interior are largely cultivated or in pasture. Irrigated<br />
agriculture covers roughly 500,000 acres in <strong>the</strong> basin. Of<br />
this area, roughly 190,000 acres are within <strong>the</strong> Bureau <strong>of</strong><br />
Reclamation <strong>Klamath</strong> Project (this does not include refuge<br />
l<strong>and</strong>s in <strong>the</strong> Project area). Most water for <strong>the</strong> <strong>Klamath</strong> Project<br />
comes from <strong>Upper</strong> <strong>Klamath</strong> Lake. A smaller amount <strong>of</strong> l<strong>and</strong> in<br />
<strong>the</strong> basin is irrigated using ground water. In 2000, an estimated<br />
59,600 acres were irrigated using ground water.<br />
The upper <strong>Klamath</strong> <strong>Basin</strong> spans parts <strong>of</strong> <strong>the</strong> Cascade<br />
Range <strong>and</strong> <strong>Basin</strong> <strong>and</strong> Range geologic provinces, <strong>and</strong> is<br />
underlain principally by late Tertiary <strong>and</strong> Quaternary volcanic<br />
rocks. The volcanic deposits in <strong>the</strong> basin are generally<br />
permeable <strong>and</strong> host a substantial regional ground-water<br />
system recharged from precipitation in <strong>the</strong> Cascade Range<br />
<strong>and</strong> upl<strong>and</strong>s within <strong>and</strong> on <strong>the</strong> eastern margin <strong>of</strong> <strong>the</strong> basin.<br />
A prominent system <strong>of</strong> north to northwest trending faults<br />
divides <strong>the</strong> interior parts <strong>of</strong> <strong>the</strong> basin into a series <strong>of</strong> sedimentfilled<br />
structural subbasins. <strong>Ground</strong>-water flow is controlled<br />
by topography, distribution <strong>of</strong> recharge, <strong>the</strong> geometry <strong>of</strong> <strong>the</strong><br />
stream system, <strong>and</strong> <strong>the</strong> geology. The regional geology has<br />
been divided into eight hydrogeologic units on <strong>the</strong> basis <strong>of</strong><br />
<strong>the</strong>ir stratigraphic position <strong>and</strong> broad hydraulic characteristics.<br />
These hydrogeologic units are useful in assessing groundwater<br />
potential <strong>of</strong> specific areas.<br />
Precipitation in <strong>the</strong> upper <strong>Klamath</strong> <strong>Basin</strong> totals<br />
about 10 million acre-feet per year. Most <strong>of</strong> this water<br />
returns to <strong>the</strong> atmosphere at or near where it falls through<br />
evapotranspiration. Roughly 2 million acre-feet per year enter<br />
<strong>the</strong> ground-water system. Most <strong>of</strong> <strong>the</strong> water that enters <strong>the</strong><br />
ground-water system discharges elsewhere in <strong>the</strong> basin to<br />
streams, wells, or through evapotranspiration directly from <strong>the</strong><br />
water table in wetl<strong>and</strong>s.<br />
An estimated 1.8 million acre-feet per year <strong>of</strong> groundwater<br />
discharges to streams. Discharge to streams occurs<br />
throughout <strong>the</strong> basin, but prominent areas <strong>of</strong> groundwater<br />
discharge include <strong>the</strong> flanks <strong>of</strong> <strong>the</strong> Cascade Range,<br />
<strong>the</strong> margins <strong>of</strong> <strong>the</strong> Wood River Valley, <strong>the</strong> area near <strong>the</strong><br />
confluence <strong>of</strong> <strong>the</strong> Williamson <strong>and</strong> Sprague Rivers (including<br />
Spring Creek), <strong>the</strong> upper Williamson River near Yamsay<br />
Mountain, Bonanza Springs on <strong>the</strong> Lost River, <strong>and</strong> <strong>Klamath</strong><br />
River Canyon below John C. Boyle Dam. Much <strong>of</strong> <strong>the</strong><br />
ground-water discharge to streams is through major spring<br />
complexes. <strong>Ground</strong> water flows to streams throughout <strong>the</strong><br />
year, supplying substantial water to streams in <strong>the</strong> basin. For<br />
decades, hydrologists have recognized that much <strong>of</strong> <strong>the</strong> water<br />
flowing into <strong>Upper</strong> <strong>Klamath</strong> Lake originates as ground water<br />
that discharges to tributary streams within 12 miles <strong>of</strong> <strong>the</strong> lake,<br />
or directly to <strong>the</strong> lake.<br />
<strong>Ground</strong>-water discharge to streams is not constant, but<br />
varies seasonally <strong>and</strong> from year to year in response to climate<br />
cycles. In most large spring complexes, such as <strong>the</strong> headwaters<br />
<strong>of</strong> Spring Creek or <strong>the</strong> Wood River, discharge variations due<br />
to longer-term, decadal climate cycles are larger than seasonal<br />
variations. Discharge to major spring complexes, such as<br />
those feeding Wood River <strong>and</strong> Spring Creek may vary by a<br />
factor <strong>of</strong> 2. <strong>Basin</strong>wide, climate-driven ground-water discharge<br />
variations exceed 450 cubic feet per second, a rate that equates<br />
to an annual volume <strong>of</strong> 326,000 acre-feet.<br />
<strong>Ground</strong>-water discharge from wells increased gradually<br />
from <strong>the</strong> late 1940s to about 2000, with small increases in<br />
<strong>the</strong> rate <strong>of</strong> growth related to droughts in <strong>the</strong> late 1970s <strong>and</strong><br />
early 1990s. <strong>Ground</strong>-water pumpage for irrigation in 2000<br />
was about 150,000 acre-feet per year. <strong>Ground</strong>-water use<br />
increased markedly in response to water shortages in 2001 <strong>and</strong><br />
subsequent water-banking efforts. As a result, ground-water<br />
pumpage for irrigation in 2004 was about 226,000 acre-feet<br />
per year.<br />
Hydraulic head data from wells <strong>and</strong> springs shows<br />
that ground water flows from principal recharge areas in<br />
<strong>the</strong> Cascade Range <strong>and</strong> upl<strong>and</strong>s in <strong>the</strong> basin interior <strong>and</strong><br />
eastern margins toward discharge areas in <strong>the</strong> lake basins<br />
<strong>and</strong> stream valleys in <strong>the</strong> basin interior. In addition, head<br />
gradients indicate <strong>the</strong> potential for flow between structural<br />
subbasins in a generally north to south direction. <strong>Ground</strong><br />
water in <strong>the</strong> upper <strong>Klamath</strong> <strong>Basin</strong> generally flows toward two<br />
areas <strong>of</strong> low hydraulic head: <strong>the</strong> <strong>Klamath</strong> River Canyon <strong>and</strong><br />
<strong>the</strong> Tule Lake subbasin. <strong>Ground</strong> water that flows toward <strong>the</strong><br />
<strong>Klamath</strong> River Canyon discharges to <strong>the</strong> river between Keno<br />
<strong>and</strong> John C. Boyle Dam. Some ground water that flows into<br />
<strong>the</strong> Tule Lake subbasin discharges <strong>the</strong>re <strong>and</strong> is removed by<br />
evapotranspiration or pumped to <strong>the</strong> Lower <strong>Klamath</strong> Lake<br />
subbasin. Head gradient data indicate that some ground water<br />
also flows southward out <strong>of</strong> <strong>the</strong> Tule Lake subbasin basin<br />
toward <strong>the</strong> Pit River <strong>Basin</strong>. The amount <strong>of</strong> southward flow<br />
presently is not known.
Acknowledgments 65<br />
Hydraulic head in <strong>the</strong> upper <strong>Klamath</strong> <strong>Basin</strong> fluctuates<br />
primarily in response to climate, pumping, canal <strong>and</strong> irrigation<br />
operations, <strong>and</strong> lake stage. <strong>Basin</strong>wide, climate exerts <strong>the</strong><br />
largest influence on water levels. <strong>Water</strong> levels in upl<strong>and</strong> areas<br />
have declined more than 12 feet between 2000 <strong>and</strong> 2006 in<br />
response to drought conditions; however, <strong>the</strong>y are expected<br />
to rise again when wet conditions return. Because climatedriven<br />
fluctuations affect <strong>the</strong> entire basin, <strong>the</strong>y have <strong>the</strong> largest<br />
influence on <strong>the</strong> hydrologic system <strong>and</strong> are responsible for <strong>the</strong><br />
large variations in ground-water discharge to streams.<br />
<strong>Water</strong> level fluctuations in response to pumping are most<br />
commonly seasonal, with <strong>the</strong> water level declining during<br />
<strong>the</strong> irrigation season <strong>and</strong> recovering more or less fully by<br />
<strong>the</strong> following spring. Prior to 2001, year-to-year water-level<br />
declines due to pumping were rare in <strong>the</strong> upper <strong>Klamath</strong><br />
<strong>Basin</strong>. The large localized increase in pumping that began<br />
in 2001 has resulted in year-to-year declines in <strong>the</strong> <strong>Klamath</strong><br />
Valley <strong>and</strong> Tule Lake subbasin. The total decline between<br />
2001 <strong>and</strong> 2004 exceeds 15 feet in parts <strong>of</strong> <strong>the</strong>se areas <strong>and</strong> is<br />
larger than can be attributed to drought alone. These year-toyear<br />
declines have been accompanied by amplified seasonal<br />
declines. How long it will take water levels to recover fully<br />
after wet climate conditions return <strong>and</strong> pumping stress is<br />
reduced is not known. Data clearly show that pumping stresses<br />
can cause measurable head responses over broad parts <strong>of</strong> <strong>the</strong><br />
ground-water system.<br />
Irrigation <strong>and</strong> canal operation also affect water levels,<br />
particularly in shallow aquifers. <strong>Water</strong> levels in <strong>the</strong>se aquifers<br />
rise at <strong>the</strong> beginning <strong>of</strong> <strong>the</strong> irrigation season <strong>and</strong> decline<br />
during <strong>the</strong> <strong>of</strong>f-season. The magnitude <strong>of</strong> this fluctuation is<br />
generally 5 to 10 feet in <strong>the</strong> main part <strong>of</strong> <strong>the</strong> <strong>Klamath</strong> Project.<br />
<strong>Water</strong> levels in wells near <strong>Upper</strong> <strong>Klamath</strong> Lake fluctuate in<br />
concert with lake stage.<br />
This study was intended to develop an underst<strong>and</strong>ing <strong>of</strong><br />
<strong>the</strong> regional ground-water flow system in <strong>the</strong> upper <strong>Klamath</strong><br />
<strong>Basin</strong> to help resource managers <strong>and</strong> basin residents develop<br />
a strategy for managing ground water. Developing a groundwater<br />
management strategy for <strong>the</strong> upper <strong>Klamath</strong> <strong>Basin</strong> will<br />
require consideration <strong>of</strong> general characteristics <strong>of</strong> groundwater<br />
flow <strong>and</strong> characteristics unique to <strong>the</strong> upper <strong>Klamath</strong><br />
<strong>Basin</strong>. Generally, increases in <strong>the</strong> rate <strong>of</strong> pumping from<br />
a ground-water system will eventually be <strong>of</strong>fset by ei<strong>the</strong>r<br />
increased rates <strong>of</strong> recharge or (more likely) diminished rates<br />
<strong>of</strong> discharge. Mechanisms whereby ground-water recharge<br />
is increased by pumping are rare. In some circumstances, <strong>the</strong><br />
lowering <strong>of</strong> hydraulic head caused by pumping could cause<br />
increased leakage from streams to <strong>the</strong> ground-water system.<br />
Conditions where this could occur in <strong>the</strong> upper <strong>Klamath</strong> <strong>Basin</strong><br />
are rare. Pumping ground water near basin boundaries can<br />
cause <strong>the</strong> boundaries to shift, effectively capturing recharge<br />
from adjacent basins. However, only a fraction <strong>of</strong> <strong>the</strong> pumpage<br />
would be made up by flow from adjacent basins given likely<br />
pumping locations. Diminishment <strong>of</strong> discharge is <strong>the</strong> more<br />
likely consequence <strong>of</strong> ground-water extraction. Most <strong>of</strong> <strong>the</strong><br />
decrease would be in ground-water discharge to streams,<br />
although reductions in discharge to phreatophytes (riparian or<br />
wetl<strong>and</strong> vegetation with roots that extend to <strong>the</strong> water table)<br />
<strong>and</strong> in flows <strong>of</strong> ground water moving out <strong>of</strong> <strong>the</strong> basin in <strong>the</strong><br />
subsurface could occur as well.<br />
The timing <strong>and</strong> distribution <strong>of</strong> <strong>the</strong> effects <strong>of</strong> groundwater<br />
use are dictated to a large degree by <strong>the</strong> location <strong>of</strong><br />
pumping. Pumping very near to discharge areas, such as<br />
springs, can diminish <strong>the</strong> flow <strong>of</strong> <strong>the</strong> springs relatively quickly.<br />
There have been several instances (with varying amounts <strong>of</strong><br />
documentation) where ground-water pumping has affected<br />
spring discharge in <strong>the</strong> upper <strong>Klamath</strong> <strong>Basin</strong>. Springs affected<br />
by pumping in <strong>the</strong> past include those in Bonanza, elsewhere<br />
in <strong>the</strong> Lost River subbasin, <strong>and</strong> near Whisky Creek in <strong>the</strong><br />
Sprague River subbasin.<br />
<strong>Ground</strong> water is a major component <strong>of</strong> streamflow in<br />
<strong>the</strong> upper <strong>Klamath</strong> <strong>Basin</strong>, <strong>and</strong>, consequently, ground-water<br />
development has <strong>the</strong> potential to affect streamflow. Because<br />
<strong>the</strong> rate, spatial distribution, <strong>and</strong> variability <strong>of</strong> ground-water<br />
discharge in <strong>the</strong> upper <strong>Klamath</strong> <strong>Basin</strong> is now well understood,<br />
ground-water management strategies can be developed that<br />
minimize <strong>the</strong> effects <strong>of</strong> ground-water use.<br />
Recently, a considerable effort has been made by various<br />
agencies, including <strong>the</strong> U.S. Geological Survey, <strong>the</strong> <strong>Oregon</strong><br />
<strong>Water</strong> Resources Department, <strong>the</strong> California Department <strong>of</strong><br />
<strong>Water</strong> Resources, <strong>and</strong> <strong>the</strong> Bureau <strong>of</strong> Reclamation, to monitor<br />
ground-water levels <strong>and</strong> ground-water discharge in <strong>the</strong><br />
upper <strong>Klamath</strong> <strong>Basin</strong>. This information has been valuable in<br />
developing <strong>the</strong> present underst<strong>and</strong>ing <strong>of</strong> <strong>the</strong> regional groundwater<br />
system <strong>and</strong> its response to natural <strong>and</strong> human-caused<br />
stresses. Continued data collection will be important in <strong>the</strong><br />
future to quantify <strong>the</strong> response <strong>of</strong> <strong>the</strong> ground-water system to<br />
stresses.<br />
Acknowledgments<br />
The authors gratefully acknowledge <strong>the</strong> support <strong>of</strong> <strong>the</strong><br />
residents <strong>of</strong> <strong>the</strong> upper <strong>Klamath</strong> <strong>Basin</strong>, particularly <strong>the</strong> many<br />
hundreds <strong>of</strong> individuals who allowed access to property <strong>and</strong><br />
wells for water-level measurements <strong>and</strong> monitoring over <strong>the</strong><br />
course <strong>of</strong> several years. Our underst<strong>and</strong>ing <strong>of</strong> <strong>the</strong> groundwater<br />
hydrology <strong>of</strong> <strong>the</strong> upper <strong>Klamath</strong> <strong>Basin</strong> benefited<br />
tremendously from many hours <strong>of</strong> discussions with l<strong>and</strong><br />
owners <strong>and</strong> scientists working in <strong>the</strong> basin, who freely shared<br />
observations, insights, <strong>and</strong> valuable data. Particular thanks go<br />
to Noel Eaves <strong>and</strong> Bill Ehorn <strong>of</strong> <strong>the</strong> California Department <strong>of</strong><br />
<strong>Water</strong> Resources; Jon Hicks, John Rasmussen, <strong>and</strong> Tom Perry<br />
<strong>of</strong> <strong>the</strong> Bureau <strong>of</strong> Reclamation; Jerry Grondin <strong>and</strong> Ned Gates<br />
<strong>of</strong> <strong>the</strong> <strong>Oregon</strong> <strong>Water</strong> Resources Department; Tim Mayer <strong>of</strong><br />
<strong>the</strong> U.S. Fish <strong>and</strong> Wildlife Service; Mike Stansbury <strong>of</strong> <strong>Water</strong><br />
<strong>and</strong> Energy Services (WESCORP); Steve Luxton <strong>of</strong> W&H<br />
Pacific; Toni Boyd <strong>and</strong> John Lund <strong>of</strong> <strong>the</strong> <strong>Oregon</strong> Institute <strong>of</strong><br />
Technology Geo-Heat Center; <strong>and</strong> <strong>the</strong> staffs <strong>of</strong> <strong>the</strong> <strong>Klamath</strong><br />
National Wildlife Refuges Complex <strong>and</strong> Lava Beds National<br />
Monument. Our underst<strong>and</strong>ing <strong>of</strong> <strong>the</strong> geology <strong>of</strong> <strong>the</strong> region
66 <strong>Ground</strong>-<strong>Water</strong> <strong>Hydrology</strong> <strong>of</strong> <strong>the</strong> <strong>Upper</strong> <strong>Klamath</strong> <strong>Basin</strong>, <strong>Oregon</strong> <strong>and</strong> California<br />
benefited from discussions with Mike Cummings <strong>of</strong> Portl<strong>and</strong><br />
State University, Frank Hladky, Margi Jenks, <strong>and</strong> Ian Madin<br />
<strong>of</strong> <strong>the</strong> <strong>Oregon</strong> Department <strong>of</strong> Geology <strong>and</strong> Mineral Industries,<br />
<strong>and</strong> Dave Sherrod <strong>of</strong> <strong>the</strong> U.S. Geological Survey. Part <strong>of</strong> <strong>the</strong><br />
<strong>Oregon</strong> <strong>Water</strong> Resources Department contribution to this<br />
project was funded through grant assistance from <strong>the</strong> Bureau<br />
<strong>of</strong> Reclamation <strong>Klamath</strong> <strong>Basin</strong> Area Office.<br />
References Cited<br />
Adam, D.P., Bradbury, J.P., Rieck, H.J., <strong>and</strong> Sarna-Wojcicki,<br />
A.M., 1990, Environmental changes in <strong>the</strong> Tule Lake<br />
basin, Siskiyou <strong>and</strong> Modoc Counties, California, from 3<br />
to 2 million years before present: U.S. Geological Survey<br />
Bulletin 1933, 13 p.<br />
Almy, R. B., 1977, Report on pump test <strong>of</strong> Hill irrigation<br />
well <strong>and</strong> interference with Modoc Billy Springs, <strong>Klamath</strong><br />
County, <strong>Oregon</strong>: <strong>Oregon</strong> <strong>Water</strong> Resources Department<br />
unpublished internal memor<strong>and</strong>um, unpaginated.<br />
Anderson, J.R., Hardy, E.E., Roach, J.T., <strong>and</strong> Witmer, R.E.,<br />
1976. A l<strong>and</strong> use <strong>and</strong> l<strong>and</strong> cover classification system<br />
for use with remote sensor data: U.S. Geological Survey<br />
Pr<strong>of</strong>essional Paper 964, 28 p.<br />
Benson, S.M., Sammel, E.A., Solbau, R.D., <strong>and</strong> Lai, C.H.,<br />
1984a, Interpretation <strong>of</strong> aquifer test data, in Sammel, E.A.<br />
ed., Analysis <strong>and</strong> interpretation <strong>of</strong> data obtained in tests<br />
<strong>of</strong> <strong>the</strong> geo<strong>the</strong>rmal aquifer at <strong>Klamath</strong> Falls, <strong>Oregon</strong>: U.S.<br />
Geological Survey <strong>Water</strong>-Resources Investigations Report<br />
84-4216, p. 5.1-5.55.<br />
Benson, S.M., Janik, C.J., Long, D.C., Solbau, R.D., Lienau,<br />
P.J., Culver, G.G., Sammel, E.A., Swanson, S.R., Hart,<br />
D.N., Yee, Andrew, White, A.F., Stallard, M.L., Brown,<br />
S.P., Wheeler, M.C., Winnett, T.L., Fong, Grace, <strong>and</strong> Eakin,<br />
G.B., 1984b, Data from pumping <strong>and</strong> injection tests <strong>and</strong><br />
chemical sampling in <strong>the</strong> geo<strong>the</strong>rmal aquifer at <strong>Klamath</strong><br />
Falls, <strong>Oregon</strong>: U.S. Geological Survey Open-File Report<br />
84-146, 101 p.<br />
Boyd, T. G., 1996, <strong>Ground</strong>water recharge <strong>of</strong> <strong>the</strong> middle<br />
Deschutes <strong>Basin</strong>, <strong>Oregon</strong>: M.S. Thesis, Portl<strong>and</strong> State<br />
University, 86 p.<br />
Broad, T.M., <strong>and</strong> Collins. C.A., 1996, Estimated water-use <strong>and</strong><br />
general hydrologic conditions for <strong>Oregon</strong>, 1985-1990: U.S.<br />
Geological Survey <strong>Water</strong> Resources Investigations Report<br />
96-4080, 166 p.<br />
Bureau <strong>of</strong> Reclamation, 1954, <strong>Upper</strong> <strong>Klamath</strong> <strong>Basin</strong>, <strong>Oregon</strong>-<br />
California—A comprehensive departmental report on <strong>the</strong><br />
development <strong>of</strong> water <strong>and</strong> related resources: Sacramento,<br />
California, variously paginated, separate appendices.<br />
Bureau <strong>of</strong> Reclamation, 2005, Natural flow <strong>of</strong> <strong>the</strong> upper<br />
<strong>Klamath</strong> River: Bureau <strong>of</strong> Reclamation Technical Service<br />
Center, Denver, Colorado, 77 p. plus attachments.<br />
Burt, Charles, <strong>and</strong> Freeman, Beau, 2003, <strong>Klamath</strong> <strong>Basin</strong><br />
Investigation-Hydrologic assessment <strong>of</strong> <strong>the</strong> <strong>Upper</strong> <strong>Klamath</strong><br />
<strong>Basin</strong>-Issues <strong>and</strong> opportunities-Draft report: San Luis<br />
Obispo, California, California Polytechnic State University,<br />
Irrigation Training <strong>and</strong> Research Center (ITRAC), Prepared<br />
for <strong>the</strong> U.S. Bureau <strong>of</strong> Reclamation, May, 2003, variously<br />
paged.<br />
CH2M-Hill, 1992, <strong>Ground</strong>water development potential for two<br />
proposed Tenaska electrical generating facilities at Malin<br />
<strong>and</strong> Bonanza, <strong>Oregon</strong>: prepared for Tenaska, Inc., May,<br />
1992 Draft, variously paged.<br />
CH2M-Hill, 1994, <strong>Ground</strong>water development potential <strong>and</strong><br />
hydrogeologic assessment for <strong>the</strong> Lorella Pumped Storage<br />
Project <strong>Klamath</strong> County, <strong>Oregon</strong>, CH2M-Hill, Appendix<br />
E.2.(a): prepared for Energy Storage Partners, March, 1994,<br />
variously paged.<br />
CH2M-Hill, 2002, Deep aquifer testing at <strong>the</strong> COB Energy<br />
Facility water supply well-<strong>Water</strong> supply supplemental data<br />
report-Final report: Portl<strong>and</strong>, <strong>Oregon</strong>, prepared for Peoples<br />
Energy Resources, November, 2002, variously paged.<br />
California Department <strong>of</strong> <strong>Water</strong> Resources, 1963, Nor<strong>the</strong>astern<br />
counties ground-water investigation, Volume I-Text: State<br />
<strong>of</strong> California Department <strong>of</strong> <strong>Water</strong> Resources Bulletin 98,<br />
246 p.<br />
California Department <strong>of</strong> <strong>Water</strong> Resources, 1998, Butte Valley<br />
Wildlife Area well interference investigation: California<br />
Department <strong>of</strong> <strong>Water</strong> Resources Nor<strong>the</strong>rn District,<br />
December, 1998, 102 p<br />
California State <strong>Water</strong> Resources Control Board, 1990,<br />
California State <strong>Water</strong> Resources Control Board information<br />
pertaining to water rights in California—1990: Accessed<br />
at http://www.waterrights.ca.gov/forms/app-geninfo.pdf on<br />
3/2/06, 18 p.<br />
Carlson, H.L., <strong>and</strong> Todd, Rodney, 2003, Effects <strong>of</strong> <strong>the</strong> 2001<br />
water allocation decisions on <strong>the</strong> agricultural l<strong>and</strong>scape <strong>and</strong><br />
crop production in <strong>the</strong> <strong>Klamath</strong> Reclamation Project, in<br />
Braunworth, W.S., Jr., Welch, Teresa, <strong>and</strong> Hathaway, Ron,<br />
eds., <strong>Water</strong> allocation in <strong>the</strong> <strong>Klamath</strong> Reclamation Project:<br />
an assessment <strong>of</strong> natural resource, economic, social, <strong>and</strong><br />
institutional issues with a focus on <strong>the</strong> upper <strong>Klamath</strong><br />
<strong>Basin</strong>, <strong>Oregon</strong> State University Extension Service Special<br />
Report 1037, p. 163-167,<br />
Cooper, R.M., 2002, Determining surface water availability<br />
in <strong>Oregon</strong>: <strong>Oregon</strong> <strong>Water</strong> Resources Department Open File<br />
Report SW 02-02, 157 p.
References Cited 67<br />
Cooper, R.M., 2004, Natural Flow estimates for streams in <strong>the</strong><br />
<strong>Klamath</strong> <strong>Basin</strong>: <strong>Oregon</strong> <strong>Water</strong> Resources Department Open-<br />
File Report SW 04-001 23 p. plus appendixes.<br />
Cuenca, R.H., Nuss, J.L., Martinez-Cob, Antonio, Katul, G.G.,<br />
<strong>and</strong> Faci-Gonzalez, J. M., 1992, <strong>Oregon</strong> crop water use <strong>and</strong><br />
irrigation requirements: <strong>Oregon</strong> State University Extension<br />
Miscellaneous 8530, 184 p.<br />
Driscoll, F.G., 1986, <strong>Ground</strong>water <strong>and</strong> wells: Johnson<br />
Division, St. Paul, 1089 p.<br />
Eaves, J.N., Ehorn, William, Lawrence, Seth, <strong>and</strong> Ward,<br />
Michael, 2002, <strong>Upper</strong> <strong>Klamath</strong> <strong>Basin</strong> Tulelake subbasin<br />
hydrogeologic investigation (Draft report): California<br />
Department <strong>of</strong> <strong>Water</strong> Resources, Nor<strong>the</strong>rn District,<br />
variously paginated.<br />
Fetter, C.W., 1980, Applied hydrogeology: Columbus, Ohio,<br />
Charles E. Merrill Publishing Co. 488 p.<br />
Forcella, L.S., 1982, Whisky Creek aquifer test, <strong>Klamath</strong><br />
County, <strong>Oregon</strong>: <strong>Oregon</strong> <strong>Water</strong> Resources Department<br />
unpublished report, 21 p., plus figures <strong>and</strong> tables.<br />
Freeze, R. A., <strong>and</strong> Cherry, J. A., 1979, <strong>Ground</strong>water: Prentice-<br />
Hall, Englewood Cliffs, N.J., 604 p.<br />
Gannett, M.W., Lite, K.E., Jr., Morgan, D.S., <strong>and</strong> Collins,<br />
C.A., 2001, <strong>Ground</strong>-water hydrology <strong>of</strong> <strong>the</strong> <strong>Upper</strong><br />
Deschutes <strong>Basin</strong>, <strong>Oregon</strong>: U.S. Geological Survey <strong>Water</strong>-<br />
Resources Investigations Report 00-4162, 77 p.<br />
Gates, E.B., 2001, <strong>Ground</strong> water hydrology <strong>of</strong> four proposed<br />
project areas in <strong>the</strong> <strong>Klamath</strong> <strong>Basin</strong>, <strong>Oregon</strong>: State <strong>of</strong> <strong>Oregon</strong><br />
<strong>Water</strong> Resources Department <strong>Ground</strong> <strong>Water</strong> Open File<br />
Report 01-01, 56 p. plus appendices, 4 plates, <strong>and</strong> 2 maps.<br />
Gay, T.E., Jr., <strong>and</strong> Aune, Q.A., 1958, Geologic map <strong>of</strong><br />
California, Olaf P. Jenkins edition, Alturas sheet: California<br />
Division <strong>of</strong> Mines <strong>and</strong> Geology, 2 sheets, scale 1:250,000.<br />
Golder Associates, Inc., 2002, <strong>Ground</strong>water development<br />
Lower <strong>Klamath</strong> National Wildlife Refuge: Redmond,<br />
Washington, Golder Associates, Inc., prepared for <strong>Water</strong><br />
<strong>and</strong> Energy Services (WESCORP), Mercer Isl<strong>and</strong>,<br />
Washington, 993-1683-004.002 (0219mk1.doc), February<br />
19, 2002, 20 p. plus tables, figures, <strong>and</strong> appendices.<br />
Grondin, G.H., 2004. <strong>Ground</strong> water in <strong>the</strong> eastern Lost River<br />
sub-basin, Langell, Yonna, Swan Lake, <strong>and</strong> Poe Valleys <strong>of</strong><br />
Sou<strong>the</strong>astern <strong>Klamath</strong> County, <strong>Oregon</strong><br />
Hammond, P.E., 1983, Volcanic formations along <strong>the</strong> <strong>Klamath</strong><br />
River near Copco Lake, Siskiyou County: California<br />
Geology, v. 36. no. 5, p. 99-109.<br />
Heath, R.C., 1983, Basic ground-water hydrology: U.S.<br />
Geological Survey <strong>Water</strong>-Supply Paper 2220, 84 p.<br />
Hubbard, L.E., Herrett, T.A., Kraus, R.L., Ruppert, G.P., <strong>and</strong><br />
Courte, M.L., 1993,<strong>Water</strong> resources data, <strong>Oregon</strong>, water<br />
year 1992: U.S. Geological Survey <strong>Water</strong>-Data Report OR-<br />
92-1, 474 p.<br />
Hubbard, L.E., Herrett, T.A., Kraus, R.L., Ruppert, G.P., <strong>and</strong><br />
Courte, M.L., 1994, <strong>Water</strong> resources data, <strong>Oregon</strong>, water<br />
year 1993: U.S. Geological Survey <strong>Water</strong>-Data Report OR-<br />
93-1, 498 p.<br />
Hubbard, L.H., 1970, <strong>Water</strong> budget <strong>of</strong> <strong>Upper</strong> <strong>Klamath</strong> Lake<br />
southwestern <strong>Oregon</strong>: U.S Geological Survey Hydrologic<br />
Investigations Atlas HA-351.<br />
King, L.D., Hellickson, M.L., Schmisseur, W.E., <strong>and</strong> Shearer,<br />
M.N., 1978, Projected energy <strong>and</strong> water consumption <strong>of</strong><br />
Pacific Northwest irrigation systems: Corvallis, <strong>Oregon</strong>,<br />
Prepared by <strong>Oregon</strong> State University for U.S. Department<br />
<strong>of</strong> Energy through Battelle Pacific Northwest Laboratories,<br />
PNL-RAP-33, 112 p.<br />
Konrad, C.P., Drost, B.W., <strong>and</strong> Wagner, R.J., 2003,<br />
Hydrogeology <strong>of</strong> <strong>the</strong> unconsolidated sediments, water<br />
quality, <strong>and</strong> ground-water/surface-water exchanges in <strong>the</strong><br />
Methow River <strong>Basin</strong>, Okanogan County, Washington: U.S.<br />
Geological Survey <strong>Water</strong>-Resources Investigations Report<br />
03-4244, 137 p.<br />
La Marche, J.L., 2001, <strong>Water</strong> imports <strong>and</strong> exports between<br />
<strong>the</strong> Rogue <strong>and</strong> upper <strong>Klamath</strong> <strong>Basin</strong>s: Unpublished report<br />
prepared for <strong>the</strong> <strong>Klamath</strong> Alternative Dispute Resolution<br />
<strong>Hydrology</strong> Steering Committee, 7 p.<br />
La Marche, 2002, Big Springs hydrologic field study:<br />
<strong>Oregon</strong> <strong>Water</strong> Resources Department unpublished report,<br />
September 2, 2002, 21 p.<br />
La Rue, E.C., 1922, <strong>Klamath</strong> River <strong>and</strong> its utilization: Report<br />
to <strong>the</strong> Office <strong>of</strong> <strong>the</strong> State Engineer, Salem, <strong>Oregon</strong>, 204 p.<br />
Leonard, A.R., <strong>and</strong> Harris, A.B., 1974, <strong>Ground</strong> water in<br />
selected areas in <strong>the</strong> <strong>Klamath</strong> <strong>Basin</strong>, <strong>Oregon</strong>: <strong>Oregon</strong> State<br />
Engineer <strong>Ground</strong> <strong>Water</strong> Report No. 21, 104 p.<br />
Loy, W.G., Allan, Stuart, Buckley, Aileen, <strong>and</strong> Meacham, Jim,<br />
2001, Atlas <strong>of</strong> <strong>Oregon</strong>: University <strong>of</strong> <strong>Oregon</strong> Press, Eugene,<br />
320 p.<br />
MacLeod, N.L., <strong>and</strong> Sherrod, D.R., 1992, Reconnaissance<br />
geologic map <strong>of</strong> <strong>the</strong> west half <strong>of</strong> <strong>the</strong> Crescent 1° by 2°<br />
quadrangle, central <strong>Oregon</strong>, U.S. Geological Survey<br />
Miscellaneous Investigations Series Map I-2215.<br />
Meinzer, O.E., 1927, Large springs in <strong>the</strong> United States: U.S.<br />
Geological Survey <strong>Water</strong>-Supply Paper 557, 94 p.<br />
Mertzman, S.A., Jr., 2000, K-Ar results from <strong>the</strong> sou<strong>the</strong>rn<br />
<strong>Oregon</strong>-nor<strong>the</strong>rn California Cascade Range: <strong>Oregon</strong><br />
Geology, v. 62, no. 4, p. 99-122.
68 <strong>Ground</strong>-<strong>Water</strong> <strong>Hydrology</strong> <strong>of</strong> <strong>the</strong> <strong>Upper</strong> <strong>Klamath</strong> <strong>Basin</strong>, <strong>Oregon</strong> <strong>and</strong> California<br />
Moench, A.F., 1984, Double-porosity models for a fissured<br />
groundwater reservoir with fracture skin: <strong>Water</strong> Resources<br />
Research, v. 20, n. 7, p. 831-846.<br />
National Marine Fisheries Service, 2002, Biological opinion—<br />
<strong>Klamath</strong> project operations: http://swr.nmfs.noaa.gov/psd/<br />
klamath/KpopBO2002finalMay31.PDF, accessed January<br />
5, 2007.<br />
Natural Resources Conservation Service, 2004, Summary<br />
<strong>of</strong> <strong>the</strong> upper <strong>Klamath</strong> <strong>Basin</strong> rapid subbasin assessment <strong>of</strong><br />
private l<strong>and</strong>s: U.S. Department <strong>of</strong> Agriculture, Natural<br />
Resources Conservation Service, variously paginated.<br />
Newcomb, R.C., <strong>and</strong> Hart, D.H., 1958, Preliminary report<br />
on <strong>the</strong> ground water resources <strong>of</strong> <strong>the</strong> <strong>Klamath</strong> River<br />
<strong>Basin</strong>, <strong>Oregon</strong>: U.S. Geological Survey Open-File Report<br />
[unnumbered], 248 p.<br />
Northwest Geophysical Associates, Inc., 2002, Gravity survey<br />
groundwater investigation Lower <strong>Klamath</strong> Lake <strong>Basin</strong><br />
<strong>Klamath</strong> County, <strong>Oregon</strong>: Corvallis, <strong>Oregon</strong>, Northwest<br />
Geophysical Associates, Inc., prepared for <strong>Klamath</strong><br />
Drainage District, May, 2002, 13 p. plus 11 sheets.<br />
<strong>Oregon</strong> Blue Book: http://bluebook.state.or.us/, accessed<br />
February 27, 2006<br />
<strong>Oregon</strong> State University PRISM Group, 2006, PRISM Group<br />
data website: www.ocs.oregonstate.edu/prism, accessed<br />
9/2006.<br />
<strong>Oregon</strong> <strong>Water</strong> Resources Department, 1987, Information<br />
Report—Well reconstruction in <strong>the</strong> Whisky Creek area,<br />
near Sprague River: Memor<strong>and</strong>um from <strong>the</strong> Director to <strong>the</strong><br />
<strong>Water</strong> Resources Commission regarding Agenda Item L,<br />
June 5, 1987 <strong>Water</strong> Resources Commission Meeting, 6 p.<br />
Orr, E.L., Orr, W.N., <strong>and</strong> Baldwin, E.M., 1992, Geology <strong>of</strong><br />
<strong>Oregon</strong>: Kendall/Hunt Publishing Co., 254 p.<br />
Palmer, P.C., Gannett, M.W., <strong>and</strong> Hinkle, S.R., 2007, Isotopic<br />
characterization <strong>of</strong> three groundwater recharge sources <strong>and</strong><br />
inferences for selected aquifers in <strong>the</strong> upper <strong>Klamath</strong> <strong>Basin</strong><br />
<strong>of</strong> <strong>Oregon</strong> <strong>and</strong> California, USA: Journal <strong>of</strong> <strong>Hydrology</strong>, v.<br />
336, p. 17-29.<br />
Priestly, C.H.B., <strong>and</strong> Taylor, R.B., 1972, On <strong>the</strong> assessment<br />
<strong>of</strong> surface heat flux <strong>and</strong> evaporation using large-scale<br />
parameters: Monthly Wea<strong>the</strong>r Review, v. 100, p. 81-92.<br />
Risley, J.C., <strong>and</strong> Gannett, M.W., 2006, An evaluation <strong>and</strong><br />
review <strong>of</strong> water-use estimates <strong>and</strong> flow data for <strong>the</strong> Lower<br />
<strong>Klamath</strong> <strong>and</strong> Tule Lake National Wildlife Refuges,<br />
<strong>Oregon</strong> <strong>and</strong> California: U.S. Geological Survey Scientific<br />
Investigations Report 2006-5036, 18.<br />
Risley, J.C., Gannett, M.W., Lea, J.K., <strong>and</strong> Roehl, E.A., Jr.,<br />
2005, An analysis <strong>of</strong> statistical methods for seasonal flow<br />
forecasting in <strong>the</strong> upper <strong>Klamath</strong> <strong>Basin</strong> <strong>of</strong> <strong>Oregon</strong> <strong>and</strong><br />
California: U.S. Geological Survey Scientific Investigations<br />
Report 2005-5177, 44 p.<br />
Russell, R.J., 1928, <strong>Basin</strong> range structure <strong>and</strong> stratigraphy<br />
<strong>of</strong> <strong>the</strong> Warner Range, nor<strong>the</strong>astern California: University<br />
<strong>of</strong> California, Bulletin <strong>of</strong> <strong>the</strong> Department <strong>of</strong> Geological<br />
Sciences, v. 17, n. 11, p. 387-496.<br />
Sammel, E.A., <strong>and</strong> Peterson, D.L., 1976, Hydrologic<br />
reconnaissance <strong>of</strong> <strong>the</strong> geo<strong>the</strong>rmal area near <strong>Klamath</strong> Falls,<br />
<strong>Oregon</strong>, with a section on Preliminary interpretation <strong>of</strong><br />
geophysical data: U.S. Geological Survey <strong>Water</strong>-Resources<br />
Investigations Report 76-127, 137 p.<br />
Sherrod, D.R., 1991, Geologic map <strong>of</strong> a part <strong>of</strong> <strong>the</strong> Cascade<br />
Range between latitudes 43°-44°, central, <strong>Oregon</strong>: U.S.<br />
Geological Survey Map I-1891, 14 p., scale 1:125,000, 1<br />
sheet.<br />
Sherrod, D.R., <strong>and</strong> Pickthorn, L.G., 1992, Geologic map <strong>of</strong> <strong>the</strong><br />
west half <strong>of</strong> <strong>the</strong> <strong>Klamath</strong> Falls 1° by 2° Quadrangle, southcentral<br />
<strong>Oregon</strong>: U.S. Geological Survey Miscellaneous<br />
Investigations Series, Map I-2182, scale 1:250,000, 1 sheet.<br />
Sherrod, D.R., <strong>and</strong> Smith, J.G., 2000, Geologic map <strong>of</strong><br />
upper Eocene to Holocene volcanic <strong>and</strong> related rocks<br />
<strong>of</strong> <strong>the</strong> Cascade Range <strong>Oregon</strong>: U.S. Geological Survey<br />
Miscellaneous Investigations Map I-2569, scale 1:500,000.<br />
Siskiyou County, 2003, Annual report <strong>of</strong> estimated crop <strong>and</strong><br />
livestock production, year ending December 31, 2003:<br />
Siskiyou County Department <strong>of</strong> Agriculture, unpaginated.<br />
Smith, J.G., Page, N.J., Johnson, M.G., Moring, B.C., <strong>and</strong><br />
Gray, Floyd, 1982, Preliminary geologic map <strong>of</strong> <strong>the</strong><br />
Medford 1° by 2° quadrangle, <strong>Oregon</strong> <strong>and</strong> California:<br />
U.S. Geological Survey Open-File Report 82-955, scale<br />
1:250,000, 1 sheet.<br />
Snyder, D.T., <strong>and</strong> Morace, J.L., 1997, Nitrogen <strong>and</strong><br />
phosphorous loading from drained wetl<strong>and</strong>s adjacent<br />
to <strong>Upper</strong> <strong>Klamath</strong> <strong>and</strong> Agency Lakes, <strong>Oregon</strong>: U.S.<br />
Geological Survey <strong>Water</strong>-Resources Investigations Report<br />
97-4059, 67p.<br />
Stonestrom, D.A., Prudic, D.E., Laczniak, R.J., Akstin, K.C.,<br />
Boyd, R.A., <strong>and</strong> Henkelman, K.K., 2003, estimates <strong>of</strong><br />
deep percolation beneath native vegetation, irrigated fields,<br />
<strong>and</strong> <strong>the</strong> Amargosa-River channel, Amargosa Desert, Nye<br />
County, Nevada: U.S. Geological Survey Open File Report<br />
03-14, 83 p.
References Cited 69<br />
Theis, C.V., 1935, The relation between <strong>the</strong> lowering <strong>of</strong><br />
<strong>the</strong> piezometric surface <strong>and</strong> <strong>the</strong> rate <strong>and</strong> duration <strong>of</strong><br />
discharge <strong>of</strong> a well using ground-water storage: American<br />
Geophysical Union Transactions, 16 th Annual Meeting, part<br />
2, p. 518-524.<br />
U.S. Department <strong>of</strong> Agriculture, 2004, Statistics by state—<br />
<strong>Oregon</strong>: http://www.nass.usda.gov/Statistics_by_State/<br />
<strong>Oregon</strong>, accessed January 5, 2007.<br />
U.S. Geological Survey, 1956, Surface water supply <strong>of</strong><br />
<strong>the</strong> United States, 1954, Part 11, Pacific slope basins in<br />
California: U.S. Geological Survey <strong>Water</strong>-Supply Paper<br />
1345, 574 p.<br />
U.S. Geological Survey, 1960a, Surface water supply <strong>of</strong><br />
<strong>the</strong> United States, 1959, Part 11, Pacific slope basins in<br />
California: U.S. Geological Survey <strong>Water</strong>-Supply Paper<br />
1635, 748 p.<br />
U.S. Geological Survey, 1960b, Compilation <strong>of</strong> records <strong>of</strong><br />
surface waters <strong>of</strong> <strong>the</strong> United States through September<br />
1950. Part 11-A, Pacific slope basins in California, except<br />
Central Valley: U.S. Geological Survey <strong>Water</strong>-Supply Paper<br />
1315-B, p. 471-864.<br />
U.S. Geological Survey, [various dates], Surface water supply<br />
<strong>of</strong> <strong>the</strong> United States, Pacific slope basins in California: U.S.<br />
Geological Survey <strong>Water</strong>-Supply Paper, various parts.<br />
Vance, J.A., 1984, The lower Western Cascades Volcanic<br />
Group in nor<strong>the</strong>rn California, in Nilsen, T.H. ed., Geology<br />
<strong>of</strong> <strong>the</strong> <strong>Upper</strong> Cretaceous Hornbrook Formation, <strong>Oregon</strong><br />
<strong>and</strong> California: Society <strong>of</strong> Economic Paleontologists <strong>and</strong><br />
Mineralogists, Pacific Section, Field Trip Guidebook v. 42,<br />
p. 195-196.<br />
Veen, C.A., 1981, Gravity anomalies <strong>and</strong> <strong>the</strong>ir structural<br />
implications for sou<strong>the</strong>rn <strong>Oregon</strong> Cascade Mountains <strong>and</strong><br />
adjoining <strong>Basin</strong> <strong>and</strong> Range province: Corvallis, <strong>Oregon</strong>,<br />
<strong>Oregon</strong> State University, M.S. <strong>the</strong>sis, 86 p.<br />
Wagner, D.L., <strong>and</strong> Saucedo, G.J., compilers, 1987, Geologic<br />
map <strong>of</strong> <strong>the</strong> Weed Quadrangle: California Division <strong>of</strong> Mines<br />
<strong>and</strong> Geology Regional Geologic Map Series Map No. 4A<br />
(Geology), 15 p., scale 1:250,000, 4 sheets.<br />
<strong>Water</strong>shed Sciences, 2002, Aerial survey in <strong>the</strong> <strong>Klamath</strong><br />
<strong>and</strong> Lost River <strong>Basin</strong>s—Thermal infrared <strong>and</strong> color<br />
videography, <strong>Water</strong>shed Sciences, LLC, Corvallis, OR, 29<br />
p., plus appendices.<br />
Weber, Bruce, <strong>and</strong> Sorte, Bruce, 2003, The upper <strong>Klamath</strong><br />
<strong>Basin</strong> economy <strong>and</strong> <strong>the</strong> role <strong>of</strong> agriculture: in Braunworth,<br />
W.S., Jr., Welch, Teresa, <strong>and</strong> Hathaway, Ron, eds. <strong>Water</strong><br />
allocation in <strong>the</strong> <strong>Klamath</strong> Reclamation Project: an<br />
assessment <strong>of</strong> natural resource, economic, social, <strong>and</strong><br />
institutional issues with a focus on <strong>the</strong> upper <strong>Klamath</strong><br />
<strong>Basin</strong>, <strong>Oregon</strong> State University Extension Service Special<br />
Report 1037, p. 213-229.<br />
Weddell, B.J., 2000, Relationship between flows in <strong>the</strong><br />
<strong>Klamath</strong> River <strong>and</strong> Lower <strong>Klamath</strong> Lake prior to 1910:<br />
Report to U.S. Fish <strong>and</strong> Wildlife Service <strong>Klamath</strong> <strong>Basin</strong><br />
Refuges, Tulelake California, 10 p.<br />
Weeks, E.P., 2005, Hydrologic properties <strong>of</strong> coal-beds in <strong>the</strong><br />
powder River <strong>Basin</strong>, Montana. II. Aquifer test analysis:<br />
Journal <strong>of</strong> <strong>Hydrology</strong>, v. 308, p. 242-257.<br />
WESCORP (<strong>and</strong> Golder Associates), 2003, Lower<br />
<strong>Klamath</strong> NWR groundwater program-2002 groundwater<br />
development report-U.S. Fish <strong>and</strong> Wildlife Service: Mercer<br />
Isl<strong>and</strong>, Washington, WESCORP (<strong>Water</strong> <strong>and</strong> Energy<br />
Services Corporation), January, 2003, variously paged.<br />
Western Regional Climate Center, 2006, Historical climate<br />
data: http://www.wrcc.dri.edu, accessed 9/2006.<br />
William E. Nork, Inc., 1992, Analysis <strong>of</strong> pumping tests on<br />
OIT Injection Well No. 2: Prepared for <strong>Oregon</strong> Institute <strong>of</strong><br />
Technology by William E. Nork, Inc., Reno, Report 92-421<br />
[PSC-P 58777], 9 p. plus figures <strong>and</strong> tables.<br />
Wood, P.R., 1960, Geology <strong>and</strong> ground-water features <strong>of</strong> <strong>the</strong><br />
Butte Valley region, Siskiyou County, California: U.S.<br />
Geological Survey <strong>Water</strong>-Supply Paper 1491, 150 p.<br />
Zwart, M.J., <strong>and</strong> Gates, E.B., 2002, Results <strong>of</strong> a long-term<br />
aquifer test at <strong>the</strong> Ron McVay irrigation well, <strong>Klamath</strong><br />
County, <strong>Oregon</strong>: State <strong>of</strong> <strong>Oregon</strong> <strong>Water</strong> Resources<br />
Department <strong>Ground</strong> <strong>Water</strong> Open File Report 02-004, 35 p.<br />
plus 3 appendices.<br />
Walker, G.W., 1963, Reconnaissance geologic map <strong>of</strong> <strong>the</strong><br />
eastern half <strong>of</strong> <strong>the</strong> <strong>Klamath</strong> Falls (AMS) quadrangle, Lake<br />
<strong>and</strong> <strong>Klamath</strong> counties, <strong>Oregon</strong>: U.S. Geological Survey<br />
Mineral Investigations Field Studies Map MF-260, scale<br />
1:250,000, 1 sheet.
70 <strong>Ground</strong>-<strong>Water</strong> <strong>Hydrology</strong> <strong>of</strong> <strong>the</strong> <strong>Upper</strong> <strong>Klamath</strong> <strong>Basin</strong>, <strong>Oregon</strong> <strong>and</strong> California<br />
This page intentionally left blank.
Appendix A. 71<br />
Appendix A. L<strong>and</strong>sat Analysis<br />
Methods<br />
The imagery classification was based on two levels <strong>of</strong><br />
resolution: (1) a generalized nonirrigated level that consisted<br />
<strong>of</strong> four Anderson Level I/II classes: ice <strong>and</strong> snow, evergreen<br />
forest, water, <strong>and</strong> shrub l<strong>and</strong>s that represented a combination<br />
<strong>of</strong> bare soil, rock, sagebrush <strong>and</strong> o<strong>the</strong>r nonirrigated vegetation<br />
(Anderson <strong>and</strong> o<strong>the</strong>rs, 1976); <strong>and</strong> (2) irrigated l<strong>and</strong>s clustered<br />
into five vegetative classes based on <strong>the</strong>ir spectral similarity<br />
<strong>and</strong> potential crop water needs. These classes were labeled<br />
alfalfa <strong>and</strong> irrigated grasses, small grains, onions-garlic,<br />
potatoes-corn, <strong>and</strong> strawberries. Although it would have been<br />
desirable, identification <strong>of</strong> individual crop types proved to be<br />
impossible because <strong>of</strong> <strong>the</strong> lack <strong>of</strong> unique spectral signatures<br />
(Paul Seevers, EROS Data Center, written commun., 2000).<br />
The use <strong>of</strong> three satellite images from different times during<br />
<strong>the</strong> growing season increased <strong>the</strong> probability that certain croptypes<br />
could be distinguished based on <strong>the</strong> development <strong>of</strong> <strong>the</strong>ir<br />
spectral signatures. To aid in <strong>the</strong> classification <strong>of</strong> <strong>the</strong> imagery,<br />
field work was conducted to map directly crop types in areas<br />
totaling about 17,000 acres. A variety <strong>of</strong> representative l<strong>and</strong>cover<br />
types were observed, including native trees, pasture<br />
<strong>and</strong> most <strong>of</strong> <strong>the</strong> agricultural crops. Most data were collected<br />
in mid-July. Data on crop type <strong>and</strong> height, percentage <strong>of</strong> crop<br />
cover, sprinkler type, <strong>and</strong> o<strong>the</strong>r parameters also were collected.<br />
The three images were processed in succession. The May<br />
21, 2000, scene (from L<strong>and</strong>sat 5) showed full canopy cover <strong>of</strong><br />
<strong>the</strong> perennial crops such as alfalfa, irrigated grasses, <strong>and</strong> any<br />
winter wheat that may have been planted <strong>the</strong> previous fall.<br />
The timing <strong>of</strong> <strong>the</strong> scene put it before any annual row crops<br />
had enough growth to show a vegetative signature. Areas<br />
with vigorous growth in <strong>the</strong> May scene served to mask over<br />
<strong>the</strong> same areas in <strong>the</strong> August scene. This step reduced <strong>the</strong><br />
amount <strong>of</strong> data in <strong>the</strong> August scene that required analysis. The<br />
irrigation district boundaries were used to segregate irrigated<br />
areas outside <strong>of</strong> <strong>the</strong> <strong>Klamath</strong> Project. The August 1 scene<br />
(from L<strong>and</strong>sat 7) revealed <strong>the</strong> full canopy <strong>of</strong> <strong>the</strong> annual row<br />
crops planted during <strong>the</strong> spring. The September 18 scene (also<br />
from L<strong>and</strong>sat 7) was used to show any crops that might have a<br />
vigorous vegetative signature beyond <strong>the</strong> harvest dates <strong>of</strong> <strong>the</strong><br />
small grains.<br />
A review was performed on <strong>the</strong> results <strong>of</strong> <strong>the</strong> final l<strong>and</strong>cover<br />
classification by creating an error matrix to evaluate<br />
how well <strong>the</strong> classification <strong>of</strong> <strong>the</strong> imagery matched what was<br />
actually mapped on <strong>the</strong> ground. The review looked at how<br />
accurately <strong>the</strong> classification identified specific crop-types<br />
<strong>and</strong> how accurately <strong>the</strong> classification did with respect to all<br />
irrigated crop-classes. To do this, <strong>the</strong> new l<strong>and</strong>-cover map<br />
created from <strong>the</strong> classified L<strong>and</strong>sat imagery was converted<br />
to a polygon dataset, with each polygon being 30 meters, <strong>the</strong><br />
resolution <strong>of</strong> <strong>the</strong> original imagery. Each polygon contained a<br />
code for crop class determined by <strong>the</strong> classification process.<br />
The ground reference boundaries were <strong>the</strong>n used to clip out<br />
<strong>the</strong> same areas in <strong>the</strong> classified l<strong>and</strong> cover. The clipped l<strong>and</strong>cover<br />
polygons were <strong>the</strong>n evaluated by crop class against <strong>the</strong><br />
ground reference. For example, if a ground reference area<br />
was identified as alfalfa, <strong>the</strong>n <strong>the</strong> same area was compared in<br />
<strong>the</strong> l<strong>and</strong> cover. The results <strong>of</strong> <strong>the</strong> review showed that largeacreage<br />
crops such as alfalfa had a correct classification ratio<br />
<strong>of</strong> about 64 percent. However, if all irrigated crop classes were<br />
included <strong>the</strong>n <strong>the</strong> accuracy <strong>of</strong> identifying irrigated l<strong>and</strong>s within<br />
that area increased to about 73 percent. For crops grown on<br />
smaller fields, <strong>the</strong> accuracy <strong>of</strong> <strong>the</strong> classification to identify<br />
specific crop class decreased to a range <strong>of</strong> 20 to 30 percent. If<br />
all irrigated l<strong>and</strong>s were included <strong>the</strong>n <strong>the</strong> accuracy increased to<br />
<strong>the</strong> 50 to 70 percent range. Sugar beet fields for example, were<br />
correctly classified 34 percent <strong>of</strong> <strong>the</strong> time, but if all irrigated<br />
l<strong>and</strong>s for <strong>the</strong> same area were included <strong>the</strong>n <strong>the</strong> accuracy<br />
increased to 62 percent. All mint <strong>and</strong> strawberry fields were<br />
located during <strong>the</strong> ground truth <strong>and</strong> were included in <strong>the</strong> final<br />
classification.
72 <strong>Ground</strong>-<strong>Water</strong> <strong>Hydrology</strong> <strong>of</strong> <strong>the</strong> <strong>Upper</strong> <strong>Klamath</strong> <strong>Basin</strong>, <strong>Oregon</strong> <strong>and</strong> California<br />
Table 6. Estimated ground-water discharge to principal stream reaches in <strong>the</strong> upper <strong>Klamath</strong> <strong>Basin</strong>, <strong>Oregon</strong> <strong>and</strong> California.<br />
[Reach: River miles in Reach column are from <strong>Oregon</strong> <strong>Water</strong> Resources Department <strong>Klamath</strong> Drainage <strong>Basin</strong> Map, Map No. 14.6, 1971. Confidence level: Confidence levels represent a subjective assessment<br />
<strong>of</strong> <strong>the</strong> interval (plus or minus) that has a 95 percent probability <strong>of</strong> containing <strong>the</strong> true value. Confidence level categories are: 1, 10 percent; 2, 20 percent; 3, 30 percent; 4, 50 percent; 5, data insufficient to assess<br />
uncertainty. Subtotals rounded to two significant figures. Unless o<strong>the</strong>rwise noted, values were derived by taking <strong>the</strong> average <strong>of</strong> estimated discharge in <strong>the</strong> fall (Sept, Oct, Nov). USGS synoptic measurement<br />
data from Leonard <strong>and</strong> Harris (1974). Abbreviations: BOR, Bureau <strong>of</strong> Reclamation; CDWR, California Department <strong>of</strong> <strong>Water</strong> Resources; Cr, Creek; ft 3 /s, cubic feet per second; Hwy, Highway; mi, mile; NA,<br />
not applicable; NPS, National Park Service; OWRD, <strong>Oregon</strong> <strong>Water</strong> Resources Department; R, River; Res, Reservoir; RM, river mile; RR, rail road; USFS, U.S. Forest Service; USGS, U.S. Geological Survey]<br />
Number Stream name Reach<br />
Estimated gain<br />
(+) or loss (-)<br />
(ft 3 /s)<br />
Data source<br />
Period <strong>of</strong><br />
record<br />
Methods Remarks<br />
Confidence<br />
level<br />
1 South Fork<br />
Sprague River<br />
2 Brownsworth<br />
Creek<br />
3 Fritz <strong>and</strong><br />
Deming<br />
Creeks<br />
1 4 South Fork<br />
Sprague<br />
River<br />
Headwaters to above<br />
Brownsworth Cr<br />
(RM 15.2)<br />
14 USFS gage 10/1992-<br />
09/1997<br />
Entire drainage 5 USFS<br />
measurements<br />
(46)<br />
Entire drainage <strong>of</strong> both<br />
creeks<br />
Brownsworth Cr (RM<br />
15.2) to picnic area<br />
(RM 10.2)<br />
Subtotal for South Fork Sprague River 24<br />
12/1991-<br />
04/1997<br />
Index regression to Chewaucan<br />
near Paisley, Oreg. (USGS site<br />
10384000)<br />
Miscellaneous measurement<br />
regression to Chewaucan near<br />
Paisley, Oreg. (USGS site<br />
10384000)<br />
OWRD site 61420208 3<br />
OWRD site 21420206 3<br />
5 N/A N/A Regional regression 5<br />
0 USFS<br />
measurements<br />
(34)<br />
1/1992–<br />
3/1996<br />
Miscellaneous measurement<br />
regression to Chewaucan near<br />
Paisley, Oreg. (USGS site<br />
10384000). Mass balance.<br />
OWRD site 21420201. Gains<br />
calculated from difference<br />
with upstream inflows.<br />
3<br />
5 North Fork<br />
Sprague<br />
River<br />
6 North Fork<br />
Sprague<br />
River<br />
Headwaters to above<br />
S<strong>and</strong>hill Crossing<br />
(RM 23.5)<br />
S<strong>and</strong>hill Crossing to<br />
The Elbow (RM<br />
23.5 to RM 12.2)<br />
7 Meryl Creek Headwaters to<br />
approximately 1.5<br />
mi above mouth<br />
8 Fivemile<br />
Creek<br />
Headwaters to<br />
approximately 4.0<br />
mi above mouth<br />
16 USFS gage 10/1992–<br />
9/1997<br />
43 USFS<br />
measurements<br />
(46)<br />
13 USGS/OWRD<br />
measurements<br />
(5)<br />
20 USGS/OWRD<br />
measurements<br />
(280)<br />
01/1992–<br />
05/1997<br />
09/1915,<br />
09/1954,<br />
10/1970,<br />
09/1983,<br />
11/2000<br />
08/1917–<br />
09/1973<br />
Index regression to Chewaucan<br />
near Paisley, Oreg. (USGS site<br />
10384000)<br />
Miscellaneous measurement<br />
regression to Chewaucan near<br />
Paisley (USGS site 10384000).<br />
Mass balance.<br />
OWRD site 61420206 3<br />
OWRD site 21420202. Gains<br />
calculated from difference<br />
with upstream inflows.<br />
Average Majority <strong>of</strong> measurements<br />
approximately 1.5 mi from<br />
mouth.<br />
Miscellaneous measurement<br />
regression to Williamson R<br />
below Sprague R near Chiloquin,<br />
Oreg. (USGS site 11502500).<br />
Measurements at USGS site<br />
11497000. Used data as<br />
miscellaneous measurement<br />
site due to large amounts <strong>of</strong><br />
missing data.<br />
2<br />
4<br />
1
Table 6 73<br />
Table 6. Estimated ground-water discharge to principal stream reaches in <strong>the</strong> upper <strong>Klamath</strong> <strong>Basin</strong>, <strong>Oregon</strong> <strong>and</strong> California.—Continued<br />
[Reach: River miles in Reach column are from <strong>Oregon</strong> <strong>Water</strong> Resources Department <strong>Klamath</strong> Drainage <strong>Basin</strong> Map, Map No. 14.6, 1971. Confidence level: Confidence levels represent a subjective assessment<br />
<strong>of</strong> <strong>the</strong> interval (plus or minus) that has a 95 percent probability <strong>of</strong> containing <strong>the</strong> true value. Confidence level categories are: 1, 10 percent; 2, 20 percent; 3, 30 percent; 4, 50 percent; 5, data insufficient to assess<br />
uncertainty. Subtotals rounded to two significant figures. Unless o<strong>the</strong>rwise noted, values were derived by taking <strong>the</strong> average <strong>of</strong> estimated discharge in <strong>the</strong> fall (Sept, Oct, Nov). USGS synoptic measurement<br />
data from Leonard <strong>and</strong> Harris (1974). Abbreviations: BOR, Bureau <strong>of</strong> Reclamation; CDWR, California Department <strong>of</strong> <strong>Water</strong> Resources; Cr, Creek; ft 3 /s, cubic feet per second; Hwy, Highway; mi, mile; NA,<br />
not applicable; NPS, National Park Service; OWRD, <strong>Oregon</strong> <strong>Water</strong> Resources Department; R, River; Res, Reservoir; RM, river mile; RR, rail road; USFS, U.S. Forest Service; USGS, U.S. Geological Survey]<br />
Number Stream name Reach<br />
Estimated gain<br />
(+) or loss (-)<br />
(ft 3 /s)<br />
Data source<br />
Period <strong>of</strong><br />
record<br />
Methods Remarks<br />
Confidence<br />
level<br />
1 9 North Fork<br />
Sprague<br />
River<br />
The Elbow (RM 12.2)<br />
to RM 1.5<br />
Subtotal for North Fork Sprague River 92<br />
0 OWRD synoptic<br />
measurement<br />
11/2000 Synoptic measurement No gains o<strong>the</strong>r than tributary<br />
inflows.<br />
3<br />
10 <strong>Upper</strong> Sprague<br />
River<br />
11 <strong>Upper</strong> Sprague<br />
River<br />
South Fork Sprague<br />
at Picnic Area (RM<br />
10.2) to Sprague<br />
at Cinder Pit (RM<br />
77.5)<br />
Cinder Pit (RM 77.5)<br />
to OWRD gage at<br />
Beatty Gap (RM 75)<br />
Subtotal for upper Sprague River 52<br />
26 OWRD/USGS<br />
synoptic<br />
measurements<br />
(2)<br />
26 OWRD/USGS<br />
synoptic<br />
measurements<br />
(2)<br />
11/2000,<br />
10/1970<br />
11/2000,<br />
10/1970<br />
Average Good agreement between<br />
seepage measurements.<br />
Discharge recorded at<br />
Beatty gage during synoptic<br />
measurements was close to<br />
long term average.<br />
Average Large difference between<br />
synoptic measurements.<br />
3<br />
4<br />
1 12 Lower Sprague<br />
River<br />
OWRD gage at Beatty<br />
Gap (RM 75) to<br />
below old RR<br />
crossing (RM 74.2)<br />
1 13 Spring Creek Headwater to mouth<br />
(Sprague RM 73.2).<br />
Note: Spring Creek<br />
is too short to show<br />
on figures; enters<br />
Sprague near Brown<br />
Creek.<br />
14 Brown Creek Headwater to 1 mi<br />
above confluence<br />
(Sprague RM 73)<br />
34 OWRD/USGS<br />
synoptic<br />
measurements<br />
(3)<br />
18 OWRD synoptic<br />
measurements<br />
(2)<br />
3 OWRD synoptic<br />
measurements<br />
(2)<br />
10/1970,<br />
11/2000,<br />
10/2002<br />
11/2000,<br />
10/2002<br />
11/2000,<br />
10/2002<br />
Average Estimate includes gains from<br />
Medicine Springs (14 ft 3 /s<br />
from seven measurements).<br />
Average Good agreement between<br />
synoptic measurements.<br />
Average Good agreement between<br />
synoptic measurements.<br />
3<br />
4<br />
4
74 <strong>Ground</strong>-<strong>Water</strong> <strong>Hydrology</strong> <strong>of</strong> <strong>the</strong> <strong>Upper</strong> <strong>Klamath</strong> <strong>Basin</strong>, <strong>Oregon</strong> <strong>and</strong> California<br />
Table 6. Estimated ground-water discharge to principal stream reaches in <strong>the</strong> upper <strong>Klamath</strong> <strong>Basin</strong>, <strong>Oregon</strong> <strong>and</strong> California.—Continued<br />
[Reach: River miles in Reach column are from <strong>Oregon</strong> <strong>Water</strong> Resources Department <strong>Klamath</strong> Drainage <strong>Basin</strong> Map, Map No. 14.6, 1971. Confidence level: Confidence levels represent a subjective assessment<br />
<strong>of</strong> <strong>the</strong> interval (plus or minus) that has a 95 percent probability <strong>of</strong> containing <strong>the</strong> true value. Confidence level categories are: 1, 10 percent; 2, 20 percent; 3, 30 percent; 4, 50 percent; 5, data insufficient to assess<br />
uncertainty. Subtotals rounded to two significant figures. Unless o<strong>the</strong>rwise noted, values were derived by taking <strong>the</strong> average <strong>of</strong> estimated discharge in <strong>the</strong> fall (Sept, Oct, Nov). USGS synoptic measurement<br />
data from Leonard <strong>and</strong> Harris (1974). Abbreviations: BOR, Bureau <strong>of</strong> Reclamation; CDWR, California Department <strong>of</strong> <strong>Water</strong> Resources; Cr, Creek; ft 3 /s, cubic feet per second; Hwy, Highway; mi, mile; NA,<br />
not applicable; NPS, National Park Service; OWRD, <strong>Oregon</strong> <strong>Water</strong> Resources Department; R, River; Res, Reservoir; RM, river mile; RR, rail road; USFS, U.S. Forest Service; USGS, U.S. Geological Survey]<br />
Number Stream name Reach<br />
Estimated gain<br />
(+) or loss (-)<br />
(ft 3 /s)<br />
Data source<br />
Period <strong>of</strong><br />
record<br />
Methods Remarks<br />
Confidence<br />
level<br />
15 Sprague River Near old RR crossing<br />
(RM 74.2) to<br />
Watchdog Butte<br />
(RM 49)<br />
16 Whisky Creek Headwaters to<br />
approximately 1.0<br />
mi above mouth<br />
1 17 Sprague River Watchdog Butte (RM<br />
49) to below Trout<br />
Cr confluence (RM<br />
37)<br />
1 18 Sprague River Trout Cr confluence<br />
(RM 37) to bridge<br />
near Lone Pine (RM<br />
33)<br />
1 19 Sprague River Bridge near Lone Pine<br />
(RM 33) to above<br />
Wolff Ranch (RM<br />
28.5)<br />
20 Sprague River above Wolff Ranch<br />
(RM 28.5) to below<br />
Kamkaun Springs<br />
(RM 23.2)<br />
7 OWRD/USGS<br />
synoptic<br />
measurements<br />
(2)<br />
13 OWRD/USGS<br />
synoptic<br />
measurements<br />
(3)<br />
11/2000,<br />
10/1970<br />
10/1970,<br />
11/2000,<br />
10/2002<br />
Average Gains within measurement<br />
error. However, some<br />
springs in <strong>the</strong> vicinity<br />
RM 69 <strong>and</strong> 70. Springs<br />
measured 4 ft 3 /s in 10/2002.<br />
Synoptic measurements<br />
made when flows recorded<br />
at USGS gage near<br />
Chiloquin were similar to<br />
long term average.<br />
Average 1970 measurement about 10<br />
ft 3 /s larger than o<strong>the</strong>rs.<br />
0 OWRD 11/1/2000 Synoptic measurement Synoptic measurements made<br />
when flows recorded at<br />
USGS gage near Chiloquin<br />
were similar to long-term<br />
average fall flow.<br />
0 OWRD synoptic<br />
measurements<br />
(2)<br />
4 OWRD/USGS<br />
synoptic<br />
measurements<br />
(3)<br />
50 OWRD synoptic<br />
measurements<br />
11/2000,<br />
10/2002<br />
10/1970,<br />
11/2000,<br />
10/2002<br />
Average Synoptic measurements on<br />
10/1970 demonstrate gain<br />
<strong>of</strong> 30 ft 3 /s. Recent results<br />
do not concur with this<br />
finding.<br />
Average Gains within measurement<br />
error.<br />
11/2000 Synoptic measurement Good agreement with average<br />
<strong>of</strong> 26 direct measurements<br />
on Kamkaun/McReady<br />
springs made from 04/1920<br />
to 09/1973<br />
4<br />
4<br />
3<br />
4<br />
3<br />
2
Table 6 75<br />
Table 6. Estimated ground-water discharge to principal stream reaches in <strong>the</strong> upper <strong>Klamath</strong> <strong>Basin</strong>, <strong>Oregon</strong> <strong>and</strong> California.—Continued<br />
[Reach: River miles in Reach column are from <strong>Oregon</strong> <strong>Water</strong> Resources Department <strong>Klamath</strong> Drainage <strong>Basin</strong> Map, Map No. 14.6, 1971. Confidence level: Confidence levels represent a subjective assessment<br />
<strong>of</strong> <strong>the</strong> interval (plus or minus) that has a 95 percent probability <strong>of</strong> containing <strong>the</strong> true value. Confidence level categories are: 1, 10 percent; 2, 20 percent; 3, 30 percent; 4, 50 percent; 5, data insufficient to assess<br />
uncertainty. Subtotals rounded to two significant figures. Unless o<strong>the</strong>rwise noted, values were derived by taking <strong>the</strong> average <strong>of</strong> estimated discharge in <strong>the</strong> fall (Sept, Oct, Nov). USGS synoptic measurement<br />
data from Leonard <strong>and</strong> Harris (1974). Abbreviations: BOR, Bureau <strong>of</strong> Reclamation; CDWR, California Department <strong>of</strong> <strong>Water</strong> Resources; Cr, Creek; ft 3 /s, cubic feet per second; Hwy, Highway; mi, mile; NA,<br />
not applicable; NPS, National Park Service; OWRD, <strong>Oregon</strong> <strong>Water</strong> Resources Department; R, River; Res, Reservoir; RM, river mile; RR, rail road; USFS, U.S. Forest Service; USGS, U.S. Geological Survey]<br />
Number Stream name Reach<br />
Estimated gain<br />
(+) or loss (-)<br />
(ft 3 /s)<br />
Data source<br />
Period <strong>of</strong><br />
record<br />
Methods Remarks<br />
Confidence<br />
level<br />
21 Sprague River Kamkaun Springs (RM<br />
23.2) to Hwy Bridge<br />
near Braymill (RM<br />
10.1)<br />
1 22 Sprague River Braymill (RM 10.1) to<br />
Chiloquin (RM 5.2)<br />
Subtotal for lower Sprague River 150<br />
19 OWRD synoptic<br />
measurement<br />
0 OWRD synoptic<br />
measurement<br />
11/2000 Synoptic measurement Gains probably near<br />
Whitehorse Spring<br />
11/2000 Synoptic measurement 3<br />
3<br />
1 23 Long Creek Headwaters to T31S,<br />
R12E, S5<br />
24 Long Creek T31S, R12E, S5 to<br />
mouth (Sycan<br />
Marsh)<br />
25 Sycan River Headwaters to Sycan<br />
Marsh (RM 46.5)<br />
Subtotal for upper Sycan River 24<br />
9 USFS gage 10/1992–<br />
09/1997<br />
Index regression to Eagle Cr<br />
above Skull Cr, near New Bridge,<br />
Oreg. (USGS Site 13288200)<br />
OWRD site 61420205 1<br />
7 N/A N/A Regional regression Ungaged drainage area below<br />
USFS gage (OWRD site<br />
61420205)<br />
8 USFS gage 10/1992–<br />
09/1997<br />
Index regression to Deep Cr<br />
above Adel, Oreg. (USGS Site<br />
10371500).<br />
OWRD site 61420209 2<br />
5<br />
1 26 Sycan Marsh Sycan Marsh -10 to -20 USFS gages 10/1992–<br />
09/1997<br />
Subtotal for Sycan Marsh -10 to -20<br />
Mass balance <strong>and</strong> index regression<br />
<strong>of</strong> USFS gage below Sycan<br />
Marsh to Chewaucan R near<br />
Paisley (USGS Site 10384000).<br />
OWRD site 61420210. Gains<br />
calculated from mass<br />
balance with upstream<br />
estimates during <strong>the</strong> fall.<br />
5<br />
1 27 Sycan River Sycan Marsh Outlet<br />
(RM 35) to RM<br />
30 (above Torrent<br />
Spring)<br />
0 OWRD synoptic<br />
measurement<br />
08/2000 Synoptic measurement Overall gains from synoptic<br />
measurements below Sycan<br />
Marsh in 08/2000 is similar<br />
to average difference in fall<br />
flows from gages at OWRD<br />
site 61420210 to USGS Site<br />
11499100.<br />
3
76 <strong>Ground</strong>-<strong>Water</strong> <strong>Hydrology</strong> <strong>of</strong> <strong>the</strong> <strong>Upper</strong> <strong>Klamath</strong> <strong>Basin</strong>, <strong>Oregon</strong> <strong>and</strong> California<br />
Table 6. Estimated ground-water discharge to principal stream reaches in <strong>the</strong> upper <strong>Klamath</strong> <strong>Basin</strong>, <strong>Oregon</strong> <strong>and</strong> California.—Continued<br />
[Reach: River miles in Reach column are from <strong>Oregon</strong> <strong>Water</strong> Resources Department <strong>Klamath</strong> Drainage <strong>Basin</strong> Map, Map No. 14.6, 1971. Confidence level: Confidence levels represent a subjective assessment<br />
<strong>of</strong> <strong>the</strong> interval (plus or minus) that has a 95 percent probability <strong>of</strong> containing <strong>the</strong> true value. Confidence level categories are: 1, 10 percent; 2, 20 percent; 3, 30 percent; 4, 50 percent; 5, data insufficient to assess<br />
uncertainty. Subtotals rounded to two significant figures. Unless o<strong>the</strong>rwise noted, values were derived by taking <strong>the</strong> average <strong>of</strong> estimated discharge in <strong>the</strong> fall (Sept, Oct, Nov). USGS synoptic measurement<br />
data from Leonard <strong>and</strong> Harris (1974). Abbreviations: BOR, Bureau <strong>of</strong> Reclamation; CDWR, California Department <strong>of</strong> <strong>Water</strong> Resources; Cr, Creek; ft 3 /s, cubic feet per second; Hwy, Highway; mi, mile; NA,<br />
not applicable; NPS, National Park Service; OWRD, <strong>Oregon</strong> <strong>Water</strong> Resources Department; R, River; Res, Reservoir; RM, river mile; RR, rail road; USFS, U.S. Forest Service; USGS, U.S. Geological Survey]<br />
Number Stream name Reach<br />
Estimated gain<br />
(+) or loss (-)<br />
(ft 3 /s)<br />
Data source<br />
Period <strong>of</strong><br />
record<br />
Methods Remarks<br />
Confidence<br />
level<br />
28 Torrent Spring Above <strong>and</strong> below<br />
Torrent Spring on<br />
Sycan R (RM 30 to<br />
RM 24)<br />
1 29 Sycan River Below Torrent<br />
Springs (RM 24)<br />
to confluence with<br />
Blue Cr (RM 11)<br />
12 OWRD/USFS<br />
synoptic<br />
measurements<br />
(5)<br />
0 OWRD synoptic<br />
measurement<br />
1 30 Brown Creek 1/4 mi below spring 4 OWRD synoptic<br />
measurement<br />
31 Sycan River Blue Cr confluence<br />
(RM 11) to OWRD<br />
gage (RM 3)<br />
Subtotal for lower Sycan River 21<br />
5 OWRD synoptic<br />
measurement<br />
10/1997,<br />
10/1998,<br />
08/1999,<br />
10/1999,<br />
08/2000<br />
Average Synoptic measurement in<br />
08/2000, plus additional<br />
synoptic measurements<br />
taken at RM 35 <strong>and</strong> RM 24.<br />
Overall gains from synoptic<br />
measurements below Sycan<br />
Marsh in 08/2000 is similar<br />
to average difference in fall<br />
flows from gages.<br />
08/2000 Synoptic measurement Overall gains from synoptic<br />
measurements below Sycan<br />
Marsh in 08/2000 is similar<br />
to average difference in fall<br />
flows from gages at OWRD<br />
site 61420210 to USGS Site<br />
11499100.<br />
08/2000 Synoptic measurement Overall gains from synoptic<br />
measurements below Sycan<br />
Marsh in 08/2000 is similar<br />
to average difference in fall<br />
flows from gages at OWRD<br />
site 61420210 to USGS Site<br />
11499100.<br />
08/2000 Synoptic measurement Overall gains from synoptic<br />
measurements below Sycan<br />
Marsh in 08/2000 is similar<br />
to average difference in fall<br />
flows from gages at OWRD<br />
site 61420210 to USGS Site<br />
11499100.<br />
3<br />
3<br />
3<br />
3
Table 6 77<br />
Table 6. Estimated ground-water discharge to principal stream reaches in <strong>the</strong> upper <strong>Klamath</strong> <strong>Basin</strong>, <strong>Oregon</strong> <strong>and</strong> California.—Continued<br />
[Reach: River miles in Reach column are from <strong>Oregon</strong> <strong>Water</strong> Resources Department <strong>Klamath</strong> Drainage <strong>Basin</strong> Map, Map No. 14.6, 1971. Confidence level: Confidence levels represent a subjective assessment<br />
<strong>of</strong> <strong>the</strong> interval (plus or minus) that has a 95 percent probability <strong>of</strong> containing <strong>the</strong> true value. Confidence level categories are: 1, 10 percent; 2, 20 percent; 3, 30 percent; 4, 50 percent; 5, data insufficient to assess<br />
uncertainty. Subtotals rounded to two significant figures. Unless o<strong>the</strong>rwise noted, values were derived by taking <strong>the</strong> average <strong>of</strong> estimated discharge in <strong>the</strong> fall (Sept, Oct, Nov). USGS synoptic measurement<br />
data from Leonard <strong>and</strong> Harris (1974). Abbreviations: BOR, Bureau <strong>of</strong> Reclamation; CDWR, California Department <strong>of</strong> <strong>Water</strong> Resources; Cr, Creek; ft 3 /s, cubic feet per second; Hwy, Highway; mi, mile; NA,<br />
not applicable; NPS, National Park Service; OWRD, <strong>Oregon</strong> <strong>Water</strong> Resources Department; R, River; Res, Reservoir; RM, river mile; RR, rail road; USFS, U.S. Forest Service; USGS, U.S. Geological Survey]<br />
Number Stream name Reach<br />
Estimated gain<br />
(+) or loss (-)<br />
(ft 3 /s)<br />
Data source<br />
Period <strong>of</strong><br />
record<br />
Methods Remarks<br />
Confidence<br />
level<br />
32 Williamson<br />
River<br />
33 Williamson<br />
River<br />
34 Williamson<br />
River<br />
35 Wickiup<br />
Spring<br />
1 36 Williamson<br />
River<br />
37 Jackson<br />
Creek<br />
Head <strong>of</strong> River Springs<br />
(RM 86)<br />
Head <strong>of</strong> River (RM 86)<br />
to downstream side<br />
<strong>of</strong> reservoir below<br />
Bull Pasture (RM<br />
81)<br />
Reservoir (RM 81)<br />
to above Wickiup<br />
Spring (RM 79.8)<br />
8 OWRD synoptic<br />
measurement<br />
8 OWRD synoptic<br />
measurement<br />
14 OWRD synoptic<br />
measurement<br />
RM 79.8 24 OWRD synoptic<br />
measurement<br />
Below Wickiup Spring<br />
(RM 79.8) to<br />
OWRD gage below<br />
Sheep Cr (RM 67.7)<br />
Headwaters to road<br />
crossing<br />
0 OWRD synoptic<br />
measurement<br />
6 USFS<br />
measurements<br />
(68)<br />
11/2002 Synoptic measurement Dry conditions. Synoptic<br />
measurements made when<br />
OWRD gage below Sheep<br />
Cr (USGS Site 11491400)<br />
at 85 percent <strong>of</strong> average fall<br />
flows.<br />
11/2002 Synoptic measurement Dry conditions. Synoptic<br />
measurements made when<br />
OWRD gage below Sheep<br />
Cr (USGS Site 11491400)<br />
at 85 percent <strong>of</strong> average fall<br />
flows.<br />
11/2002 Synoptic measurement Dry conditions. Synoptic<br />
measurements made when<br />
OWRD gage below Sheep<br />
Cr (USGS Site 11491400)<br />
at 85 percent <strong>of</strong> average fall<br />
flows.<br />
11/2002 Synoptic measurement Dry conditions. Synoptic<br />
measurements made when<br />
OWRD gage below Sheep<br />
Cr (USGS Site 11491400)<br />
at 85 percent <strong>of</strong> average fall<br />
flows.<br />
11/2002 Synoptic measurement Dry conditions. Synoptic<br />
measurements made when<br />
OWRD gage below Sheep<br />
Cr (USGS Site 11491400)<br />
at 85 percent <strong>of</strong> average fall<br />
flows.<br />
11/1991-<br />
04/1997<br />
Miscellaneous measurement<br />
regression to Chewaucan near<br />
Paisley, Oreg. (USGS Site<br />
10384000).<br />
OWRD site 21420110 4<br />
2<br />
2<br />
2<br />
2<br />
2
78 <strong>Ground</strong>-<strong>Water</strong> <strong>Hydrology</strong> <strong>of</strong> <strong>the</strong> <strong>Upper</strong> <strong>Klamath</strong> <strong>Basin</strong>, <strong>Oregon</strong> <strong>and</strong> California<br />
Table 6. Estimated ground-water discharge to principal stream reaches in <strong>the</strong> upper <strong>Klamath</strong> <strong>Basin</strong>, <strong>Oregon</strong> <strong>and</strong> California.—Continued<br />
[Reach: River miles in Reach column are from <strong>Oregon</strong> <strong>Water</strong> Resources Department <strong>Klamath</strong> Drainage <strong>Basin</strong> Map, Map No. 14.6, 1971. Confidence level: Confidence levels represent a subjective assessment<br />
<strong>of</strong> <strong>the</strong> interval (plus or minus) that has a 95 percent probability <strong>of</strong> containing <strong>the</strong> true value. Confidence level categories are: 1, 10 percent; 2, 20 percent; 3, 30 percent; 4, 50 percent; 5, data insufficient to assess<br />
uncertainty. Subtotals rounded to two significant figures. Unless o<strong>the</strong>rwise noted, values were derived by taking <strong>the</strong> average <strong>of</strong> estimated discharge in <strong>the</strong> fall (Sept, Oct, Nov). USGS synoptic measurement<br />
data from Leonard <strong>and</strong> Harris (1974). Abbreviations: BOR, Bureau <strong>of</strong> Reclamation; CDWR, California Department <strong>of</strong> <strong>Water</strong> Resources; Cr, Creek; ft 3 /s, cubic feet per second; Hwy, Highway; mi, mile; NA,<br />
not applicable; NPS, National Park Service; OWRD, <strong>Oregon</strong> <strong>Water</strong> Resources Department; R, River; Res, Reservoir; RM, river mile; RR, rail road; USFS, U.S. Forest Service; USGS, U.S. Geological Survey]<br />
Number Stream name Reach<br />
Estimated gain<br />
(+) or loss (-)<br />
(ft 3 /s)<br />
Data source<br />
Period <strong>of</strong><br />
record<br />
Methods Remarks<br />
Confidence<br />
level<br />
38 Jack Creek Headwaters to Silver<br />
Lake Road<br />
39 Williamson<br />
River<br />
OWRD gage below<br />
Sheep Cr (RM 67.7)<br />
to above Cholo<br />
Ditch (RM 58.3)<br />
Subtotal for upper Williamson River 80<br />
2 OWRD synoptic<br />
measurement<br />
18 OWRD synoptic<br />
measurement<br />
03/2000 Synoptic measurement Wet conditions. Synoptic<br />
measurements made when<br />
OWRD gage below Sheep<br />
Cr (USGS Site 11491400)<br />
at 120 percent <strong>of</strong> average<br />
fall flows.<br />
03/2000 Synoptic measurement Wet conditions. Synoptic<br />
measurements made when<br />
OWRD gage below Sheep<br />
Cr (USGS Site 11491400)<br />
at 120 percent <strong>of</strong> average<br />
fall flows.<br />
4<br />
4<br />
40 <strong>Klamath</strong><br />
Marsh<br />
Cholo Ditch (RM 58.3)<br />
to Kirks Reef (RM<br />
27)<br />
Subtotal for <strong>Klamath</strong> Marsh 50<br />
50 USFWS<br />
marsh stage<br />
measurements<br />
<strong>and</strong> OWRD,<br />
USGS, USFWS<br />
gage data<br />
1971–2000 Mass balance. Annual Average Mass balance used gaged<br />
inflows <strong>and</strong> outflows,<br />
precipitation recorded<br />
at Chemult, <strong>and</strong> marsh<br />
evapotranspiration rates<br />
from USFWS rates coupled<br />
with ungaged tributary flow<br />
estimates<br />
5<br />
41 Big Springs<br />
Creek<br />
Headwaters to<br />
confluence with<br />
Lenz Cr<br />
42 Miller Creek Headwaters to National<br />
Forest Boundary<br />
(RM 8.3)<br />
34 OWRD<br />
measurements<br />
(33)<br />
10/1916–<br />
09/1987<br />
8 USFS gage 10/1992–<br />
09/1997<br />
Average Synoptic measurements<br />
demonstrate some gains<br />
to creek below confluence<br />
with Lenz Cr <strong>and</strong> above<br />
mouth<br />
Index regression to Eagle Cr<br />
above Skull Cr, near New<br />
Bridge, Oreg. (USGS Site<br />
13288200)<br />
OWRD site 61420102 3<br />
4
Table 6 79<br />
Table 6. Estimated ground-water discharge to principal stream reaches in <strong>the</strong> upper <strong>Klamath</strong> <strong>Basin</strong>, <strong>Oregon</strong> <strong>and</strong> California.—Continued<br />
[Reach: River miles in Reach column are from <strong>Oregon</strong> <strong>Water</strong> Resources Department <strong>Klamath</strong> Drainage <strong>Basin</strong> Map, Map No. 14.6, 1971. Confidence level: Confidence levels represent a subjective assessment<br />
<strong>of</strong> <strong>the</strong> interval (plus or minus) that has a 95 percent probability <strong>of</strong> containing <strong>the</strong> true value. Confidence level categories are: 1, 10 percent; 2, 20 percent; 3, 30 percent; 4, 50 percent; 5, data insufficient to assess<br />
uncertainty. Subtotals rounded to two significant figures. Unless o<strong>the</strong>rwise noted, values were derived by taking <strong>the</strong> average <strong>of</strong> estimated discharge in <strong>the</strong> fall (Sept, Oct, Nov). USGS synoptic measurement<br />
data from Leonard <strong>and</strong> Harris (1974). Abbreviations: BOR, Bureau <strong>of</strong> Reclamation; CDWR, California Department <strong>of</strong> <strong>Water</strong> Resources; Cr, Creek; ft 3 /s, cubic feet per second; Hwy, Highway; mi, mile; NA,<br />
not applicable; NPS, National Park Service; OWRD, <strong>Oregon</strong> <strong>Water</strong> Resources Department; R, River; Res, Reservoir; RM, river mile; RR, rail road; USFS, U.S. Forest Service; USGS, U.S. Geological Survey]<br />
Number Stream name Reach<br />
Estimated gain<br />
(+) or loss (-)<br />
(ft 3 /s)<br />
Data source<br />
Period <strong>of</strong><br />
record<br />
43 Sink Creek Headwaters to RM 6.2 4 USFS gage 10/1995–<br />
09/1997<br />
44 Scott Creek Headwaters to above<br />
Highway 232 (RM<br />
4.6)<br />
45 S<strong>and</strong> Creek Headwaters to above<br />
Highway 232 (RM<br />
5.8)<br />
Subtotal for <strong>Klamath</strong> Marsh tributaries 78<br />
9 OWRD(52) <strong>and</strong><br />
USFS(50)<br />
measurements<br />
06/1929–<br />
05/1993<br />
(OWRD)<br />
<strong>and</strong><br />
08/1991–<br />
05/1997<br />
(USFS)<br />
23 USFS gage 10/1992–<br />
09/1997<br />
Methods Remarks<br />
Index regression to Eagle Cr<br />
above Skull Cr, near New<br />
Bridge, Oreg. (USGS Site<br />
13288200)<br />
Miscellaneous measurement<br />
regression to Deschutes River<br />
below Snow Cr, near Lapine,<br />
Oreg. (USGS Site 14050000)<br />
Index regression to Deschutes<br />
River below Snow Cr, near<br />
Lapine,<br />
Oreg. (USGS Site 14050000)<br />
Confidence<br />
level<br />
OWRD site 61420104 2<br />
OWRD site 21420107 3<br />
OWRD site 61420103 3<br />
1 46 Williamson<br />
River<br />
47 Williamson<br />
River<br />
Kirks Reef (RM 27)<br />
to base <strong>of</strong> falls near<br />
Calimus (RM 22.2)<br />
Calimus (RM 22.2) to<br />
old USGS Station<br />
11494000 (RM 19.7)<br />
1 48 Larkin Creek At Williamson<br />
confluence (RM<br />
19.2)<br />
1 49 Larkin Springs At Williamson<br />
confluence (RM<br />
17.5)<br />
0 OWRD synoptic<br />
measurement<br />
22 OWRD<br />
measurements<br />
(16)<br />
10 OWRD<br />
measurements<br />
(27)<br />
10 OWRD synoptic<br />
measurement<br />
10/2002 Synoptic measurement 4<br />
10/1955–<br />
09/1973<br />
10/1923–<br />
11/1985<br />
Average Average <strong>of</strong> difference in<br />
concurrent flows recorded<br />
at Kirk (USGS Site<br />
11493500) <strong>and</strong> below<br />
Road 9730 (USGS Site<br />
11494000). From synoptic<br />
measurements on 10/2002,<br />
gains appear to occur below<br />
Calimus.<br />
Average OWRD site 21420105 3<br />
10/2002 Synoptic measurement 4<br />
3
80 <strong>Ground</strong>-<strong>Water</strong> <strong>Hydrology</strong> <strong>of</strong> <strong>the</strong> <strong>Upper</strong> <strong>Klamath</strong> <strong>Basin</strong>, <strong>Oregon</strong> <strong>and</strong> California<br />
Table 6. Estimated ground-water discharge to principal stream reaches in <strong>the</strong> upper <strong>Klamath</strong> <strong>Basin</strong>, <strong>Oregon</strong> <strong>and</strong> California.—Continued<br />
[Reach: River miles in Reach column are from <strong>Oregon</strong> <strong>Water</strong> Resources Department <strong>Klamath</strong> Drainage <strong>Basin</strong> Map, Map No. 14.6, 1971. Confidence level: Confidence levels represent a subjective assessment<br />
<strong>of</strong> <strong>the</strong> interval (plus or minus) that has a 95 percent probability <strong>of</strong> containing <strong>the</strong> true value. Confidence level categories are: 1, 10 percent; 2, 20 percent; 3, 30 percent; 4, 50 percent; 5, data insufficient to assess<br />
uncertainty. Subtotals rounded to two significant figures. Unless o<strong>the</strong>rwise noted, values were derived by taking <strong>the</strong> average <strong>of</strong> estimated discharge in <strong>the</strong> fall (Sept, Oct, Nov). USGS synoptic measurement<br />
data from Leonard <strong>and</strong> Harris (1974). Abbreviations: BOR, Bureau <strong>of</strong> Reclamation; CDWR, California Department <strong>of</strong> <strong>Water</strong> Resources; Cr, Creek; ft 3 /s, cubic feet per second; Hwy, Highway; mi, mile; NA,<br />
not applicable; NPS, National Park Service; OWRD, <strong>Oregon</strong> <strong>Water</strong> Resources Department; R, River; Res, Reservoir; RM, river mile; RR, rail road; USFS, U.S. Forest Service; USGS, U.S. Geological Survey]<br />
Number Stream name Reach<br />
50 Williamson<br />
River<br />
USGS gage<br />
(11494000) (RM<br />
19.7) to Larkin<br />
Springs confluence<br />
(RM 17.5)<br />
Estimated gain<br />
(+) or loss (-)<br />
(ft 3 /s)<br />
Data source<br />
6 OWRD synoptic<br />
measurement<br />
Period <strong>of</strong><br />
record<br />
Methods Remarks<br />
Confidence<br />
level<br />
10/2002 Synoptic measurement 4<br />
51 Spring Creek Just above Williamson<br />
confluence at RM<br />
16.5<br />
Subtotal for lower Williamson River 350<br />
300 OWRD<br />
measurements<br />
(39)<br />
09/1908–<br />
09/1993<br />
Average Small year to year variability 1<br />
52 Wood River Headwater springs to<br />
Dixon Road (RM<br />
16.2)<br />
53 Annie Creek Headwaters to National<br />
Park Boundary (RM<br />
5.7)<br />
54 Sun Creek Headwaters to National<br />
Park Boundary (RM<br />
5.0)<br />
55 Fort Creek Headwaters to near<br />
Hwy 62 (RM 1.0)<br />
56 Crooked Creek Headwaters to above<br />
Tecumseh Springs<br />
(RM 5.4) near Hwy<br />
62<br />
1 57 Tecumseh<br />
Springs<br />
250 OWRD<br />
measurements<br />
(68)<br />
11/1925–<br />
09/1989<br />
56 USFS gage 10/1992–<br />
09/1997<br />
13 NPS<br />
measurements<br />
(99)<br />
84 OWRD<br />
measurements<br />
(22)<br />
43 OWRD<br />
measurements<br />
(16)<br />
Tecumseh Springs 27 USGS/OWRD<br />
measurements<br />
(7)<br />
58 Agency Creek Headwaters to mouth 21 USGS/OWRD<br />
measurements<br />
(5)<br />
Subtotal for Wood River <strong>and</strong> tributaries 490<br />
07/1989–<br />
09/1997<br />
11/1954–<br />
03/1981<br />
11/1983–<br />
09/1987<br />
08/1907–<br />
10/1909<br />
04/1924–<br />
08/1954<br />
Index regression to Fall River<br />
near Lapine, Oreg. (USGS Site<br />
14057500)<br />
Index regression to Deschutes<br />
River below Snow Cr, near<br />
Lapine,<br />
Oreg. (USGS Site 14050000)<br />
Miscellaneous measurement<br />
regression to Deschutes River<br />
below Snow Cr, near Lapine,<br />
Oreg. (USGS Site 14050000)<br />
Index regression to Fall River<br />
near Lapine, Oreg. (USGS Site<br />
14057500)<br />
OWRD site 21420395 1<br />
OWRD site 61420301 2<br />
OWRD site 21420310 2<br />
OWRD site 21420398 1<br />
Average <strong>of</strong> all measurements 2<br />
Average <strong>of</strong> all measurements 3<br />
Average <strong>of</strong> all measurements 3
Table 6 81<br />
Table 6. Estimated ground-water discharge to principal stream reaches in <strong>the</strong> upper <strong>Klamath</strong> <strong>Basin</strong>, <strong>Oregon</strong> <strong>and</strong> California.—Continued<br />
[Reach: River miles in Reach column are from <strong>Oregon</strong> <strong>Water</strong> Resources Department <strong>Klamath</strong> Drainage <strong>Basin</strong> Map, Map No. 14.6, 1971. Confidence level: Confidence levels represent a subjective assessment<br />
<strong>of</strong> <strong>the</strong> interval (plus or minus) that has a 95 percent probability <strong>of</strong> containing <strong>the</strong> true value. Confidence level categories are: 1, 10 percent; 2, 20 percent; 3, 30 percent; 4, 50 percent; 5, data insufficient to assess<br />
uncertainty. Subtotals rounded to two significant figures. Unless o<strong>the</strong>rwise noted, values were derived by taking <strong>the</strong> average <strong>of</strong> estimated discharge in <strong>the</strong> fall (Sept, Oct, Nov). USGS synoptic measurement<br />
data from Leonard <strong>and</strong> Harris (1974). Abbreviations: BOR, Bureau <strong>of</strong> Reclamation; CDWR, California Department <strong>of</strong> <strong>Water</strong> Resources; Cr, Creek; ft 3 /s, cubic feet per second; Hwy, Highway; mi, mile; NA,<br />
not applicable; NPS, National Park Service; OWRD, <strong>Oregon</strong> <strong>Water</strong> Resources Department; R, River; Res, Reservoir; RM, river mile; RR, rail road; USFS, U.S. Forest Service; USGS, U.S. Geological Survey]<br />
Number Stream name Reach<br />
Estimated gain<br />
(+) or loss (-)<br />
(ft 3 /s)<br />
Data source<br />
Period <strong>of</strong><br />
record<br />
Methods Remarks<br />
Confidence<br />
level<br />
59 Sevenmile<br />
Creek<br />
1 60 Crane Creek Headwaters to<br />
Sevenmile Road<br />
1 61 Mares Egg<br />
Spring<br />
62 Sevenmile<br />
Creek<br />
Headwaters to RM 17 18 USFS gage 10/1992–<br />
09/1997<br />
11 USGS<br />
measurements<br />
(3)<br />
Headwaters to mouth 12 OWRD<br />
RM 17 to Sevenmile<br />
Road<br />
63 Cherry Creek Headwaters to West<br />
Side Road Crossing<br />
64 Fourmile<br />
Creek<br />
Headwaters to West<br />
Side Road Crossing<br />
Subtotal for o<strong>the</strong>r upper <strong>Klamath</strong> Lake<br />
tributaries<br />
measurement<br />
(1)<br />
60 OWRD<br />
measurements<br />
(9)<br />
05/1905–<br />
08/1911<br />
Index regression to North Umpqua<br />
River above Copel<strong>and</strong> Cr near<br />
Toketee Falls, Oreg. (USGS Site<br />
14316500)<br />
OWRD site 61420303 2<br />
Average <strong>of</strong> all measurements 4<br />
10/1954 Four measurements averaged<br />
2.4 ft 3 /s during summer <strong>of</strong><br />
1992 <strong>and</strong> 1994<br />
10/1908–<br />
10/1959<br />
12 USFS gage 10/1992–<br />
09/1997<br />
120<br />
2 USGS gage 10/1964–<br />
09/1967<br />
Average Unknown upstream diversions.<br />
OWRD Site 21420393<br />
Index regression to Rogue R above<br />
Prospect, Oreg. (USGS<br />
Site 14328000)<br />
Index regression to Deer Cr above<br />
Crane Prairie Res, near La Pine,<br />
Oreg. (USGS Site 14052000)<br />
OWRD site 61420302 <strong>and</strong> site<br />
21420397<br />
USGS Site 11505600,<br />
regulated at Fourmile Lake<br />
4<br />
2<br />
2<br />
4<br />
65 <strong>Upper</strong> <strong>Klamath</strong><br />
Lake<br />
<strong>Upper</strong> <strong>Klamath</strong><br />
Lake<br />
Subtotal for upper <strong>Klamath</strong> Lake 350<br />
350 USGS gages 10/1964–<br />
09/1967<br />
Mass balance. Annual average<br />
(rounded).<br />
Published water balanced<br />
study from Hubbard (1970).<br />
Analysis used measured<br />
inflows, outflows, lake<br />
elevations, <strong>and</strong> evaporation<br />
estimates. Agrees with<br />
o<strong>the</strong>r estimates (Cooper,<br />
2004)<br />
3<br />
66 Clear Lake Drainage to Clear Lake<br />
Reservoir Dam (RM<br />
78)<br />
40 USGS gage,<br />
BOR data<br />
10/1904–<br />
09/1951<br />
Average 10/1904–05/1909 USGS gage,<br />
06/1909–09/1951 (Bureau<br />
<strong>of</strong> Reclamation, 1954)<br />
4
82 <strong>Ground</strong>-<strong>Water</strong> <strong>Hydrology</strong> <strong>of</strong> <strong>the</strong> <strong>Upper</strong> <strong>Klamath</strong> <strong>Basin</strong>, <strong>Oregon</strong> <strong>and</strong> California<br />
Table 6. Estimated ground-water discharge to principal stream reaches in <strong>the</strong> upper <strong>Klamath</strong> <strong>Basin</strong>, <strong>Oregon</strong> <strong>and</strong> California.—Continued<br />
[Reach: River miles in Reach column are from <strong>Oregon</strong> <strong>Water</strong> Resources Department <strong>Klamath</strong> Drainage <strong>Basin</strong> Map, Map No. 14.6, 1971. Confidence level: Confidence levels represent a subjective assessment<br />
<strong>of</strong> <strong>the</strong> interval (plus or minus) that has a 95 percent probability <strong>of</strong> containing <strong>the</strong> true value. Confidence level categories are: 1, 10 percent; 2, 20 percent; 3, 30 percent; 4, 50 percent; 5, data insufficient to assess<br />
uncertainty. Subtotals rounded to two significant figures. Unless o<strong>the</strong>rwise noted, values were derived by taking <strong>the</strong> average <strong>of</strong> estimated discharge in <strong>the</strong> fall (Sept, Oct, Nov). USGS synoptic measurement<br />
data from Leonard <strong>and</strong> Harris (1974). Abbreviations: BOR, Bureau <strong>of</strong> Reclamation; CDWR, California Department <strong>of</strong> <strong>Water</strong> Resources; Cr, Creek; ft 3 /s, cubic feet per second; Hwy, Highway; mi, mile; NA,<br />
not applicable; NPS, National Park Service; OWRD, <strong>Oregon</strong> <strong>Water</strong> Resources Department; R, River; Res, Reservoir; RM, river mile; RR, rail road; USFS, U.S. Forest Service; USGS, U.S. Geological Survey]<br />
Number Stream name Reach<br />
67 Lost River Clear Lake Reservoir<br />
(RM 78) to Malone<br />
Dam (64.5)<br />
68 Gerber<br />
Reservoir<br />
Drainage to Gerber<br />
Reservoir<br />
69 Lost River Malone Dam (RM<br />
64.5) to Gift Road<br />
(RM 58)<br />
70 Lost River Gift Road (RM 58) to<br />
Keller Bridge (RM<br />
50.3)<br />
71 Lost River Keller Bridge (RM<br />
50.3) to east<br />
Bonanza (RM 45.1)<br />
72 Lost River East Bonanza (RM<br />
45.1) to Harpold<br />
Bridge (RM 43.9)<br />
73 Lost River Harpold Bridge (RM<br />
43.9) to Harpold<br />
Dam (RM 40.8)<br />
74 Lost River Harpold Dam (RM<br />
40.8) to Kirsh<br />
Bridge (RM 34.8)<br />
Estimated gain<br />
(+) or loss (-)<br />
(ft 3 /s)<br />
Data source<br />
Period <strong>of</strong><br />
record<br />
2 BOR data 08/1987–<br />
08/2002<br />
10 USGS gage,<br />
BOR data<br />
11 OWRD synoptic<br />
measurement<br />
16 OWRD synoptic<br />
measurement<br />
9 OWRD synoptic<br />
measurement<br />
61 OWRD synoptic<br />
measurement<br />
3 OWRD synoptic<br />
measurement<br />
10 OWRD synoptic<br />
measurement<br />
10/1904–<br />
09/1951<br />
Methods Remarks<br />
Mass balance. Only November<br />
average used due to missing<br />
data in o<strong>the</strong>r months.<br />
Discharge in river <strong>and</strong> canals<br />
below Malone Dam minus<br />
Clear Lake mean monthly<br />
releases. Gains within<br />
uncertainty <strong>of</strong> estimate.<br />
Average Flows at Gerber reported by<br />
Bureau <strong>of</strong> Reclamation<br />
(1954)<br />
Confidence<br />
level<br />
12/1997 Synoptic measurement 4<br />
12/1997 Synoptic measurement 4<br />
12/1997 Synoptic measurement Synoptic overall gains (73<br />
ft 3 /s) from Keller Bridge<br />
to Harpold Dam is close to<br />
<strong>the</strong> average (82 ft 3 /s) <strong>of</strong> 13<br />
measurements taken from<br />
11/1925–12/2001<br />
12/1997 Synoptic measurement Synoptic overall gains (73<br />
ft 3 /s) from Keller Bridge<br />
to Harpold Dam is close to<br />
<strong>the</strong> average (82 ft 3 /s) <strong>of</strong> 13<br />
measurements taken from<br />
11/1925–12/2001<br />
12/1997 Synoptic measurement Synoptic overall gains (73<br />
ft 3 /s) from Keller Bridge<br />
to Harpold Dam is close to<br />
<strong>the</strong> average (82 ft 3 /s) <strong>of</strong> 13<br />
measurements taken from<br />
11/1925–12/2001<br />
12/1997 Synoptic measurement 4<br />
4<br />
4<br />
3<br />
3<br />
3
Table 6 83<br />
Table 6. Estimated ground-water discharge to principal stream reaches in <strong>the</strong> upper <strong>Klamath</strong> <strong>Basin</strong>, <strong>Oregon</strong> <strong>and</strong> California.—Continued<br />
[Reach: River miles in Reach column are from <strong>Oregon</strong> <strong>Water</strong> Resources Department <strong>Klamath</strong> Drainage <strong>Basin</strong> Map, Map No. 14.6, 1971. Confidence level: Confidence levels represent a subjective assessment<br />
<strong>of</strong> <strong>the</strong> interval (plus or minus) that has a 95 percent probability <strong>of</strong> containing <strong>the</strong> true value. Confidence level categories are: 1, 10 percent; 2, 20 percent; 3, 30 percent; 4, 50 percent; 5, data insufficient to assess<br />
uncertainty. Subtotals rounded to two significant figures. Unless o<strong>the</strong>rwise noted, values were derived by taking <strong>the</strong> average <strong>of</strong> estimated discharge in <strong>the</strong> fall (Sept, Oct, Nov). USGS synoptic measurement<br />
data from Leonard <strong>and</strong> Harris (1974). Abbreviations: BOR, Bureau <strong>of</strong> Reclamation; CDWR, California Department <strong>of</strong> <strong>Water</strong> Resources; Cr, Creek; ft 3 /s, cubic feet per second; Hwy, Highway; mi, mile; NA,<br />
not applicable; NPS, National Park Service; OWRD, <strong>Oregon</strong> <strong>Water</strong> Resources Department; R, River; Res, Reservoir; RM, river mile; RR, rail road; USFS, U.S. Forest Service; USGS, U.S. Geological Survey]<br />
Number Stream name Reach<br />
75 Lost River Kirsh Bridge (RM<br />
34.8) to Stevenson<br />
Park (RM 30.5)<br />
76 Miller Creek Gerber Reservoir to<br />
mouth<br />
Estimated gain<br />
(+) or loss (-)<br />
(ft 3 /s)<br />
Subtotal for Lost River 200<br />
Data source<br />
29 OWRD synoptic<br />
measurement<br />
4 OWRD<br />
measurement<br />
<strong>and</strong> BOR<br />
reservoir<br />
outflow data<br />
Period <strong>of</strong><br />
record<br />
Methods Remarks<br />
Confidence<br />
level<br />
12/1997 Synoptic measurement 4<br />
12/1997 Mass balance from measurement<br />
<strong>and</strong> reservoir release data.<br />
4<br />
77 Williow Creek Measured at bridge<br />
crossing about 3 mi<br />
from headwater<br />
springs<br />
78 Cottonwood<br />
Creek<br />
Combined<br />
measurements <strong>of</strong><br />
headwaters<br />
springs<br />
79 Sheepy Creek Measured at road<br />
crossing (48N/1E-<br />
35) about 1 mi north<br />
<strong>of</strong> headwater springs<br />
80 Hot Creek Measured at outlet <strong>of</strong><br />
empty reservoir<br />
47N/1E-3 about 0.5<br />
mi from headwater<br />
springs<br />
Subtotal for lower <strong>Klamath</strong> Lake 35<br />
5.8 USGS<br />
measurements<br />
(4)<br />
10 USGS<br />
measurements<br />
(4)<br />
16 USGS<br />
measurements<br />
(5)<br />
3.4 CDWR <strong>and</strong><br />
USGS<br />
measurements<br />
12/1954–<br />
3/1955<br />
12/1954–<br />
5/1955<br />
11/1954–<br />
5/1955<br />
12/1954<br />
(stream)<br />
6/1954<br />
(wells)<br />
Average Wood, 1960 4<br />
Average Wood, 1960 4<br />
Average Wood, 1960 4<br />
Flow <strong>of</strong> spring-fed stream with<br />
probable contributions from<br />
flowing artesian wells<br />
subtracted<br />
Wood, 1960 4
84 <strong>Ground</strong>-<strong>Water</strong> <strong>Hydrology</strong> <strong>of</strong> <strong>the</strong> <strong>Upper</strong> <strong>Klamath</strong> <strong>Basin</strong>, <strong>Oregon</strong> <strong>and</strong> California<br />
Table 6. Estimated ground-water discharge to principal stream reaches in <strong>the</strong> upper <strong>Klamath</strong> <strong>Basin</strong>, <strong>Oregon</strong> <strong>and</strong> California.—Continued<br />
[Reach: River miles in Reach column are from <strong>Oregon</strong> <strong>Water</strong> Resources Department <strong>Klamath</strong> Drainage <strong>Basin</strong> Map, Map No. 14.6, 1971. Confidence level: Confidence levels represent a subjective assessment<br />
<strong>of</strong> <strong>the</strong> interval (plus or minus) that has a 95 percent probability <strong>of</strong> containing <strong>the</strong> true value. Confidence level categories are: 1, 10 percent; 2, 20 percent; 3, 30 percent; 4, 50 percent; 5, data insufficient to assess<br />
uncertainty. Subtotals rounded to two significant figures. Unless o<strong>the</strong>rwise noted, values were derived by taking <strong>the</strong> average <strong>of</strong> estimated discharge in <strong>the</strong> fall (Sept, Oct, Nov). USGS synoptic measurement<br />
data from Leonard <strong>and</strong> Harris (1974). Abbreviations: BOR, Bureau <strong>of</strong> Reclamation; CDWR, California Department <strong>of</strong> <strong>Water</strong> Resources; Cr, Creek; ft 3 /s, cubic feet per second; Hwy, Highway; mi, mile; NA,<br />
not applicable; NPS, National Park Service; OWRD, <strong>Oregon</strong> <strong>Water</strong> Resources Department; R, River; Res, Reservoir; RM, river mile; RR, rail road; USFS, U.S. Forest Service; USGS, U.S. Geological Survey]<br />
Number Stream name Reach<br />
Estimated gain<br />
(+) or loss (-)<br />
(ft 3 /s)<br />
Data source<br />
Period <strong>of</strong><br />
record<br />
Methods Remarks<br />
Confidence<br />
level<br />
81 <strong>Klamath</strong><br />
River<br />
82 Spencer<br />
Creek<br />
Keno Dam (RM 230.5)<br />
to below JC Boyle<br />
powerplant (RM<br />
218.1)<br />
190 USGS gage <strong>and</strong><br />
Pacific Corp.<br />
Reservoir data<br />
10/1967–<br />
10/1987,<br />
10/1989–<br />
09/2001<br />
Headwaters to mouth 27 USGS gage 10/1925–<br />
09/1931<br />
83 Fall Creek Headwaters to mouth 36 USGS gage 07/1928–<br />
09/1959<br />
84 Jenny Creek Headwaters to mouth 9 USGS gage 10/1922–<br />
09/1928<br />
85 <strong>Klamath</strong> River Below JC Boyle<br />
powerplant (RM<br />
218.1) to<br />
Iron Gate Dam<br />
92 USGS gage <strong>and</strong><br />
Pacific Corp.<br />
Reservoir data<br />
10/1967–<br />
09/2000<br />
Average (rounded). Mass balance.<br />
Derived from monthly mean<br />
discharge <strong>and</strong> reservoir content<br />
data. Excludes gains from<br />
Spencer Cr.<br />
Index regression to Rogue River<br />
above Prospect, Oreg. (USGS<br />
Site 14328000)<br />
Index regression to McCloud R<br />
near McCloud CA (USGS Site<br />
11367500)<br />
Index regression to South Fork Little<br />
Butte Cr near Lake Creek, Oreg.<br />
(USGS Site 14341500)<br />
Average. Mass balance from<br />
monthly mean discharge, reservoir<br />
content data, <strong>and</strong> tributary flow<br />
listed in table. Excludes gains<br />
from tributaries listed in table.<br />
USGS gages: (11509500)<br />
<strong>Klamath</strong> River at Keno,<br />
Oreg. <strong>and</strong> (11510700)<br />
<strong>Klamath</strong> River below JC<br />
Boyle powerplant near<br />
Keno, Oreg. Minus gains<br />
estimate from Spencer<br />
Creek.<br />
USGS Site 11510000.<br />
Restarted in 2002 by<br />
OWRD<br />
USGS Site 11512000 2<br />
USGS Site 11516500 3<br />
<strong>Klamath</strong> River below JC<br />
Boyle powerplant near<br />
Keno, Oreg. (USGS Site<br />
11510700) to <strong>Klamath</strong><br />
River below Iron Gate<br />
Dam, Calif. (USGS Site<br />
11516530). Minus gain<br />
estimates from tributaries.<br />
2<br />
3<br />
3<br />
Subtotal for <strong>Klamath</strong> River below Keno 350
Manuscript approved for publication, April 4, 2007<br />
Prepared by <strong>the</strong> USGS Publishing Network,<br />
Publishing Service Center, Tacoma,<br />
Bill Gibbs<br />
Donita Parker<br />
Linda Rogers<br />
Debra Grillo<br />
Ginger Renslow<br />
Bobbie Jo Richey<br />
For more information concerning <strong>the</strong> research in this report, contact <strong>the</strong><br />
<strong>Oregon</strong> <strong>Water</strong> Science Center Director<br />
U.S. Geological Survey<br />
10615 S.E. Cherry Blossom Dr.<br />
Portl<strong>and</strong>, OR 97216<br />
http://or.water.usgs.gov
Printed on recycled paper<br />
<strong>Ground</strong>-<strong>Water</strong> <strong>Hydrology</strong> <strong>of</strong> <strong>the</strong> <strong>Upper</strong> <strong>Klamath</strong> <strong>Basin</strong>,<br />
Gannett <strong>and</strong> o<strong>the</strong>rs SIR 2007–5050<br />
<strong>Oregon</strong> <strong>and</strong> California