Do birds respond to - International Bird Strike Committee
Do birds respond to - International Bird Strike Committee
Do birds respond to - International Bird Strike Committee

You also want an ePaper? Increase the reach of your titles
YUMPU automatically turns print PDFs into web optimized ePapers that Google loves.
INTERNATIONAL BIRD STRIKE COMMITTEE<br />
IBSC27/WP IV-4<br />
Athens, 23-27 May 2005<br />
DO BIRDS RESPOND TO INFRASOUND?<br />
A STUDY OF LOW FREQUENCY SOUND AS BIRD-DETERRING TECHNOLOGY<br />
Hugh Fidgen, Andrew Robinson and Andrew Timothy Baxter<br />
Central Science Labora<strong>to</strong>ry, Sand Hut<strong>to</strong>n, York, YO41 1LZ, UK<br />
Tel:+44(0)01904462071, Fax:+44(0)01904462071, Email:a.baxter@csl.gov.uk<br />
Abstract<br />
<strong>Bird</strong>strikes are a global problem costing the aviation industry billions of dollars each year. It was<br />
hypothesised that infrasound might play a role in <strong>birds</strong>’ detection of approaching aircraft, as it has<br />
been shown that various species can detect or produce low frequency sound. To test this, various<br />
artificial and recorded aircraft sounds at infrasonic frequencies were tested on groups of <strong>birds</strong><br />
(mean = 10) at a small airfield. Changes in bird behaviour were recorded, but only rarely did the<br />
<strong>birds</strong> lift or disperse and on these occasions no significant relationships with the frequencies or<br />
amplitudes of the sounds were established (P=0.554, P=0.456). It was concluded therefore that<br />
sounds of the frequency patterns and amplitude tested were not effective at deterring or scaring<br />
<strong>birds</strong>.<br />
Keywords: <strong>Bird</strong>strike, Infrasound, Low frequency sound.<br />
1. Introduction<br />
<strong>Bird</strong>s sometimes react <strong>to</strong> the approach of incoming helicopters before the normal point at which<br />
they would react <strong>to</strong> incoming propeller or jet aircraft (John Allan, Pers. Comm). A multitude of<br />
fac<strong>to</strong>rs could be responsible. One hypothesis was that <strong>birds</strong> hear approaching helicopters better<br />
due <strong>to</strong> low frequency noise emissions, which by their nature travel further and are attenuated less<br />
than higher audible frequencies. If this hypothesis could be validated then it might lead <strong>to</strong> new<br />
technology for the prevention of <strong>birds</strong>trikes.<br />
1.1 Background on infrasound<br />
It is generally accepted that frequencies below 100Hz are termed low frequency noise and those<br />
frequencies of 20Hz and below are termed infrasound (Berglund 1996). For the purpose of this<br />
study the following definitions are used: Those frequencies of 20kHz and above are termed<br />
ultrasound, 101Hz-20 kHz are termed audible sound, 20Hz-100Hz are low frequency sound and<br />
those frequencies below 20Hz are infrasound.<br />
Infrasound therefore has long wavelengths, meaning that is it subject <strong>to</strong> little absorption both<br />
from terrestrial objects or the atmosphere itself, as this requires objects with dimensions greater<br />
than the wavelength of the sound (Backteman 1983). This means that large barriers are needed<br />
<strong>to</strong> attenuate the sound. In the open field, such as the approach <strong>to</strong> an airfield, there are likely <strong>to</strong> be<br />
few objects of a sufficient size <strong>to</strong> attenuate infrasonic frequencies <strong>to</strong> the same extent as audible<br />
and ultrasonic frequencies.<br />
Infrasound itself is produced by numerous natural and man-made sources. It has been<br />
localised and detected from such diverse events as thunders<strong>to</strong>rms, waterfalls, earthquakes, and<br />
weather systems in mountain ranges. Man made sources of infrasound include road vehicles,<br />
rockets and missiles, ships, aircraft, and a whole raft of machinery from air-conditioning ducts <strong>to</strong><br />
almost any heavy plant or diesel machinery (Berglund, 1996; Kreithen and Quine, 1978;<br />
Backteman, 1983).<br />
1
Fidgen, Robinson, Baxter<br />
1.2 Perception of infrasound<br />
Human perception of infrasound sources varies with time of day and exposure <strong>to</strong> the source.<br />
Often low-frequency noise and infrasound are pervasive in our environment, becoming part of the<br />
general “background” or ambient noise people are exposed <strong>to</strong>. Yet people are not usually<br />
conscious of the low frequencies unless they are of sufficient amplitude. Low frequencies also<br />
tend <strong>to</strong> be masked by audible and higher frequency sound. But, at times when the masking effect<br />
of high frequencies is reduced, for example night-time or when within buildings, then low<br />
frequencies can dominate the spectrum of perceived noise (Berglund 1996). Backteman (1983)<br />
shows the amplitudes necessary <strong>to</strong> make infrasonic frequencies as audible <strong>to</strong> an observer (i.e. of<br />
the same phon or loudness) as 1 kHz <strong>to</strong>nes. Significantly larger amplitudes are required for the<br />
human ear <strong>to</strong> perceive the low frequencies at the same amplitude as the 1 kHz reference.<br />
1.3 Effects of infrasound on man<br />
In the 1960’s and 1970’s infrasound was blamed for many things from insomnia <strong>to</strong> loss of ability<br />
<strong>to</strong> concentrate. While very little credence was given <strong>to</strong> some of the more dire claims, several welldocumented<br />
effects were observed. If the sound pressure level (SPL) is large enough, temporary<br />
threshold shifts (TTS) can occur in the human ear. TTS symp<strong>to</strong>ms disappear with time, but are<br />
common in people who suffer prolonged occupational exposure <strong>to</strong> infrasound. However, a review<br />
by von Gierke and Nixon (1976) found that exposure <strong>to</strong> frequencies of 10-20Hz even at intense<br />
levels and for prolonged periods resulted in no long-term adverse effects on human hearing.<br />
Other possible effects include effects on cortisol levels due <strong>to</strong> disturbed sleep patterns (Ising,<br />
2002; Waye, 2002). In general however, these effects are limited <strong>to</strong> the small part of the<br />
population that are exposed <strong>to</strong> high levels of infrasound or are particularly sensitive <strong>to</strong> it.<br />
1.4 Effects of infrasound on <strong>Bird</strong>s<br />
The effects of infrasound on <strong>birds</strong> are poorly documented. Kreithen and Quine (1978) found that<br />
homing pigeons could detect infrasound as low as 0.05Hz in labora<strong>to</strong>ry conditions, and indeed at<br />
frequencies of 10Hz and below the pigeons were 50dB more sensitive than humans. Perhaps<br />
more intriguingly they also found that homing pigeons could detect minute <strong>Do</strong>ppler shifts in<br />
infrasound. Kreithen and Quine hypothesised that the pigeons were able <strong>to</strong> navigate by detecting<br />
these doppler shifts as they flew, in preference <strong>to</strong> trying <strong>to</strong> interpret binaural differences in<br />
amplitude, phase shift or timing. They hypothesised that this perhaps helped <strong>to</strong> explain the ability<br />
of homing pigeons <strong>to</strong> navigate by coastline or avoid approaching weather fronts.<br />
Apart from this study, very little has been done <strong>to</strong> investigate the frequencies that are audible <strong>to</strong><br />
<strong>birds</strong>, and there appears <strong>to</strong> be no research in the literature on the subject of the responses of<br />
<strong>birds</strong> <strong>to</strong> infrasound or their ability <strong>to</strong> perceive it. However, a recent piece of research on the<br />
vocalisations of the Cassowary has shown that the bird emits calls down as low as 20Hz. It may<br />
be inferred therefore that if the bird can produce such frequencies, then other individuals must be<br />
able <strong>to</strong> sense such signals (Mack, 2003).<br />
2. Materials and Methods<br />
Using a HHb PDR-1000 Portadat DAT recorder and microphone, shielded from the wind with a<br />
microphone casing, recordings were taken of a Tucano T1, Tornado F3, C130 Hercules, Hawk T1<br />
and Lynx, Gazelle, and Apache Helicopters. These sounds were then uploaded in<strong>to</strong> Adobe<br />
Audition, and sound clips of 30s isolated for each of the aircraft. These were then normalised in<br />
amplitude <strong>to</strong> -5dB within the software and spectrographs generated using Spectrogram v8.0<br />
©2003 Visualisation Software LLC. From these it was noticed that each type of aircraft had<br />
distinct sound wave patterns, generated by the moving propellers, blades, or jet engines. The<br />
Hawk and the Tornado emitted broadband noise over all frequencies. The propeller aircraft had a<br />
fundamental <strong>to</strong>ne followed by several over<strong>to</strong>nes or harmonics, as did the helicopters. The main<br />
difference between these though was that helicopters had a much lower fundamental of around<br />
20Hz compared <strong>to</strong> the Hercules for example, which was 50Hz. As a result of this, new sine waves<br />
were generated in Adobe Audition <strong>to</strong> mimic the Apache, Hercules and Tucano: 1 of 20Hz with 3<br />
harmonics of 40, 60 and 80Hz, 1 of 50Hz with 3 harmonics of 100, 150 and 200Hz and 1 of<br />
2
IBSC27/WP IV-4<br />
100Hz with 3 harmonics of 200, 300 and 400Hz. Broadband white noise was used <strong>to</strong> mimic the<br />
Jets. Each sound file was normalised <strong>to</strong> -5dB and was 30 seconds long. The raw sound files of<br />
the aircraft were also subjected <strong>to</strong> Hi-Pass fast-Fourier filters of 20Hz, 50Hz and 100Hz <strong>to</strong> test<br />
which range of low frequencies was the most effective. Recordings were also taken of bird<br />
distress calls from a Miltech Communications “Direc<strong>to</strong>r” bird scaring loudspeaker. In all 16 sounds<br />
were produced for testing, as shown in figure 1.<br />
Soundtrack Description<br />
1 Rook Distress Call<br />
2 Common Gull Distress Call<br />
3 Herring Gull Distress Call<br />
4 Black-Headed Gull Distress Call<br />
5 Tucano 20Hz Fast Fourier Cut-off filter<br />
6 Tucano 50Hz Fast Fourier Cut-off filter<br />
7 Tucano Complete<br />
8 Apache 20Hz Fast Fourier Cut-off filter<br />
9 Apache 50Hz Fast Fourier Cut-off filter<br />
10 Apache Unedited<br />
11 Tornado 20Hz Fast Fourier FFT Cut-off filter<br />
12 Tornado 50Hz Fast Fourier Cut-off filter<br />
13 Tornado Unedited<br />
14 Four Harmonics based on 20Hz fundamental<br />
15 Four Harmonics based on 50Hz fundamental<br />
16 Four Harmonics based on 100Hz fundamental<br />
17 Control – No sound<br />
Figure 1: The 16 soundtracks and the control that were tested.<br />
Two 16-46CS+ subwoofers from SVSubwoofers were ordered, along with a Samson<br />
S1000 1000 watt amplifier and two 250ft lengths of 12 gauge speaker wire. Interconnects for the<br />
Samson amplifier and a Cambridge Audio D500 CD player were made locally using Hi-Grade<br />
gold plated terminals and de-oxygenated copper wire. A Radioshack SPL meter and two 25m<br />
extension reels were also purchased.<br />
Whenever possible, the equipment was set up before dawn, <strong>to</strong> minimise disturbance. The<br />
extension cables were run out from the buildings <strong>to</strong> the amplifier and CD player, which were in<br />
the boot of the car, 50m out on<strong>to</strong> the grassed airfield. Next the 250ft lengths of speaker wire were<br />
run out <strong>to</strong> the limit of their reach on<strong>to</strong> the airfield, where they were connected <strong>to</strong> the speakers.<br />
The area immediately around the speakers was then baited with 1 loaf of supermarket white<br />
bread, <strong>to</strong>rn in<strong>to</strong> small pieces. It was desirable <strong>to</strong> avoid leaving the car during fieldwork as it was<br />
noticed that the <strong>birds</strong> <strong>to</strong>lerated the car’s presence at 50-60 metres, but would be scared by a lone<br />
human at 100 metres. (pers. ob.). The weather unfortunately dictated the days on which fieldwork<br />
could be conducted. If at any time the precipitation exceeded a very light drizzle, the speakers<br />
were covered <strong>to</strong> avoid weather damage. Having <strong>to</strong> approach the speakers <strong>to</strong> cover them<br />
obviously disrupted <strong>birds</strong> and fieldwork, so often it led <strong>to</strong> the abandonment of data collection.<br />
3
Fidgen, Robinson, Baxter<br />
In an attempt <strong>to</strong> habituate <strong>birds</strong> <strong>to</strong> the presence of the speakers, mock speakers were<br />
constructed and placed as close <strong>to</strong> the position the real speakers would occupy as flight safety on<br />
the airfield would allow.<br />
It became apparent during fieldwork that wind speed and direction affected the pattern of<br />
sound attenuation from the speakers. Therefore a practical attempt was made <strong>to</strong> assess the<br />
affect of wind on the propagation and amplitude of sound from the speakers using a handheld<br />
SPL meter from Radioshack. Readings were taken on three separate occasions with the sound<br />
pressure level meter. Readings were taken for 15Hz 20Hz and 30Hz sine waves at 0m, 1m, 5m<br />
and further 5m increments from the speakers in upwind, downwind and crosswind directions. This<br />
data was then analysed <strong>to</strong> show the effects of wind and distance on sound attenuation.<br />
2.1 Study Site<br />
Fieldwork was conducted from January 2004 <strong>to</strong> March 2004 at Pockling<strong>to</strong>n airfield, Yorkshire.<br />
Pockling<strong>to</strong>n is a decommissioned RAF WWII bomber airfield of 566.4 Ha with 4 runways.<br />
2.2 Data Collection<br />
In order <strong>to</strong> judge whether there was any change in bird behaviour, similar categories <strong>to</strong> those<br />
used in evaluating bird distress call efficacy were used, as shown in figure 2. The first six are<br />
standard categories used <strong>to</strong> determine the efficacy of bird scaring devices (Aubin, 1991), the last<br />
three categories were added for the purposes of this experiment in order <strong>to</strong> score the behaviour<br />
of the <strong>birds</strong> on the ground more accurately.<br />
Behaviour Category<br />
Description<br />
1 Alert <strong>Bird</strong> lifts head or displays sign it has noticed sound<br />
2 Lift <strong>Bird</strong> launches in<strong>to</strong> flight from ground<br />
3 Circle <strong>Bird</strong> circles over speakers<br />
4 Approach Flying <strong>birds</strong> at distance approach speakers<br />
5 Hold Flying <strong>birds</strong> stay in vicinity of speakers despite sound<br />
6 Disperse <strong>Bird</strong>s remove themselves from the area<br />
7 Loafing <strong>Bird</strong>s sitting or perching<br />
8 Preening <strong>Bird</strong>s preening while on ground<br />
9 Feeding <strong>Bird</strong>s actively searching for food or eating food items<br />
Figure 2: Behavioural categories used during fieldwork<br />
Wind speed (mean of 10 readings with an wind meter); wind direction, time, cloud cover<br />
(estimated in eighths); precipitation; temperature; number of <strong>birds</strong> present; position of <strong>birds</strong><br />
relative <strong>to</strong> the speakers; and species of the <strong>birds</strong> were noted. The position of the <strong>birds</strong> relative <strong>to</strong><br />
the speaker was obtained using a laser range finder. Minimum and maximum distances of <strong>birds</strong><br />
from the speakers were calculated. Generally any <strong>birds</strong> near the speakers were there <strong>to</strong> feed on<br />
the bread laid as bait, so they stayed in one place long enough <strong>to</strong> perform the experiment. The<br />
<strong>birds</strong> were recorded individually where possible; otherwise they were grouped by species and<br />
area.<br />
Once the position and behaviour of the <strong>birds</strong> had been recorded, then a sound file was played for<br />
30 seconds, and the position and behaviour of the <strong>birds</strong> was recorded again, noting any<br />
behavioural changes that had occurred while the sound was playing. Behavioural changes were<br />
then categorised further in<strong>to</strong> marked changes and slight changes. Any behavioural change<br />
resulting in lift or disperse were termed “marked behavioural changes” and recorded in the<br />
Diff_Max category. Those resulting in alert, hold and approach were termed “slight behavioural<br />
changes” and recorded in the Diff_Any category. Behavioural changes between feeding, loafing,<br />
preening and circling were considered not <strong>to</strong> be as a result of the speakers and not categorised<br />
further.<br />
4
IBSC27/WP IV-4<br />
3. Results<br />
3.1 Sound Attenuation and the Effect of Wind<br />
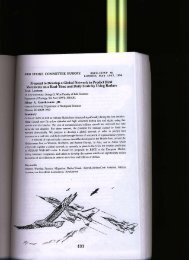
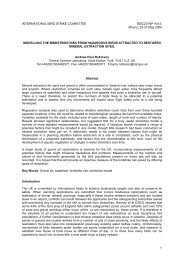
Figure 3 shows the expected and observed effects of distance from the speaker on SPL in<br />
upwind, crosswind and downwind directions. The formula for sound attenuation at position r 2<br />
relative <strong>to</strong> position r 1 is:<br />
(dB = decibel level at r 1 ; P 1 = pressure at r 1 ; P 2 = pressure at r 2 )<br />
SPL 2 = SPL 1 – 20log 10 (P 1 /P 2 ),dB<br />
The speakers’ SPL at 1m was consistently 98dB despite any wind. The formula above was<br />
used <strong>to</strong> create an “expected” attenuation plot of the sound from the speakers with 98dB as a<br />
reference point, and this was plotted alongside the mean values from the observed data. This<br />
was then used <strong>to</strong> calculate the SPL at any given distance from the speakers: dB_Min and<br />
dB_Max. The slope of the line is expressed as: y = -8.6562Ln(x) + 98<br />
120<br />
100<br />
80<br />
Amplitude (dB) 1m = 98<br />
60<br />
40<br />
Expected<br />
observed<br />
20<br />
0<br />
0 5 10 15 20 25 30 35 40<br />
Distance from speakers (m)<br />
Figure 3: Attenuation of sound from the speakers with distance. Expected refers <strong>to</strong> the plot<br />
calculated from SPL 2 = SPL 1 – 20log 10 (P 1 /P 2 ),dB. Observed refers <strong>to</strong> the mean values from<br />
experimental data.<br />
5
Fidgen, Robinson, Baxter<br />
3.2 Sound spectrographs<br />
80<br />
70<br />
60<br />
Amplitude dB<br />
50<br />
40<br />
30<br />
20<br />
10<br />
0<br />
1.3<br />
14.8<br />
28.3<br />
41.7<br />
55.2<br />
68.6<br />
82.1<br />
95.6<br />
109<br />
122.5<br />
135.9<br />
149.4<br />
162.8<br />
176.3<br />
189.8<br />
203.2<br />
216.7<br />
230.1<br />
243.6<br />
Frequency Hz<br />
257.1<br />
270.5<br />
284<br />
297.4<br />
310.9<br />
324.3<br />
337.8<br />
351.3<br />
364.7<br />
378.2<br />
391.6<br />
405.1<br />
418.6<br />
432<br />
445.5<br />
458.9<br />
472.4<br />
485.8<br />
499.3<br />
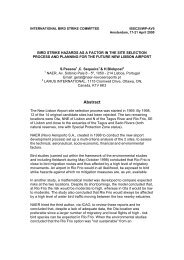
Figure 4: The <strong>to</strong>p spectrogram is that of an Apache Helicopter at full power. Amplitude is denoted<br />
lighter colours, the Y axis denotes frequency. The bot<strong>to</strong>m frequency graph shows the same data,<br />
frequencies emitted by the Apache and their amplitude. Distance from the aircraft is not known.<br />
Note the harmonics rooted at 20hz.<br />
6
IBSC27/WP IV-4<br />
70<br />
60<br />
50<br />
Amplitude (dB)<br />
40<br />
30<br />
20<br />
10<br />
0<br />
1.3<br />
14.8<br />
28.3<br />
41.7<br />
55.2<br />
68.6<br />
82.1<br />
95.6<br />
109<br />
122.5<br />
135.9<br />
149.4<br />
162.8<br />
176.3<br />
189.8<br />
203.2<br />
216.7<br />
230.1<br />
243.6<br />
Frequency (Hz)<br />
257.1<br />
270.5<br />
284<br />
297.4<br />
310.9<br />
324.3<br />
337.8<br />
351.3<br />
364.7<br />
378.2<br />
391.6<br />
405.1<br />
418.6<br />
432<br />
445.5<br />
458.9<br />
472.4<br />
485.8<br />
499.3<br />
Figure 5: The <strong>to</strong>p spectrogram is that of a Hercules C130 transport aircraft while taxiing.<br />
Amplitude is denoted lighter colours, the Y axis denotes frequency. The bot<strong>to</strong>m frequency graph<br />
shows the same data, frequencies emitted by the Hercules and their amplitude. Distance from the<br />
aircraft is not known. Note the harmonics rooted at 50hz.<br />
7
Fidgen, Robinson, Baxter<br />
60<br />
50<br />
40<br />
Amplitude (dB)<br />
30<br />
20<br />
10<br />
0<br />
1.3<br />
14.8<br />
28.3<br />
41.7<br />
55.2<br />
68.6<br />
82.1<br />
95.6<br />
109<br />
122.5<br />
135.9<br />
149.4<br />
162.8<br />
176.3<br />
189.8<br />
203.2<br />
216.7<br />
230.1<br />
243.6<br />
Frequency (Hz)<br />
257.1<br />
270.5<br />
284<br />
297.4<br />
310.9<br />
324.3<br />
337.8<br />
351.3<br />
364.7<br />
378.2<br />
391.6<br />
405.1<br />
418.6<br />
432<br />
445.5<br />
458.9<br />
472.4<br />
485.8<br />
499.3<br />
Figure 6: The <strong>to</strong>p spectrogram is that of a Tornado F3 at full power. Amplitude is denoted lighter<br />
colours, the Y axis denotes frequency. The bot<strong>to</strong>m frequency graph shows the same data,<br />
frequencies emitted by the Tornado and their amplitude. Distance from the aircraft is not known.<br />
Note there are no harmonics.<br />
3.3 Fieldwork Results<br />
Analysis was conducted in Microsoft Excel 2000; SPSS v.11.0 © SPSS Inc 1989-2001; and<br />
GenStat® v.7.<br />
8
IBSC27/WP IV-4<br />
Regression analysis was used <strong>to</strong> determine the significance of the bird behavioural changes<br />
and the decibel levels they were exposed <strong>to</strong>. Using Genstat General Linear Models option the<br />
changes in behaviour variables Diff_Any (any change in behaviour) and Diff_Max (only marked<br />
and adverse changes in behaviour) were modelled against, species grouping, soundtrack and<br />
dB_max. The tests were repeated for dB_Min. (Figure 7). The same model was repeated with<br />
soundtrack as the only fac<strong>to</strong>r, as shown in figure 8.<br />
Behavioural Change Amplitude at <strong>birds</strong> Mean deviance P<br />
Diff_Any dB_max 0.5546 0.456<br />
dB_Min 0.1246 0.724<br />
Diff_Max dB_max 4.071 0.949<br />
dB_Min 2.239 0.135<br />
Figure 7: Diff_Any and Diff_Max tested against general linear model = Bernoulli<br />
logistic regression modelled with dB_max/dB_Min, species and soundtrack<br />
Behavioural Change Variable Mean deviance P<br />
Diff_Any soundtrack 0.3501 0.554<br />
Figure 8: Diff_Any tested against general linear model = Bernoulli logistic regression<br />
modelled with soundtrack.<br />
Figure 9 shows the 16 test soundtracks compared against the control category, 17. Expected<br />
values for Diff_Any and Diff_Max were calculated using the control, and then compared against<br />
the observed Diff_Any and Diff_Max. Differences between observed and expected are displayed<br />
as a percentage value.<br />
Sound Track N Expected<br />
Count<br />
Diff_Any Percentage<br />
Count<br />
Diff_Max Percentage<br />
1 10 3.3 8 80.0 8 80.0<br />
2 7 2.3 3 42.9 3 42.9<br />
3 9 3.0 5 55.6 5 55.6<br />
4 7 2.3 2 28.6 2 28.6<br />
5 24 7.9 5 20.8 0 0.0<br />
6 18 5.9 1 5.6 0 0.0<br />
7 26 8.6 7 26.9 5 19.2<br />
8 20 6.6 3 15.0 2 10.0<br />
9 18 5.9 2 11.1 1 5.6<br />
10 18 5.9 1 5.6 0 0.0<br />
11 5 1.7 0 0.0 0 0.0<br />
12 5 1.7 0 0.0 0 0.0<br />
13 5 1.7 3 60.0 0 0.0<br />
14 17 5.6 9 52.9 3 17.6<br />
15 17 5.6 3 17.6 0 0.0<br />
16 12 4.0 2 16.7 0 0.0<br />
17 9 - 3 33.3 3 33.3<br />
Figure 9: Data of the 17 soundtracks, showing the Diff_Any and Diff_Max counts and expressing<br />
them as a percentage of the control group (no sounds were played).<br />
9
Fidgen, Robinson, Baxter<br />
4. Discussion of Results<br />
From the first tests it was apparent that the <strong>birds</strong> did not appear <strong>to</strong> <strong>respond</strong> <strong>to</strong> the sounds. There<br />
are two explanations, firstly that the <strong>birds</strong> were <strong>to</strong>o far from the speakers, and so the sounds<br />
would have been
IBSC27/WP IV-4<br />
The baiting of the speakers before fieldwork could have motivated the <strong>birds</strong> <strong>to</strong> endure sounds<br />
they otherwise would normally have dispersed from. The motivation of <strong>birds</strong> and the scaring<br />
potential of devices are discussed in several papers and Spanier (1980) for example, found that<br />
bio-acoustic bird scaring methods could only be relied upon <strong>to</strong> deter Night Herons (Nycticorax<br />
nycticorax) if the <strong>birds</strong> had convenient alternative resources they could move <strong>to</strong>. Brough (1969)<br />
also stated that feeding <strong>birds</strong> were more difficult <strong>to</strong> repel when food was scarce elsewhere in their<br />
environment than if food was plentiful. At the time of the fieldwork the ground was often wet and<br />
soft, and several fields nearby were in the process of being ploughed and sown with crops,<br />
meaning there should have been other sources of food readily available <strong>to</strong> the <strong>birds</strong>. If the <strong>birds</strong><br />
could not be dispersed from near the speakers in the presence of food, then they were not<br />
effective bird-deterring devices. Other studies such as that by Baxter (2004), which was of a<br />
similar duration <strong>to</strong> this, have shown that <strong>birds</strong> can be completely cleared from a waste<br />
management facility.<br />
The only way <strong>to</strong> better control behaviour, the effects of motivational state of the bird caused<br />
by hunger, and habituation or naivety <strong>to</strong> aircraft noises would be <strong>to</strong> conduct labora<strong>to</strong>ry-based<br />
experiments with captive <strong>birds</strong>. If, however, infrasound cannot be proved <strong>to</strong> be an effective<br />
method of scaring <strong>birds</strong> in the wild it is no use as a practical method of removing <strong>birds</strong> from<br />
airports or sensitive sites.<br />
4.2 General Discussion<br />
<strong>Bird</strong>s have been exposed <strong>to</strong> natural infrasound throughout their evolutionary development, and<br />
there is evidence that, some species at least, have developed a sense able <strong>to</strong> detect or use<br />
infrasound (Kreithen and Quine 1978; Mack 2003). With these senses it is not impossible that<br />
such <strong>birds</strong> can detect man-made infrasound such as those emitted by aircraft. It is not known if<br />
<strong>birds</strong> are able <strong>to</strong> distinguish between sources of low frequency sounds or if they can recognise<br />
certain waveforms and equate them <strong>to</strong> different categories of aircraft. If, as might be possible, a<br />
cassowary can distinguish another cassowary by its infrasound pattern then it is possible that<br />
<strong>birds</strong> may have the capability <strong>to</strong> distinguish between aircraft using the low frequencies aircraft<br />
emit. Further study of the ability of <strong>birds</strong> <strong>to</strong> hear infrasound and the senses <strong>birds</strong> use <strong>to</strong> avoid<br />
aircraft is required. For example, it is not known if the stimulus that causes <strong>birds</strong> on airports <strong>to</strong><br />
move away from danger is purely acoustic or whether <strong>birds</strong> need a combination of acoustic and<br />
optical stimuli. <strong>Bird</strong>s that are resident on airfields or make regular use of them will be exposed <strong>to</strong><br />
both the sights and sounds of aircraft over a protracted period. It is likely that the <strong>birds</strong> use more<br />
than one sense when detecting approaching aircraft, something that was not tested here. It may<br />
also be true that the <strong>birds</strong> present in this project had not previously been exposed <strong>to</strong> helicopters<br />
and so had not learnt that the particular audio stimulus of helicopter noise was <strong>to</strong> be avoided. The<br />
<strong>birds</strong> on Pockling<strong>to</strong>n, if they were resident, would only have been exposed <strong>to</strong> gliders launched by<br />
a winch, so it is possible that the population was naïve with regard <strong>to</strong> having been exposed <strong>to</strong> the<br />
dangers of aircraft.<br />
It is possible that the absence of positive results was due <strong>to</strong> the observer missing more subtle<br />
behavioural reactions by the <strong>birds</strong>. This was mainly due <strong>to</strong> the fact that it was difficult <strong>to</strong> keep an<br />
eye on all individuals in a flock of up <strong>to</strong> 48 <strong>birds</strong> (Mean = 9.99). Recording the experiments and<br />
using video decoding technology could improve the method. For the purposes of investigating<br />
low frequency sound as an effective bird deterrent however, it was desirable <strong>to</strong> have marked<br />
reactions such as those described by the lift and disperse categories, which were always obvious<br />
and easy <strong>to</strong> record. These behavioural changes when they occurred were subsequently<br />
categorised as Diff_Max.<br />
The use of distress calls in the experiment was a test of whether the <strong>birds</strong> actually <strong>respond</strong>ed<br />
<strong>to</strong> the speakers using known deterring aural stimuli. As it was, in almost all cases the target<br />
species dispersed on hearing the distress calls supporting the evidence in the literature that they<br />
are an effective method of dispersing <strong>birds</strong>. <strong>Bird</strong>s would therefore <strong>respond</strong> <strong>to</strong> the speakers if the<br />
sounds that were played had scaring potential. Figure 9 shows that the distress calls were<br />
effective but the other sound tested were not. One interesting experiment that was not tried would<br />
11
Fidgen, Robinson, Baxter<br />
be <strong>to</strong> change the pitch of the distress calls down <strong>to</strong> lower frequencies and see if they still had the<br />
same effect. If effective infrasonic distress calls could be developed then they would be very<br />
useful as a bird-deterring method as they would be broadly inaudible <strong>to</strong> humans and cause less<br />
disturbance than their audible versions.<br />
5. Conclusions<br />
This paper has shown that, with common and readily available equipment as used here, it is not<br />
possible <strong>to</strong> effectively scare or deter <strong>birds</strong> using low frequency sound and infrasound. <strong>Bird</strong>s may<br />
be able <strong>to</strong> hear infrasonic frequencies as on occasion they <strong>respond</strong>ed <strong>to</strong> the sounds tested, but at<br />
moderate decibel levels and with the frequencies used, the <strong>birds</strong> did not disperse or avoid the<br />
location of the speakers. It is possible that the sounds played were not accurate enough mimics<br />
of approaching aircraft and so did not replicate the situation leading <strong>to</strong> the observations described<br />
in the first lines of this paper. In summary, the infrasound production described here, produced<br />
with commercially available equipment and the sound files tested, is not a viable or effective<br />
method for deterring <strong>birds</strong>.<br />
6. Acknowledgements<br />
I would like <strong>to</strong> thank Dr. John Allan of Central Science Labora<strong>to</strong>ry and Dr. Jeremy Searle of the<br />
Biology Department at the University of York, as well as the entire <strong>Bird</strong>strike Avoidance Team at<br />
CSL for providing advice, help and support. Finally I would like <strong>to</strong> thank the RAF for allowing me<br />
access <strong>to</strong> their airfields and aircraft and the Wolds Gliding Club for the use of Pockling<strong>to</strong>n airfield.<br />
7. References<br />
AUBIN, T. (1991). Why do distress calls evoke interspecific responses? An experimental study<br />
applied <strong>to</strong> some species of <strong>birds</strong>. Behavioural Processes, 23, 103-111<br />
BACKTEMAN, O., KOHLER, J., SJOBERG, L. (1983). Infrasound – Tu<strong>to</strong>rial and Review: Part 1.<br />
Journal Low Frequency Noise and Vibration, 2(3), 96-112<br />
BACKTEMAN, O., KOHLER, J., SJOBERG, L. (1983). Infrasound – Tu<strong>to</strong>rial and Review: Part 2.<br />
Journal Low Frequency Noise and Vibration, 2(4), 96-112<br />
BACKTEMAN, O., KOHLER, J., SJOBERG, L. (1984). Infrasound – Tu<strong>to</strong>rial and Review: Part 3.<br />
Journal Low Frequency Noise and Vibration, 3(1), 96-112<br />
BACKTEMAN, O., KOHLER, J., SJOBERG, L. (1984). Infrasound – Tu<strong>to</strong>rial and Review: Part 4.<br />
Journal Low Frequency Noise and Vibration, 3(2), 96-112<br />
BAXTER, A.T. (2000). Use of distress calls <strong>to</strong> deter <strong>birds</strong> from landfills near airports. Proceedings<br />
of 25th Meeting <strong>International</strong> <strong>Bird</strong> <strong>Strike</strong> <strong>Committee</strong>, Amsterdam 2000.<br />
BERGLUND, B., HASSMEN, P. (1996). Sources and effects of low frequency noise. Journal of<br />
the Acoustic Society of America, 99(5), 2985-3002<br />
BROUGH, T. (1969). The dispersal of starlings from woodland roosts and the use of bioacoustics.<br />
Journal of Applied Ecology, 6, 403-410<br />
GIERKE, H.E. VON., NIXON, C.W. (1976). Effects of intense infrasound on man. Infrasound and<br />
Low Frequency Vibration. Edited by W. Tempest (Academic, London), pp 115-150<br />
ISING, H., ISING, M (2002). Chronic Cortisol increases in the first half of the night caused by road<br />
traffic noise. Noise and Health, 16(4), 13-21<br />
KREITHEN, M., QUINE, D.B. (1979). Infrasound detection by the homing pigeon: A behavioural<br />
audiogram. Journal of Comparative Physiology, 129, 1-4<br />
MACK, A.L., JONES, J. (2003). Low frequency vocalizations by cassowaries (Casuarius spp).<br />
The Auk, 120(4), 1062-1068<br />
SPANIER, E. (1980). The use of distress calls <strong>to</strong> repel night herons (Nycticorax nycticorax) from<br />
fish ponds. Journal of Applied Ecology, 17, 287-294<br />
WAYE, K.P., CLOW, A. (2002). Effects of night time low frequency noise on the cortisol response<br />
<strong>to</strong> awakening and subjective sleep quality. Life Sciences 72 863-875<br />
12