- Page 1 and 2: Amadeus Annual Report 2010
- Page 4: Index CEO message__________________
- Page 8: Amadeus at a glance 1
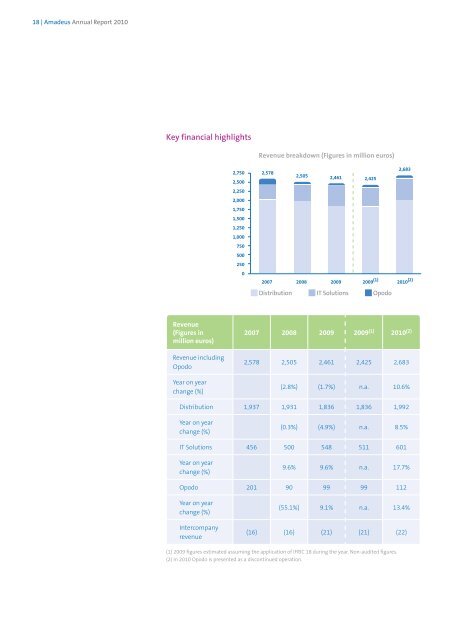
- Page 12: 12 | Amadeus Annual Report 2010 Ann
- Page 16: 16 | Amadeus Annual Report 2010 Ann
- Page 22: 2 Economic, social and environmenta
- Page 26: 26 | Amadeus Annual Report 2010 Ann
- Page 30: 23 Economic, social and Amadeus env
- Page 34: 34 | Amadeus Annual Report 2010 Ann
- Page 38: 38 | Amadeus Annual Report 2010 Ann
- Page 42: 42 | Amadeus Annual Report 2010 Ann
- Page 46: 46 | Amadeus Annual Report 2010 Ann
- Page 50: 50 | Amadeus Annual Report 2010 Ann
- Page 54: 54 | Amadeus Annual Report 2010 Ann
- Page 58: 58 | Amadeus Annual Report 2010 Ann
- Page 62: 62 | Amadeus Annual Report 2010 Ann
- Page 66: 66 | Amadeus Annual Report 2010 Ann
- Page 70:
70 | Amadeus Annual Report 2010 Ann
- Page 74:
24 Economic, social and environment
- Page 78:
78 | Amadeus Annual Report 2010 Ann
- Page 82:
25 Economic, social and environment
- Page 86:
86 | Amadeus Annual Report 2010 Ann
- Page 90:
90 | Amadeus Annual Report 2010 Ann
- Page 94:
94 | Amadeus Annual Report 2010 Ann
- Page 98:
98 | Amadeus Annual Report 2010 Ann
- Page 102:
102 | Amadeus Annual Report 2010 An
- Page 106:
27 Economic, social and Commitment
- Page 110:
110 | Amadeus Annual Report 2010 An
- Page 114:
8 Corporate information and Glossar
- Page 118:
Amadeus Annual Report 2010 Consolid
- Page 122:
Amadeus IT Holding, S.A. and Subsid
- Page 128:
AMADEUS IT HOLDING, S.A. AND SUBSID
- Page 132:
AMADEUS IT HOLDING, S.A. AND SUBSID
- Page 136:
AMADEUS IT HOLDING, S.A. AND SUBSID
- Page 140:
AMADEUS IT HOLDING, S.A. AND SUBSID
- Page 144:
AMADEUS IT HOLDING, S.A. AND SUBSID
- Page 148:
AMADEUS IT HOLDING, S.A. AND SUBSID
- Page 152:
AMADEUS IT HOLDING, S.A. AND SUBSID
- Page 156:
AMADEUS IT HOLDING, S.A. AND SUBSID
- Page 160:
AMADEUS IT HOLDING, S.A. AND SUBSID
- Page 164:
AMADEUS IT HOLDING, S.A. AND SUBSID
- Page 168:
AMADEUS IT HOLDING, S.A. AND SUBSID
- Page 172:
AMADEUS IT HOLDING, S.A. AND SUBSID
- Page 176:
AMADEUS IT HOLDING, S.A. AND SUBSID
- Page 180:
AMADEUS IT HOLDING, S.A. AND SUBSID
- Page 184:
AMADEUS IT HOLDING, S.A. AND SUBSID
- Page 188:
AMADEUS IT HOLDING, S.A. AND SUBSID
- Page 192:
AMADEUS IT HOLDING, S.A. AND SUBSID
- Page 196:
AMADEUS IT HOLDING, S.A. AND SUBSID
- Page 200:
AMADEUS IT HOLDING, S.A. AND SUBSID
- Page 204:
AMADEUS IT HOLDING, S.A. AND SUBSID
- Page 208:
AMADEUS IT HOLDING, S.A. AND SUBSID
- Page 212:
AMADEUS IT HOLDING, S.A. AND SUBSID
- Page 216:
AMADEUS IT HOLDING, S.A. AND SUBSID
- Page 220:
AMADEUS IT HOLDING, S.A. AND SUBSID
- Page 224:
AMADEUS IT HOLDING, S.A. AND SUBSID
- Page 228:
AMADEUS IT HOLDING, S.A. AND SUBSID
- Page 232:
AMADEUS IT HOLDING, S.A. AND SUBSID
- Page 236:
AMADEUS IT HOLDING, S.A. AND SUBSID
- Page 240:
AMADEUS IT HOLDING, S.A. AND SUBSID
- Page 244:
AMADEUS IT HOLDING, S.A. AND SUBSID
- Page 248:
AMADEUS IT HOLDING, S.A. AND SUBSID
- Page 252:
AMADEUS IT HOLDING, S.A. AND SUBSID
- Page 256:
AMADEUS IT HOLDING, S.A. AND SUBSID
- Page 260:
AMADEUS IT HOLDING, S.A. AND SUBSID
- Page 264:
AMADEUS IT HOLDING, S.A. AND SUBSID
- Page 268:
AMADEUS IT HOLDING, S.A. AND SUBSID
- Page 272:
AMADEUS IT HOLDING, S.A. AND SUBSID
- Page 276:
AMADEUS IT HOLDING, S.A. AND SUBSID
- Page 280:
AMADEUS IT HOLDING, S.A. AND SUBSID
- Page 284:
AMADEUS IT HOLDING, S.A. AND SUBSID
- Page 288:
AMADEUS IT HOLDING, S.A. AND SUBSID
- Page 292:
AMADEUS IT HOLDING, S.A. AND SUBSID
- Page 296:
AMADEUS IT HOLDING, S.A. AND SUBSID
- Page 300:
AMADEUS IT HOLDING, S.A. AND SUBSID
- Page 304:
AMADEUS IT HOLDING, S.A. AND SUBSID
- Page 308:
AMADEUS IT HOLDING, S.A. AND SUBSID
- Page 312:
AMADEUS IT HOLDING, S.A. AND SUBSID
- Page 316:
AMADEUS IT HOLDING, S.A. AND SUBSID
- Page 320:
AMADEUS IT HOLDING, S.A. AND SUBSID
- Page 324:
AMADEUS IT HOLDING, S.A. AND SUBSID
- Page 328:
AMADEUS IT HOLDING, S.A. AND SUBSID
- Page 332:
AMADEUS IT HOLDING, S.A. AND SUBSID
- Page 336:
AMADEUS IT HOLDING, S.A. AND SUBSID
- Page 340:
AMADEUS IT HOLDING, S.A. AND SUBSID
- Page 344:
AMADEUS IT HOLDING, S.A. AND SUBSID
- Page 348:
AMADEUS IT HOLDING, S.A. AND SUBSID
- Page 352:
AMADEUS IT HOLDING, S.A. AND SUBSID
- Page 356:
AMADEUS IT HOLDING, S.A. AND SUBSID
- Page 360:
AMADEUS IT HOLDING, S.A. AND SUBSID
- Page 364:
Amadeus IT Holding, S.A. and Subsid
- Page 368:
AMADEUS IT HOLDING, S.A. AND SUBSID
- Page 372:
AMADEUS IT HOLDING, S.A. AND SUBSID
- Page 376:
AMADEUS IT HOLDING, S.A. AND SUBSID
- Page 380:
AMADEUS IT HOLDING, S.A. AND SUBSID
- Page 384:
AMADEUS IT HOLDING, S.A. AND SUBSID
- Page 388:
AMADEUS IT HOLDING, S.A. AND SUBSID
- Page 392:
AMADEUS IT HOLDING, S.A. AND SUBSID
- Page 396:
AMADEUS IT HOLDING, S.A. AND SUBSID
- Page 400:
AMADEUS IT HOLDING, S.A. AND SUBSID
- Page 404:
AMADEUS IT HOLDING, S.A. AND SUBSID
- Page 408:
AMADEUS IT HOLDING, S.A. AND SUBSID
- Page 412:
AMADEUS IT HOLDING, S.A. AND SUBSID
- Page 416:
AMADEUS IT HOLDING, S.A. AND SUBSID
- Page 420:
AMADEUS IT HOLDING, S.A. AND SUBSID
- Page 424:
AMADEUS IT HOLDING, S.A. AND SUBSID
- Page 428:
AMADEUS IT HOLDING, S.A. AND SUBSID
- Page 432:
AMADEUS IT HOLDING, S.A. AND SUBSID
- Page 436:
AMADEUS IT HOLDING, S.A. AND SUBSID
- Page 440:
AMADEUS IT HOLDING, S.A. AND SUBSID
- Page 444:
AMADEUS IT HOLDING, S.A. AND SUBSID
- Page 448:
AMADEUS IT HOLDING, S.A. AND SUBSID
- Page 452:
AMADEUS IT HOLDING, S.A. AND SUBSID
- Page 456:
AMADEUS IT HOLDING, S.A. AND SUBSID
- Page 460:
AMADEUS IT HOLDING, S.A. AND SUBSID
- Page 464:
CORPORATE GOVERNANCE ANNUAL REPORT
- Page 468:
Please specify the most significant
- Page 472:
A.8 Please complete the following t
- Page 476:
B.1.2 Please complete the following
- Page 480:
EXTERNAL INDEPENDENT BOARD MEMBERS
- Page 484:
Executive Officer (CEO) of the Amad
- Page 488:
(a) (b) (c) (d) those boards of whi
- Page 492:
Other Benefits Amount in thousands
- Page 496:
Meeting, the prorating of amounts i
- Page 500:
Issues considered in the remunerati
- Page 504:
B.1.18 Please specify whether the B
- Page 508:
NO B.1.25 Please specify whether th
- Page 512:
Please specify, if applicable, the
- Page 516:
Company Group Total Amount for non-
- Page 520:
B.1.43 Please specify whether the C
- Page 524:
Submission of proposals to the Boar
- Page 528:
The Audit Committee will prepare an
- Page 532:
B.2.5. Please indicate, where appli
- Page 536:
C.6. Please describe the mechanisms
- Page 540:
If so, please specify the circumsta
- Page 544:
The Company, at the time of calling
- Page 548:
SECOND.- Review and, if thought fit
- Page 552:
4. In the case of representation gr
- Page 556:
c) Transactions whose effect is equ
- Page 560:
(v) The creation or acquisition of
- Page 564:
explain, where applicable, why form
- Page 568:
Complies 23. That all Board members
- Page 572:
The circumstances described in subs
- Page 576:
38. That, in calculating any remune
- Page 580:
c) They must be chaired by independ
- Page 584:
and Internal Audit Departments). Th
- Page 588:
57. That, in addition to the functi
- Page 592:
Stephan Gemkow 83 Francesco Loredan
- Page 596:
AMADELUX Investments, S.A. Airline
- Page 600:
Board of Directors When these Annua
- Page 604:
FINANCIAL INFORMATION 2010 AND ANNU
- Page 612:
AMADEUS IT HOLDING, , S.A. BALANCE
- Page 616:
AMADEUS IT HOLDING, S.A. STATEMENT
- Page 620:
AMADEUS IT HOLDING, , S.A. STATEMEN
- Page 624:
AMADEUS ADEUS IT HOLDING, , S.A. NO
- Page 628:
AMADEUS ADEUS IT HOLDING, , S.A. NO
- Page 632:
AMADEUS ADEUS IT HOLDING, , S.A. NO
- Page 636:
AMADEUS ADEUS IT HOLDING, , S.A. NO
- Page 640:
AMADEUS ADEUS IT HOLDING, , S.A. NO
- Page 644:
AMADEUS ADEUS IT HOLDING, , S.A. NO
- Page 648:
AMADEUS ADEUS IT HOLDING, , S.A. NO
- Page 652:
AMADEUS ADEUS IT HOLDING, , S.A. NO
- Page 656:
AMADEUS ADEUS IT HOLDING, , S.A. NO
- Page 660:
AMADEUS ADEUS IT HOLDING, , S.A. NO
- Page 664:
AMADEUS ADEUS IT HOLDING, , S.A. NO
- Page 668:
AMADEUS ADEUS IT HOLDING, , S.A. NO
- Page 672:
AMADEUS ADEUS IT HOLDING, , S.A. NO
- Page 676:
AMADEUS ADEUS IT HOLDING, , S.A. NO
- Page 680:
AMADEUS ADEUS IT HOLDING, , S.A. NO
- Page 684:
AMADEUS ADEUS IT HOLDING, , S.A. NO
- Page 688:
AMADEUS ADEUS IT HOLDING, , S.A. NO
- Page 692:
AMADEUS ADEUS IT HOLDING, , S.A. NO
- Page 696:
AMADEUS ADEUS IT HOLDING, , S.A. NO
- Page 700:
AMADEUS IT HOLDING, S.A NOTES TO TH
- Page 704:
AMADEUS IT HOLDING, S.A NOTES TO TH
- Page 708:
AMADEUS IT HOLDING, S.A NOTES TO TH
- Page 712:
AMADEUS IT HOLDING, S.A NOTES TO TH
- Page 716:
AMADEUS IT HOLDING, S.A NOTES TO TH
- Page 720:
INDEX 1 Summary 1 1.1 Introduction
- Page 724:
1.1.1 Key operating highlights The
- Page 728:
• Travel Guard, a worldwide leade
- Page 732:
• In the e-Commece area, in 2010
- Page 736:
1.1.3 Presentation of Financial Inf
- Page 740:
2. CONSOLIDATED FINANCIAL AL STATEM
- Page 744:
IFRIC 18 clarifies the accounting t
- Page 748:
Cost of revenue increased by 4.8% f
- Page 752:
- Regionalisation efforts, with the
- Page 756:
2.1.7 Share in profit / (losses) fr
- Page 760:
2.2 Statement of financial position
- Page 764:
Table 4 Q4 Q4 % Full Year Full Year
- Page 768:
Reconciliation with financial state
- Page 772:
3. SEGMENT REPORTING 3.1 Distributi
- Page 776:
Table 6 Full Year % of Total Air Fu
- Page 780:
In addition, the following also had
- Page 784:
Our IT transactional revenue per PB
- Page 788:
4. OTHER FINANCIAL INFORMATION 4.1
- Page 792:
6. OTHER ADDITIONAL INFORMATION 6.1
- Page 796:
6.4 Treasury Shares These shares ar
- Page 800:
Sensitivity of fair value to parall
- Page 804:
6.6 Subsequent Events On the Februa
- Page 808:
7.1.3 Direct or indirect significan
- Page 812:
Directors shall cease to hold offic
- Page 816:
private contract or otherwise, this
- Page 820:
FORM ANNUAL CORPORATE GOVERNANCE RE
- Page 824:
% of share capital affected: 56.34
- Page 828:
accordance with the procedure provi
- Page 832:
Please specify any resignations fro
- Page 836:
Mergers in London. Name of member M
- Page 840:
B.1.7 Please identify any Board mem
- Page 844:
Statutory benefits 0 Stock options
- Page 848:
EBERHARD HAAG TOMAS LOPEZ FERNEBRAN
- Page 852:
The Company is authorized to contra
- Page 856:
B.1.17 Please identify any Board me
- Page 860:
when they are subject to any of the
- Page 864:
B.1.28 Please specify whether there
- Page 868:
is, in turn, general counsel. His a
- Page 872:
Explanation of procedure (a) (b) (c
- Page 876:
B.2 Board of Directors’ Committee
- Page 880:
e) to be familiar with the Company
- Page 884:
f) to analyze, formulate and period
- Page 888:
C. RELATED-PARTY TRANSACTIONS C.1.
- Page 892:
The general risk management control
- Page 896:
% quorum different from that establ
- Page 900:
Details of measures The Chairman sh
- Page 904:
SIXTEENTH.- Delegation to the Board
- Page 908:
E.11 Please state whether the Compa
- Page 912:
account of different clients may fr
- Page 916:
11. That in the event of any extern
- Page 920:
N/A 18. That the Secretary of the B
- Page 924:
28. That companies publish and upda
- Page 928:
35. That the remuneration policy ap
- Page 932:
vi) The remuneration received from
- Page 936:
50. That the Audit Committee shall
- Page 940:
Complies 54. That the majority of t
- Page 944:
With regard to the most significant
- Page 948:
Section B.1.29 At the Audit Committ
- Page 952:
Date and signature: This Annual Cor
- Page 956:
© 2011 Amadeus IT Group SA | 1DMA