Does Diversity Pay? - American Sociological Association
Does Diversity Pay? - American Sociological Association
Does Diversity Pay? - American Sociological Association

Create successful ePaper yourself
Turn your PDF publications into a flip-book with our unique Google optimized e-Paper software.
DOES DIVERSITY PAY?—–213<br />
Hypothesis 2a: As racial workforce diversity<br />
increases, a business organization’s number<br />
of customers will increase.<br />
Hypothesis 2b: As gender workforce diversity<br />
increases, a business organization’s number<br />
of customers will increase.<br />
Hypothesis 3a: As racial workforce diversity<br />
increases, a business organization’s market<br />
share will increase.<br />
Hypothesis 3b: As gender workforce diversity<br />
increases, a business organization’s market<br />
share will increase.<br />
Hypothesis 4a: As racial workforce diversity<br />
increases, a business organization’s profits<br />
relative to its competitors will increase.<br />
Hypothesis 4b: As gender workforce diversity<br />
increases, a business organization’s profits<br />
relative to its competitors will increase.<br />
It is possible that racial and gender diversity<br />
in the workforce are related to some outcomes<br />
but not others. My analyses thus incorporate an<br />
array of tangible outcomes and benefits surrounding<br />
sales revenue, customer base, market<br />
share, and relative profitability. Following the<br />
literature, I also examine relations between<br />
diversity and business outcomes net of other factors<br />
(e.g., legal form of organization, establishment<br />
size, company size, organization age,<br />
industrial sector, and region).<br />
DATA AND METHODS<br />
The data come from the 1996 to 1997 National<br />
Organizations Survey (NOS) (Kalleberg,<br />
Knoke, and Marsden 2001), which contains<br />
information from 1,002 U.S. work establishments,<br />
drawn from a stratified random sample<br />
of approximately 15 million work establishments<br />
in Dun and Bradstreet’s Information<br />
Services data file. I use data from the 506 forprofit<br />
business organizations that provided<br />
information about the racial composition of<br />
their full-time workforces, their sales revenue,<br />
their number of customers, their market share,<br />
and their profitability. The NOS concentrates on<br />
U.S. work establishments’ employment contracts,<br />
staffing methods, work organization, job<br />
training programs, and employee benefits and<br />
incentives. The data include additional information<br />
about each organization’s formal structure,<br />
social demography, environmental<br />
situation, and productivity and performance.<br />
The resulting sample is representative of U.S.<br />
profit-making work organizations. For each<br />
organization sampled, Dun and Bradstreet’s<br />
Market Identifiers Plus service provides several<br />
important pieces of information: company<br />
name, address, and telephone number; size (in<br />
terms of number of employees and sales volume);<br />
year started; and business trends for the<br />
past three years. In addition, historical information<br />
on the sampled organizations is available<br />
from the Dun’s Historical Files. The unit of<br />
analysis is the workplace.<br />
DIVERSITY<br />
There are two basic approaches to measuring<br />
diversity, either globally or as distinct indicators.<br />
Following Skaggs and DiTomaso (2004), I opt<br />
for separate but parallel indicators of racial and<br />
gender diversity. There are several reasons for<br />
this. Previous research shows that race and gender<br />
as bases for diversity are extremely important<br />
in understanding human transactions. For<br />
most people, these group identities are not easily<br />
changeable. In addition, the base of knowledge<br />
in the social sciences is more fully<br />
developed for these identities than for others that<br />
may be relevant. On a pragmatic level, indicators<br />
for these two dimensions are readily available<br />
in the data source, while others are not<br />
(e.g., sexual preference or age).<br />
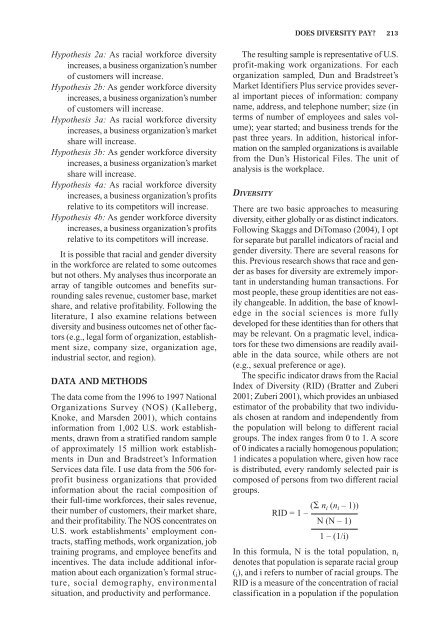
The specific indicator draws from the Racial<br />
Index of <strong>Diversity</strong> (RID) (Bratter and Zuberi<br />
2001; Zuberi 2001), which provides an unbiased<br />
estimator of the probability that two individuals<br />
chosen at random and independently from<br />
the population will belong to different racial<br />
groups. The index ranges from 0 to 1. A score<br />
of 0 indicates a racially homogenous population;<br />
1 indicates a population where, given how race<br />
is distributed, every randomly selected pair is<br />
composed of persons from two different racial<br />
groups.<br />
RID = 1 – ( n i (n i – 1))<br />
N (N – 1)<br />
1 – (1/i)<br />
In this formula, N is the total population, n i<br />
denotes that population is separate racial group<br />
( i ), and i refers to number of racial groups. The<br />
RID is a measure of the concentration of racial<br />
classification in a population if the population