Does Diversity Pay? - American Sociological Association
Does Diversity Pay? - American Sociological Association
Does Diversity Pay? - American Sociological Association

You also want an ePaper? Increase the reach of your titles
YUMPU automatically turns print PDFs into web optimized ePapers that Google loves.
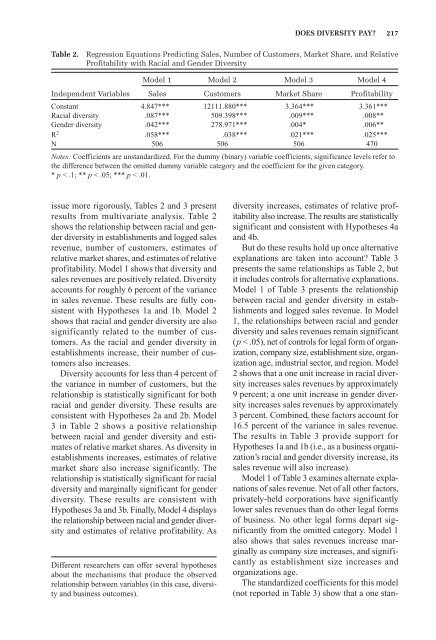
DOES DIVERSITY PAY?—–217<br />
Table 2.<br />
Regression Equations Predicting Sales, Number of Customers, Market Share, and Relative<br />
Profitability with Racial and Gender <strong>Diversity</strong><br />
Model 1 Model 2 Model 3 Model 4<br />
Independent Variables Sales Customers Market Share Profitability<br />
Constant 4.847*** 12111.880*** 3.364*** 3.361***<br />
Racial diversity .087*** 509.398*** .009*** .008**<br />
Gender diversity .042*** 278.971*** .004* .006**<br />
R 2 .058*** .038*** .021*** .025***<br />
N 506 506 506 470<br />
Notes: Coefficients are unstandardized. For the dummy (binary) variable coefficients, significance levels refer to<br />
the difference between the omitted dummy variable category and the coefficient for the given category.<br />
* p < .1; ** p < .05; *** p < .01.<br />
issue more rigorously, Tables 2 and 3 present<br />
results from multivariate analysis. Table 2<br />
shows the relationship between racial and gender<br />
diversity in establishments and logged sales<br />
revenue, number of customers, estimates of<br />
relative market shares, and estimates of relative<br />
profitability. Model 1 shows that diversity and<br />
sales revenues are positively related. <strong>Diversity</strong><br />
accounts for roughly 6 percent of the variance<br />
in sales revenue. These results are fully consistent<br />
with Hypotheses 1a and 1b. Model 2<br />
shows that racial and gender diversity are also<br />
significantly related to the number of customers.<br />
As the racial and gender diversity in<br />
establishments increase, their number of customers<br />
also increases.<br />
<strong>Diversity</strong> accounts for less than 4 percent of<br />
the variance in number of customers, but the<br />
relationship is statistically significant for both<br />
racial and gender diversity. These results are<br />
consistent with Hypotheses 2a and 2b. Model<br />
3 in Table 2 shows a positive relationship<br />
between racial and gender diversity and estimates<br />
of relative market shares. As diversity in<br />
establishments increases, estimates of relative<br />
market share also increase significantly. The<br />
relationship is statistically significant for racial<br />
diversity and marginally significant for gender<br />
diversity. These results are consistent with<br />
Hypotheses 3a and 3b. Finally, Model 4 displays<br />
the relationship between racial and gender diversity<br />
and estimates of relative profitability. As<br />
Different researchers can offer several hypotheses<br />
about the mechanisms that produce the observed<br />
relationship between variables (in this case, diversity<br />
and business outcomes).<br />
diversity increases, estimates of relative profitability<br />
also increase. The results are statistically<br />
significant and consistent with Hypotheses 4a<br />
and 4b.<br />
But do these results hold up once alternative<br />
explanations are taken into account? Table 3<br />
presents the same relationships as Table 2, but<br />
it includes controls for alternative explanations.<br />
Model 1 of Table 3 presents the relationship<br />
between racial and gender diversity in establishments<br />
and logged sales revenue. In Model<br />
1, the relationships between racial and gender<br />
diversity and sales revenues remain significant<br />
(p < .05), net of controls for legal form of organization,<br />
company size, establishment size, organization<br />
age, industrial sector, and region. Model<br />
2 shows that a one unit increase in racial diversity<br />
increases sales revenues by approximately<br />
9 percent; a one unit increase in gender diversity<br />
increases sales revenues by approximately<br />
3 percent. Combined, these factors account for<br />
16.5 percent of the variance in sales revenue.<br />
The results in Table 3 provide support for<br />
Hypotheses 1a and 1b (i.e., as a business organization’s<br />
racial and gender diversity increase, its<br />
sales revenue will also increase).<br />
Model 1 of Table 3 examines alternate explanations<br />
of sales revenue. Net of all other factors,<br />
privately-held corporations have significantly<br />
lower sales revenues than do other legal forms<br />
of business. No other legal forms depart significantly<br />
from the omitted category. Model 1<br />
also shows that sales revenues increase marginally<br />
as company size increases, and significantly<br />
as establishment size increases and<br />
organizations age.<br />
The standardized coefficients for this model<br />
(not reported in Table 3) show that a one stan-