Ageless at Work - Skills for Care
Ageless at Work - Skills for Care
Ageless at Work - Skills for Care

You also want an ePaper? Increase the reach of your titles
YUMPU automatically turns print PDFs into web optimized ePapers that Google loves.
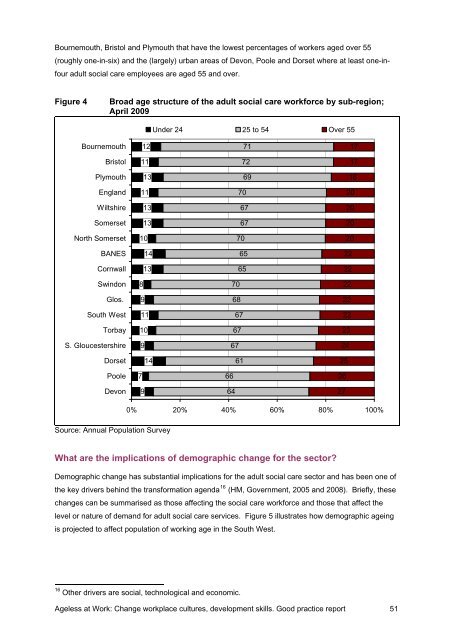
Bournemouth, Bristol and Plymouth th<strong>at</strong> have the lowest percentages of workers aged over 55<br />
(roughly one-in-six) and the (largely) urban areas of Devon, Poole and Dorset where <strong>at</strong> least one-infour<br />
adult social care employees are aged 55 and over.<br />
Figure 4<br />
Broad age structure of the adult social care work<strong>for</strong>ce by sub-region;<br />
April 2009<br />
Under 24 25 to 54 Over 55<br />
Bournemouth<br />
12<br />
71<br />
17<br />
Bristol<br />
11<br />
72<br />
17<br />
Plymouth<br />
13<br />
69<br />
18<br />
England<br />
11<br />
70<br />
20<br />
Wiltshire<br />
13<br />
67<br />
20<br />
Somerset<br />
13<br />
67<br />
20<br />
North Somerset<br />
10<br />
70<br />
20<br />
BANES<br />
14<br />
65<br />
22<br />
Cornwall<br />
13<br />
65<br />
22<br />
Swindon<br />
8<br />
70<br />
22<br />
Glos.<br />
9<br />
68<br />
22<br />
South West<br />
11<br />
67<br />
22<br />
Torbay<br />
10<br />
67<br />
23<br />
S. Gloucestershire<br />
9<br />
67<br />
24<br />
Dorset<br />
14<br />
61<br />
25<br />
Poole<br />
7<br />
66<br />
26<br />
Devon<br />
9<br />
64<br />
27<br />
Source: Annual Popul<strong>at</strong>ion Survey<br />
0% 20% 40% 60% 80% 100%<br />
Wh<strong>at</strong> are the implic<strong>at</strong>ions of demographic change <strong>for</strong> the sector?<br />
Demographic change has substantial implic<strong>at</strong>ions <strong>for</strong> the adult social care sector and has been one of<br />
the key drivers behind the trans<strong>for</strong>m<strong>at</strong>ion agenda 16 (HM, Government, 2005 and 2008). Briefly, these<br />
changes can be summarised as those affecting the social care work<strong>for</strong>ce and those th<strong>at</strong> affect the<br />
level or n<strong>at</strong>ure of demand <strong>for</strong> adult social care services. Figure 5 illustr<strong>at</strong>es how demographic ageing<br />
is projected to affect popul<strong>at</strong>ion of working age in the South West.<br />
16 Other drivers are social, technological and economic.<br />
<strong>Ageless</strong> <strong>at</strong> <strong>Work</strong>: Change workplace cultures, development skills. Good practice report 51