the handbook of food engineering practice crc press chapter 10 ...
the handbook of food engineering practice crc press chapter 10 ...
the handbook of food engineering practice crc press chapter 10 ...

Create successful ePaper yourself
Turn your PDF publications into a flip-book with our unique Google optimized e-Paper software.
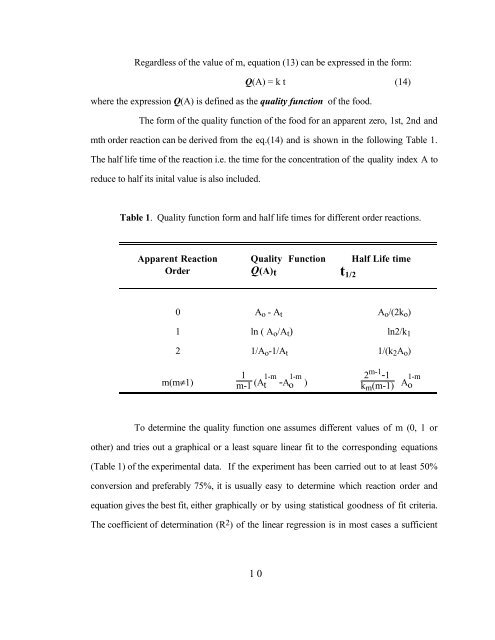
Regardless <strong>of</strong> <strong>the</strong> value <strong>of</strong> m, equation (13) can be ex<strong>press</strong>ed in <strong>the</strong> form:<br />
Q(A) = k t (14)<br />
where <strong>the</strong> ex<strong>press</strong>ion Q(A) is defined as <strong>the</strong> quality function <strong>of</strong> <strong>the</strong> <strong>food</strong>.<br />
The form <strong>of</strong> <strong>the</strong> quality function <strong>of</strong> <strong>the</strong> <strong>food</strong> for an apparent zero, 1st, 2nd and<br />
mth order reaction can be derived from <strong>the</strong> eq.(14) and is shown in <strong>the</strong> following Table 1.<br />
The half life time <strong>of</strong> <strong>the</strong> reaction i.e. <strong>the</strong> time for <strong>the</strong> concentration <strong>of</strong> <strong>the</strong> quality index A to<br />
reduce to half its inital value is also included.<br />
Table 1. Quality function form and half life times for different order reactions.<br />
Apparent Reaction Quality Function Half Life time<br />
Order Q(A)t t 1/2<br />
0 A o - A t A o /(2k o )<br />
1 ln ( A o /A t ) ln2/k 1<br />
2 1/A o -1/A t 1/(k 2 A o )<br />
m(m≠1)<br />
1<br />
m-1 (A1-m t -Ao 1-m ) 2 m-1 -1<br />
k m (m-1) A1-m o<br />
To determine <strong>the</strong> quality function one assumes different values <strong>of</strong> m (0, 1 or<br />
o<strong>the</strong>r) and tries out a graphical or a least square linear fit to <strong>the</strong> corresponding equations<br />
(Table 1) <strong>of</strong> <strong>the</strong> experimental data. If <strong>the</strong> experiment has been carried out to at least 50%<br />
conversion and preferably 75%, it is usually easy to determine which reaction order and<br />
equation gives <strong>the</strong> best fit, ei<strong>the</strong>r graphically or by using statistical goodness <strong>of</strong> fit criteria.<br />
The coefficient <strong>of</strong> determination (R 2 ) <strong>of</strong> <strong>the</strong> linear regression is in most cases a sufficient<br />
<strong>10</strong>