the handbook of food engineering practice crc press chapter 10 ...
the handbook of food engineering practice crc press chapter 10 ...
the handbook of food engineering practice crc press chapter 10 ...

You also want an ePaper? Increase the reach of your titles
YUMPU automatically turns print PDFs into web optimized ePapers that Google loves.
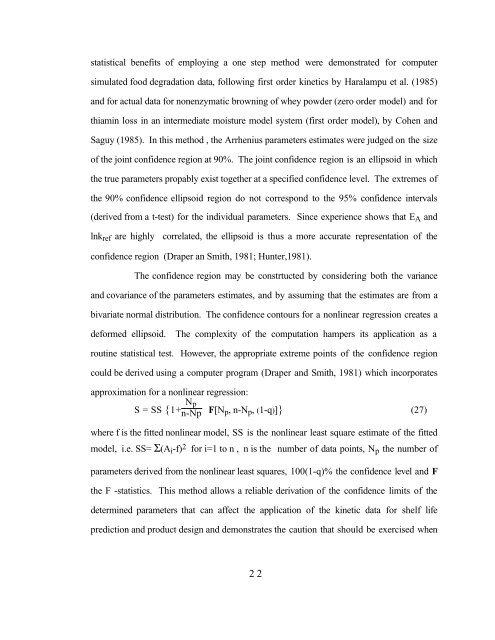
statistical benefits <strong>of</strong> employing a one step method were demonstrated for computer<br />
simulated <strong>food</strong> degradation data, following first order kinetics by Haralampu et al. (1985)<br />
and for actual data for nonenzymatic browning <strong>of</strong> whey powder (zero order model) and for<br />
thiamin loss in an intermediate moisture model system (first order model), by Cohen and<br />
Saguy (1985). In this method , <strong>the</strong> Arrhenius parameters estimates were judged on <strong>the</strong> size<br />
<strong>of</strong> <strong>the</strong> joint confidence region at 90%. The joint confidence region is an ellipsoid in which<br />
<strong>the</strong> true parameters propably exist toge<strong>the</strong>r at a specified confidence level. The extremes <strong>of</strong><br />
<strong>the</strong> 90% confidence ellipsoid region do not correspond to <strong>the</strong> 95% confidence intervals<br />
(derived from a t-test) for <strong>the</strong> individual parameters. Since experience shows that E A and<br />
lnk ref are highly correlated, <strong>the</strong> ellipsoid is thus a more accurate representation <strong>of</strong> <strong>the</strong><br />
confidence region (Draper an Smith, 1981; Hunter,1981).<br />
The confidence region may be constrtucted by considering both <strong>the</strong> variance<br />
and covariance <strong>of</strong> <strong>the</strong> parameters estimates, and by assuming that <strong>the</strong> estimates are from a<br />
bivariate normal distribution. The confidence contours for a nonlinear regression creates a<br />
deformed ellipsoid. The complexity <strong>of</strong> <strong>the</strong> computation hampers its application as a<br />
routine statistical test. However, <strong>the</strong> appropriate extreme points <strong>of</strong> <strong>the</strong> confidence region<br />
could be derived using a computer program (Draper and Smith, 1981) which incorporates<br />
approximation for a nonlinear regression:<br />
S = SS {1+ N p<br />
n-Np F[N p, n-N p , (1-q)]} (27)<br />
where f is <strong>the</strong> fitted nonlinear model, SS is <strong>the</strong> nonlinear least square estimate <strong>of</strong> <strong>the</strong> fitted<br />
model, i.e. SS= Σ(A i -f) 2 for i=1 to n , n is <strong>the</strong> number <strong>of</strong> data points, N p <strong>the</strong> number <strong>of</strong><br />
parameters derived from <strong>the</strong> nonlinear least squares, <strong>10</strong>0(1-q)% <strong>the</strong> confidence level and F<br />
<strong>the</strong> F -statistics. This method allows a reliable derivation <strong>of</strong> <strong>the</strong> confidence limits <strong>of</strong> <strong>the</strong><br />
determined parameters that can affect <strong>the</strong> application <strong>of</strong> <strong>the</strong> kinetic data for shelf life<br />
prediction and product design and demonstrates <strong>the</strong> caution that should be exercised when<br />
22