Advance Terminal Planning Study Program Criteria Document
Advance Terminal Planning Study Program Criteria Document
Advance Terminal Planning Study Program Criteria Document

Create successful ePaper yourself
Turn your PDF publications into a flip-book with our unique Google optimized e-Paper software.
DRAFT
KANSAS CITY NEW TERMINAL STUDY<br />
ADVANCE TERMINAL PLANNING STUDY<br />
PROGRAM CRITERIA DOCUMENT<br />
DRAFT<br />
TABLE OF CONTENTS<br />
Page<br />
INTRODUCTION ................................................................................. 1<br />
BACKGROUND .................................................................................... 1<br />
PURPOSE ........................................................................................... 2<br />
1 ADVANCED PLANNING PARAMETERS......................................... 2<br />
1.1 Goals and Objectives .................................................................... 2<br />
1.2 Passenger Surveys ....................................................................... 4<br />
1.3 Aviation Demand Forecast ............................................................ 5<br />
1.4 Benchmarking ........................................................................... 13<br />
2 AIRFIELD REQUIREMENTS ...................................................... 15<br />
2.1 Design Aircraft .......................................................................... 15<br />
2.2 Aircraft Gates and Loading Bridge Requirements ............................ 17<br />
2.3 Apron Service Road .................................................................... 22<br />
2.4 Airside Security Requirements ..................................................... 22<br />
2.5 Aircraft Deicing .......................................................................... 23<br />
2.6 Fueling Requirements ................................................................. 30<br />
3 TERMINAL REQUIREMENTS ..................................................... 36<br />
3.1 Methodologies ........................................................................... 36<br />
3.2 <strong>Terminal</strong> Facility Requirements .................................................... 39<br />
3.3 Concessions Requirements .......................................................... 68<br />
3.4 Specialty Systems and New Technology ........................................ 83<br />
3.5 Utilities, Infrastructure and MEP Requirements ............................. 115<br />
DRAFT<br />
4 LANDSIDE REQUIREMENTS ................................................... 124<br />
4.1 Regional Access ........................................................................ 125<br />
4.2 <strong>Terminal</strong> Area Landside Requirements ......................................... 142<br />
4.3 Vehicular Parking ...................................................................... 146<br />
5 TERMINAL SUPPORT REQUIREMENTS ................................... 149<br />
5.1 Fleet Maintenance ..................................................................... 150<br />
5.2 Fuel/Wash Facility ..................................................................... 151<br />
5.3 Aviation Facilities Maintenance ................................................... 152<br />
5.4 Airport Police Department .......................................................... 152<br />
5.5 Flight Kitchens .......................................................................... 153<br />
5.6 Airport Hotel ............................................................................ 154<br />
5.7 Ground Service Equipment (GSE) Facilities .................................. 154<br />
5.8 Airside Snow Storage and Melting Areas ...................................... 155<br />
5.9 Ramp Control Tower .................................................................. 157<br />
5.10 Remain Overnight (RON) Parking ................................................ 160<br />
Landrum & Brown<br />
April 2013<br />
Page i
KANSAS CITY NEW TERMINAL STUDY<br />
ADVANCE TERMINAL PLANNING STUDY<br />
PROGRAM CRITERIA DOCUMENT<br />
DRAFT<br />
TABLE OF CONTENTS (Continued)<br />
Page<br />
6 REFINE CONCEPTUAL TERMINAL COMPLEX SITE PLAN .......... 161<br />
6.1 Airside Site Plan ....................................................................... 161<br />
6.2 Ground Access Site Plan for the New <strong>Terminal</strong> .............................. 178<br />
6.3 <strong>Terminal</strong> Support and Collateral Development Site Plan ................. 198<br />
6.4 FAA Navigational Aids ................................................................ 214<br />
7 REFINE CONCEPTUAL TERMINAL BUILDING PLANS ............... 216<br />
7.1 Conceptual <strong>Terminal</strong> and Concourse Plans.................................... 216<br />
7.2 Refined Alternative 1B Building Plans .......................................... 235<br />
7.3 Conceptual <strong>Terminal</strong> Building Cross Sections ................................ 245<br />
7.4 Conceptual Building Mass Elevations ........................................... 252<br />
7.5 Conceptual Illustrations ............................................................. 253<br />
7.6 New <strong>Terminal</strong> Mechanical & Electrical Improvements/<br />
Alternatives.............................................................................. 260<br />
7.7 Baggage Handling System (BHS) ................................................ 288<br />
8 ENVIRONMENTAL CONSIDERATIONS .................................... 293<br />
8.1 Alternative Evaluation – Environmental Resources ........................ 293<br />
8.2 Implementation <strong>Planning</strong> – Environmental Considerations .............. 293<br />
8.3 Sustainability <strong>Planning</strong> .............................................................. 295<br />
9 PROGRAM IMPLEMENTATION ................................................ 306<br />
9.1 Introduction ............................................................................. 306<br />
9.2 <strong>Terminal</strong> Development Phasing Summary .................................... 306<br />
9.3 Capital Costs of the New <strong>Terminal</strong> <strong>Program</strong> .................................. 308<br />
9.4 Enabling Projects ...................................................................... 308<br />
9.5 LEED Gold Certification .............................................................. 310<br />
9.6 Implementation Timeline ........................................................... 312<br />
9.7 <strong>Program</strong> Delivery Methods ......................................................... 313<br />
DRAFT<br />
10 FINANCIAL IMPLEMENTATION PLAN ..................................... 316<br />
10.1 Cost and Affordability of New Replacement <strong>Terminal</strong> ..................... 316<br />
10.2 Determinations of Affordability ................................................... 320<br />
Landrum & Brown<br />
April 2013<br />
Page ii
KANSAS CITY INTERNATIONAL AIRPORT<br />
ADVANCE TERMINAL PLANNING STUDY<br />
PROGRAM CRITERIA DOCUMENT<br />
DRAFT<br />
PROGRAM CRITERIA DOCUMENT (PCD)<br />
INTRODUCTION<br />
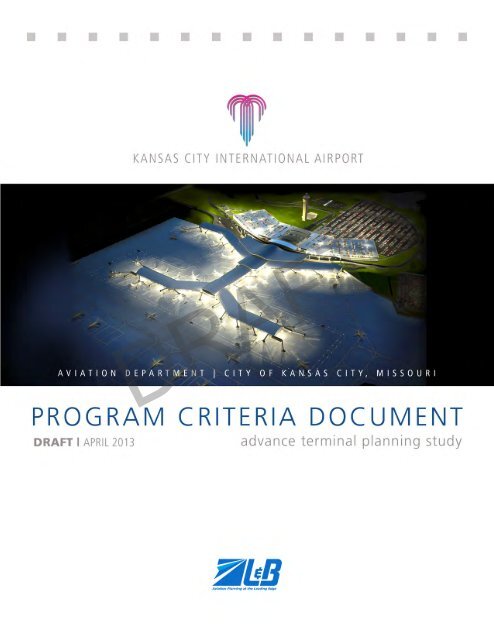
This <strong>Program</strong> <strong>Criteria</strong> <strong>Document</strong> (PCD) provides the overall guidance for the design<br />
of the New <strong>Terminal</strong> Complex (New <strong>Terminal</strong>) facilities at the Kansas City<br />
International Airport (KCI or Airport). The New <strong>Terminal</strong> is envisioned as a<br />
consolidated single facility that will replace the existing three unit terminal used<br />
today. The PCD contains all of the pertinent information identified and researched<br />
for the development of the project including any infrastructure enabling projects<br />
needed to allow implementation of the New <strong>Terminal</strong> and the necessary regulatory<br />
information. The conceptual plans for the refined airside, terminal, and landside<br />
requirements are the basis for the PCD, which is designed to serve as the guidelines<br />
for the design and implementation of the New <strong>Terminal</strong> facilities.<br />
BACKGROUND<br />
The Airport was built by the City of Kansas City, Missouri (KCMO or City) and has<br />
served the needs of air travelers in the Midwest since the opening in 1972.<br />
The KCI complex spans more than 10,000 acres, making it one of the largest<br />
airports in the U.S.<br />
The Airport is situated 15 miles northwest of the City’s central business district and<br />
currently, the closest scheduled commercial passenger service airport is Omaha<br />
Eppley Airfield (OMA), located 152 miles away. The Metropolitan Statistical Area<br />
(MSA) for the City, as defined by the U.S. Census Bureau for Kansas City,<br />
encompasses 15 counties including Bates, Caldwell, Cass, Clay, Clinton, Jackson,<br />
Lafayette, Platte, and Ray counties in Missouri; and Franklin, Johnson,<br />
Leavenworth, Linn, Miami, and Wyandotte counties in Kansas. The Kansas City<br />
Aviation Department (KCAD) defines KCI’s Air Service Area (ASA) as all counties in<br />
the MSA, and additionally Buchanan County in Missouri and Douglas County in<br />
Kansas.<br />
DRAFT<br />
KCAD completed an Airport Master Plan (MP) in 2008 that provided a vision for the<br />
growth and development of KCI over the following 20 years, and established a<br />
framework for the development of facilities and a guide for long-term on-airport<br />
land use and development decisions. The MP identified the need for an updated<br />
passenger terminal complex to serve a projected increase in passenger demand<br />
and provide a passenger processing facility that would meet and exceed customer<br />
service expectations.<br />
Several terminal options were selected for development sites and design<br />
alternatives were developed and presented to KCAD for review. The MP identified a<br />
South <strong>Terminal</strong> project that included a new 59-gate terminal south of Runway 9/27<br />
and a new terminal curb front and loop roadway system, a new south access<br />
roadway from Missouri Route 152 (M-152), and an upgrade of I-435 and I-29<br />
ramps connecting to M-152.<br />
Landrum & Brown Page 1<br />
April 2013
KANSAS CITY INTERNATIONAL AIRPORT<br />
ADVANCE TERMINAL PLANNING STUDY<br />
PROGRAM CRITERIA DOCUMENT<br />
DRAFT<br />
As a result of the MP, the New <strong>Terminal</strong> <strong>Advance</strong> <strong>Planning</strong> <strong>Study</strong> (the <strong>Study</strong>) was<br />
initiated November 28, 2011 to research, explore, and consider the new South<br />
<strong>Terminal</strong> option developed in the MP. However, in June 2012 KCI officials, due to<br />
the high cost of the South <strong>Terminal</strong> project, announced that the existing <strong>Terminal</strong> A<br />
site was being considered for the proposed main terminal location. This site would<br />
take advantage of infrastructure that currently exists and as a result would cost<br />
significantly less and be implemented more quickly.<br />
PURPOSE<br />
The desired result of the <strong>Study</strong> is to identify, programmatically define, and<br />
conceptually depict a planning and design direction for the Preferred Alternative’s<br />
future phase developments. Therefore, this PCD provides all of the key background<br />
research and analysis, facility requirements, and detailed planning and design<br />
guidelines to facilitate the design and construction needs of the new passenger<br />
terminal complex.<br />
1. ADVANCED PLANNING PARAMETERS<br />
Identifying advanced planning parameters will lay the foundation for the project.<br />
To address the unique operating needs of KCI, the specific goals, objectives, and<br />
passenger demand characteristics that guided the development of alternatives and<br />
the choice of the Preferred Alternative are identified in this section.<br />
1.1 Goals and Objectives<br />
The project information contained in the MP was supplemented by new and more<br />
detailed information for this <strong>Study</strong>. Meetings and discussions with key City<br />
Stakeholders, the FAA, three of the primary airlines serving KCI, and key<br />
concessionaires were conducted. The goals and objectives formulated from these<br />
meetings and discussions combined with comments provided by KCAD, are the<br />
basis for determining the various goals and objectives of the <strong>Study</strong>.<br />
The overall Project Goal is to develop a plan for the design and construction of a<br />
new terminal at KCI, which will enhance the City’s ability to provide a high level of<br />
air service, as well as a source of community pride for the City and the Metro<br />
Region. This will be accomplished by providing a first class arrivals destination and<br />
new, efficient, and technologically advanced airside, terminal, and landside facilities<br />
that promote the highest level of passenger processing conveniences and customer<br />
service. The primary goals and their associated objectives of the <strong>Study</strong> are:<br />
<strong>Terminal</strong> Goals:<br />
<br />
<br />
<br />
DRAFT<br />
Most importantly, replace the three existing passenger terminals with one<br />
integrated state-of-the-art facility<br />
Achieve a balanced capacity of gates, terminal processing, and landside<br />
facilities<br />
Incorporate the latest in passenger processing technology<br />
Landrum & Brown Page 2<br />
April 2013
KANSAS CITY INTERNATIONAL AIRPORT<br />
ADVANCE TERMINAL PLANNING STUDY<br />
PROGRAM CRITERIA DOCUMENT<br />
DRAFT<br />
<br />
<br />
<br />
<br />
<br />
<br />
<br />
<br />
<br />
Plan facilities that meet a minimum Level of Service (LOS) C during peak<br />
hours<br />
Plan for flexibility to expand as demand changes<br />
Develop facilities that can adapt to a rigorous and changing security<br />
environment<br />
Design passenger-friendly flows and way-finding<br />
Minimize walking distances<br />
Develop operationally efficient gates for the airlines<br />
Provide efficient baggage handling and delivery<br />
Improve international facilities and their connection to domestic service<br />
Minimize the complexity of construction phasing<br />
Airside Goals:<br />
<br />
<br />
<br />
<br />
Maximize the uses of the new terminal site and airfield efficiencies<br />
Plan facilities that meet or exceed FAA design standards<br />
Accommodate aircraft that utilize the Airport, both now and in the future<br />
Provide efficient operational requirements such as vehicle service roads and<br />
uncongested ramp areas<br />
Regional and Landside Access Goals:<br />
<br />
<br />
<br />
<br />
<br />
<br />
Financial:<br />
<br />
<br />
<br />
<br />
<br />
Integrate the New <strong>Terminal</strong> into the existing roadway and regional<br />
transportation system with minimal interruption to on-going operations<br />
DRAFT<br />
Maximize on-airport parking<br />
Provide for convenient passenger access and transfers<br />
Minimize walking distances to the New <strong>Terminal</strong><br />
Provide a high LOS for rental car patrons<br />
Provide a high LOS at Arrivals and Departures curbsides<br />
Periodically evaluate a Rough Order of Magnitude to ensure the New <strong>Terminal</strong><br />
is a financially feasible plan<br />
Develop a cost-effective and realistically affordable plan<br />
Utilize common-use systems to minimize capital and operating costs<br />
Maximize non-aviation revenue opportunities including concessions and<br />
parking<br />
Maximize eligibility for FAA funding of proposed improvements<br />
Landrum & Brown Page 3<br />
April 2013
KANSAS CITY INTERNATIONAL AIRPORT<br />
ADVANCE TERMINAL PLANNING STUDY<br />
PROGRAM CRITERIA DOCUMENT<br />
DRAFT<br />
1.2 Passenger Surveys<br />
Passenger surveys were conducted at the Airport between March 4 th and<br />
March 10 th , 2012 to gain an understanding of the passengers using KCI and develop<br />
a current passenger profile. The surveys confirmed KCI’s ASA and provided<br />
additional data such as check-in, baggage check, parking, and concessions<br />
planning, to name a few. All of the information collected from the surveys is<br />
beneficial and will be used in the future for demand forecasting, airport planning,<br />
and policy and investment decisions.<br />
The passenger surveys were conducted in the holdrooms at the gates prior to flight<br />
departure. Passengers were selected from a balanced mix of flights in all of the<br />
current terminals, and flights were selected by airlines, day of week, time of day,<br />
and destination market, providing a statistically valid method of identifying a<br />
representative passenger profile for departing passengers at KCI.<br />
Thirty questions including passenger characteristics, local trip origin, ground<br />
transportation mode and parking, concessions, resident or visitor status, purpose<br />
and propensity for travel, airline elite status, check-in location, number of bags<br />
carried on or checked, bag check location, travel group size, and final destination<br />
were included in the survey. Twenty-one hundred surveys were collected and<br />
analyzed.<br />
The survey results confirmed many facts and statistics that helped to describe<br />
current passengers at KCI. These results, summarized below, provide important<br />
information for the planning of the future New <strong>Terminal</strong>.<br />
<br />
<br />
<br />
<br />
<br />
<br />
<br />
<br />
<br />
<br />
DRAFT<br />
80 percent travel from a local origin within the ASA<br />
62 percent are considered residents and 38 percent are visitors<br />
56 percent are male and 44 percent female<br />
The largest percentage were between 45 and 54 and the largest percentage<br />
of household income was between $50,000 and $99,999<br />
93 percent had a final destination in the U.S and seven percent had an<br />
international final destination<br />
56 percent were traveling for business and 42 percent were on leisure travel<br />
with more than half of leisure travelers visiting friends and family<br />
85 percent came in a private car or rental car and 63 percent of those in a<br />
private car (excluding rental cars) used one of the on- or off-airport parking<br />
lots with 42 percent using the KCI economy lot<br />
Almost two-thirds were on non-stop flights<br />
The majority of destinations on connecting flights were to Chicago, Denver,<br />
and Dallas<br />
42 percent used on-line check-in, 29 percent checked in with ticket agents,<br />
and 28 percent used E ticket kiosks<br />
Landrum & Brown Page 4<br />
April 2013
KANSAS CITY INTERNATIONAL AIRPORT<br />
ADVANCE TERMINAL PLANNING STUDY<br />
PROGRAM CRITERIA DOCUMENT<br />
DRAFT<br />
<br />
<br />
46 percent checked bags at the ticket counter, while 44 percent did not<br />
check any bags<br />
The average number of bags checked by each passenger was 0.6 bags<br />
Most passengers used highways I 29 and I-435<br />
<br />
<br />
Approximately 31 percent made a purchase at one of the food concessions<br />
and 11 percent made purchases from a retail store<br />
Average passenger dwell time in the terminals was approximately 1 hour<br />
40 minutes, although residents and business travelers allowed for less time<br />
due to familiarity and frequency of use<br />
Information from these surveys will be discussed throughout this document.<br />
1.3 Aviation Demand Forecast<br />
Comprehensive aviation demand forecasts were developed for KCI for the years<br />
2015, 2020, 2025, and 2030. Annual passenger enplanements, annual aircraft<br />
operations, and aircraft fleet mix have been projected, as well as aircraft and peak<br />
period activity projections. The aviation activity projections are a critical<br />
component in the facility planning process and serve as a basis for:<br />
• Determining the role of the Airport with respect to the type of aircraft to be<br />
accommodated in the future,<br />
• Evaluating the capacity of existing Airport facilities and its ability to<br />
accommodate projected aviation demand, and<br />
DRAFT<br />
• Estimating the development requirements of the future terminal, airside, and<br />
landside facilities.<br />
1.3.1 ENPLANED PASSENGERS<br />
Table 1.3-1, Summary of Enplaned Passenger Forecast, shows a summary<br />
projection of enplaned passengers through 2030. Total enplaned passengers are<br />
forecast to grow from 5.1 million enplanements in 2011 to 7.2 million by 2030,<br />
representing an average annual growth rate of 1.9 percent. Almost all of the traffic<br />
at KCI is expected to be originating (i.e. passenger trips beginning or ending at the<br />
Airport) with only limited connecting activity. The enplanement forecast is<br />
presented in Figure 1.3-1, Summary of Enplaned Passenger Forecast.<br />
Landrum & Brown Page 5<br />
April 2013
KANSAS CITY INTERNATIONAL AIRPORT<br />
ADVANCE TERMINAL PLANNING STUDY<br />
PROGRAM CRITERIA DOCUMENT<br />
DRAFT<br />
Table 1.3-1<br />
SUMMARY OF ENPLANED PASSENGER FORECAST<br />
Source:<br />
Landrum & Brown<br />
Figure 1.3-1<br />
SUMMARY OF ENPLANED PASSENGER FORECAST<br />
DRAFT<br />
Source:<br />
Landrum & Brown<br />
1.3.2 PASSENGER OPERATIONS<br />
Passenger aircraft operations were derived from the enplaned passenger forecast.<br />
The aggregate number of commercial passenger operations at an airport depends<br />
on three factors: total passengers, average aircraft size, and average load factor<br />
(percent of seats occupied).<br />
In order to develop reasonable load factor and aircraft gauge assumptions, the<br />
same categories of activity were used as in the enplaned passenger forecast<br />
(see Table 1.3-1 above). To derive the passenger operations forecast, assumptions<br />
Landrum & Brown Page 6<br />
April 2013
KANSAS CITY INTERNATIONAL AIRPORT<br />
ADVANCE TERMINAL PLANNING STUDY<br />
PROGRAM CRITERIA DOCUMENT<br />
DRAFT<br />
are inherently different at airports due to differences in how airlines choose to<br />
strategically serve the demand for air travel at each airport. At KCI, aircraft size,<br />
passenger load factors, and Average Seats per Departure (ASPD) were used.<br />
Airlines continually work to align capacity with demand. At KCI, average aircraft<br />
size reflects a mix of narrowbody and regional jet aircraft. Since 2007, average<br />
aircraft size has increased as Low Cost Carriers (LCCs) have continued to capture a<br />
larger share of the KCI market and network airlines have deployed a higher<br />
percentage of large regional jets. Enplaned passenger load factors have increased<br />
24 percent from 60 percent in 2000 to almost 75 percent in 2011 as airlines make<br />
better use of their aircraft assets.<br />
ASPD for each of the major groups of passenger activity was calculated from total<br />
departures and total departing seats. Aircraft load factors were calculated for each<br />
group of passenger operations by dividing total enplaned passengers by total<br />
departing seats. To calculate total operations, the total number of departures was<br />
multiplied by a factor of two. Figure 1.3-2, Historical Passenger Operations<br />
with ASPD, displays historical passenger operations and average seats per flight.<br />
Figure 1.3-2<br />
HISTORICAL PASSENGER OPERATIONS WITH ASPD<br />
DRAFT<br />
Source:<br />
Landrum & Brown<br />
Landrum & Brown Page 7<br />
April 2013
KANSAS CITY INTERNATIONAL AIRPORT<br />
ADVANCE TERMINAL PLANNING STUDY<br />
PROGRAM CRITERIA DOCUMENT<br />
DRAFT<br />
1.3.3 FLEET MIX<br />
As passenger traffic volumes increase at KCI, airlines will shift to larger, more<br />
efficient aircraft, where possible, to reduce unit costs and increase revenues.<br />
Significant fleet renewal is expected to occur over the forecast period. The average<br />
number of seats per flight is projected to increase from 104 seats in 2011 to<br />
114 seats by 2030. Enplaned load factors are projected to increase from<br />
75 percent in 2011 to 80 percent in 2012 and remain relatively constant thereafter.<br />
Narrowbody aircraft are expected to account for an increasing share of passenger<br />
flights as LCCs continue to increase market share at KCI. Legacy carriers will<br />
increasingly use large regional jets as a replacement for small regional jets. Fleet<br />
mix and load factor assumptions result in a 1.0 percent average annual growth rate<br />
for passenger flights at KCI over the forecast period. The change in projected fleet<br />
mix is represented in Figure 1.3-3, Aircraft Fleet Mix.<br />
Figure 1.3-3<br />
AIRCRAFT FLEET MIX<br />
DRAFT<br />
Source:<br />
Landrum & Brown<br />
1.3.4 AIR CARGO<br />
The cargo tonnage forecast is predicated on the assumption that changes to the air<br />
cargo industry and emerging trends for air cargo security will continue.<br />
Additionally, it is assumed that long-term economic growth in the Kansas City MSA<br />
and the broader U.S. economy will increase the demand for the shipment of goods<br />
and services over the forecast period. The air cargo tonnage forecast also reflects<br />
the current global economic outlook from the Boeing, Airbus, and FAA Aerospace<br />
forecasts.<br />
Landrum & Brown Page 8<br />
April 2013
KANSAS CITY INTERNATIONAL AIRPORT<br />
ADVANCE TERMINAL PLANNING STUDY<br />
PROGRAM CRITERIA DOCUMENT<br />
DRAFT<br />
Average annual growth of 2.2 percent per year was applied from 2011 to 2030,<br />
resulting in total KCI cargo volumes increasing to 130,817 metric tons in 2030.<br />
Figure 1.3-4, Cargo Tonnage Forecast Results, shows cargo forecast results.<br />
Figure 1.3-4<br />
CARGO TONNAGE FORECAST RESULTS<br />
Source:<br />
Landrum & Brown<br />
DRAFT<br />
In 2011, 86,001 cargo metric tons were handled at KCI. Integrated cargo carriers,<br />
FedEx and UPS, account for 89 percent of total air cargo handled at KCI. A shift to<br />
widebody aircraft such as the A300 and MD11 has occurred at KCI over the past<br />
five years as integrated carriers have shifted away from narrowbody B727 and DC9<br />
aircraft. Figure 1.3-5, 2011 Air Cargo Tonnage by Carrier, depicts the tonnage<br />
splits by carrier.<br />
Figure 1.3-5<br />
2011 AIR CARGO TONNAGE BY CARRIER<br />
Source:<br />
Landrum & Brown<br />
Landrum & Brown Page 9<br />
April 2013
KANSAS CITY INTERNATIONAL AIRPORT<br />
ADVANCE TERMINAL PLANNING STUDY<br />
PROGRAM CRITERIA DOCUMENT<br />
DRAFT<br />
1.3.5 AIRCRAFT OPERATIONS<br />
Aircraft operations are forecast to increase from 141,700 operations in 2011 to<br />
172,611 operations in 2030, which is an average growth of 1.0 percent per year as<br />
seen in Figure 1.3-6, Summary of Aircraft Operations Forecast. Commercial<br />
passenger operations are expected to grow 1.0 percent per year which will drive<br />
growth in aircraft operations at KCI. However, passenger enplanements are<br />
expected to grow 1.9 percent per year, reflecting an expected increase in average<br />
aircraft size and higher average load factors. The other four primary components<br />
of operations - all-cargo, non-commercial air taxi, general aviation, and military -<br />
are expected to experience positive activity growth at KCI over the forecast period.<br />
Figure 1.3-6<br />
SUMMARY OF AIRCRAFT OPERATIONS FORECAST<br />
Source: Landrum & Brown<br />
DRAFT<br />
Landrum & Brown Page 10<br />
April 2013
KANSAS CITY INTERNATIONAL AIRPORT<br />
ADVANCE TERMINAL PLANNING STUDY<br />
PROGRAM CRITERIA DOCUMENT<br />
DRAFT<br />
1.3.6 PEAK ACTIVITY FOR ENPLANEMENTS<br />
Airport traffic demand patterns are subject to seasonal, monthly, daily, and hourly<br />
variations. These variations result in peak periods when the greatest amount of<br />
demand is placed upon facilities required to accommodate passenger and aircraft<br />
movements. Peaking characteristics are critical in the assessment of existing<br />
facilities to determine the ability to accommodate forecast increases in passenger<br />
and operational activity throughout the study period. The objective of developing<br />
peak period forecasts is to provide facility designs that are not under-utilized nor<br />
over-crowded too often.<br />
Table 1.3-2, KCI Peak Period Enplanement Forecast, shows the peak month,<br />
design day, and peak hour ratios used to develop the peak period enplanement<br />
forecasts for KCI. July is the peak month for passenger enplanements at KCI,<br />
accounting for 9.8 percent of annual traffic. The flight schedule for Thursday,<br />
July 14, 2011 was identified as being representative of a typical day of the peak<br />
month activity and analyzed to determine the hourly peaking patterns at KCI.<br />
Departing seats were used as a proxy for enplanements. The flight schedule data<br />
suggested that the peak hour accounts for 11.3 percent of daily passenger<br />
enplanements. It was assumed that the monthly, daily, and peak hour factors<br />
would remain constant over the forecast period. As a result, peak hour<br />
enplanements are forecast to increase from 1,900 enplanements in 2011 to<br />
2,700 enplanements in 2030.<br />
Table 1.3-2<br />
KCI PEAK PERIOD ENPLANEMENT FORECAST<br />
DRAFT<br />
Source:<br />
Landrum & Brown<br />
1.3.7 PEAK ACTIVITY FOR OPERATIONS<br />
Like passenger traffic, the operations peak has historically occurred in July. Design<br />
day factors were developed to provide activity that represented a typical day in the<br />
peak month. For the passenger activity, Official Airline Guide (OAG) flight<br />
schedules were used to determine peak hour operations. For cargo, general<br />
aviation, air taxi, and military, radar data was used to determine design day and<br />
peak hour factors. Table 1.3-3, KCI Peak Period Aircraft Operations<br />
Forecast, presents the peak month, design day, and peak hour ratios used to<br />
develop the peak period aircraft operations forecast for each of the key operation<br />
segments at KCI: commercial passenger, air cargo, general aviation including noncommercial<br />
air taxi, and military.<br />
Landrum & Brown Page 11<br />
April 2013
KANSAS CITY INTERNATIONAL AIRPORT<br />
ADVANCE TERMINAL PLANNING STUDY<br />
PROGRAM CRITERIA DOCUMENT<br />
DRAFT<br />
Table 1.3-3<br />
KCI PEAK PERIOD AIRCRAFT OPERATIONS FORECAST<br />
DRAFT<br />
Source:<br />
Landrum & Brown<br />
Landrum & Brown Page 12<br />
April 2013
KANSAS CITY INTERNATIONAL AIRPORT<br />
ADVANCE TERMINAL PLANNING STUDY<br />
PROGRAM CRITERIA DOCUMENT<br />
DRAFT<br />
1.4 Benchmarking<br />
In order to better understand and identify the future needs of KCI, a Benchmarking<br />
<strong>Study</strong> was performed that compared the existing facilities at KCI to nine<br />
comparable domestic airports. The following airports were used for comparison in<br />
the study:<br />
<br />
<br />
<br />
<br />
<br />
<br />
<br />
<br />
<br />
<br />
Cincinnati / Northern Kentucky International Airport (CVG)<br />
Indianapolis International Airport (IND)<br />
San Jose International Airport (SJC)<br />
Memphis International Airport (MEM)<br />
Sacramento International Airport (SMF)<br />
Austin-Bergstrom International Airport (AUS)<br />
Cleveland Hopkins International Airport (CLE)<br />
Raleigh-Durham International Airport (RDU)<br />
Kansas City International Airport (KCI)<br />
Lambert – St. Louis International Airport (STL)<br />
The parameters compared in the study included:<br />
<br />
<br />
<br />
<br />
<br />
<br />
<br />
Million Annual Passengers (MAP)<br />
Number of gates<br />
Number of terminals<br />
Number of Security Screening Checkpoints (SSCP)<br />
<strong>Terminal</strong> square feet<br />
Concession square feet<br />
DRAFT<br />
Number of parking spaces, by type<br />
Figure 1.4-1, Existing Facilities At Comparable Domestic Airports,<br />
summarizes the data collected for each airport and used as the basis for the results<br />
from the Benchmarking <strong>Study</strong>. Also included in the table are images of the airfield<br />
layout and terminal layout at each airport. The results of the study were used to<br />
assist in the planning and design of the size and location of the New <strong>Terminal</strong> and<br />
associated facilities, such as on- and off-airport parking, gates, security, and<br />
concessions, to name a few.<br />
Landrum & Brown Page 13<br />
April 2013
KANSAS CITY INTERNATIONAL AIRPORT PROGRAM CRITERIA DOCUMENT<br />
ADVANCE TERMINAL PLANNING STUDY DRAFT<br />
MAP Level 6.9 7.4 8.3 8.6 8.7 9.0 9.0 9.1 10.4 12.5<br />
Gates 36 40 28 79 32 25 62 45 66 88<br />
<strong>Terminal</strong>s 2 1 2 3 2 1 1 2 3 2<br />
Number of SSCP 2 2 2 3 3 3 3 2 13 3<br />
<strong>Terminal</strong> SQFT 2,000,000 1,200,000 1,050,000 1,300,000 740,000 600,000 1,073,357 550,000 1,100,000 1,500,000<br />
Concession SQFT 109,200 59,738 12,784 68,046 42,885 37,976 40,024 56,465 61,186 71,979<br />
Parking - Short/Economy/Valet 7,750 13,918 2,358 870 9,890 4,212 5,170 6,087 21,555 4,097<br />
Parking - Long 6,000 4,403 3,991 3,550 10,059 5,923 2,746 9,925 1,750 4,672<br />
Parking - Total 12,000 18,268 6,349 4,425 19,949 10,135 7,916 18,763 23,305 8,769<br />
Landrum & Brown Page 14<br />
April 2013<br />
Figure 1.4-1<br />
EXISTING FACILITIES AT COMPARABLE DOMESTIC AIRPORTS<br />
Totals<br />
Airport Name CVG IND SJC MEM SMF AUS CLE RDU KCI STL<br />
Airfield Layout<br />
DRAFT<br />
<strong>Terminal</strong> Layout<br />
Source: Landrum & Brown
KANSAS CITY INTERNATIONAL AIRPORT<br />
ADVANCE TERMINAL PLANNING STUDY<br />
PROGRAM CRITERIA DOCUMENT<br />
DRAFT<br />
2. AIRFIELD REQUIREMENTS<br />
The proposed New <strong>Terminal</strong> is to be constructed at the existing <strong>Terminal</strong> A location.<br />
This section includes discussions of the following:<br />
<br />
<br />
<br />
<br />
<br />
<br />
Design Aircraft<br />
Aircraft Gates and Passenger Loading Bridges<br />
Service Roads<br />
Airfield Security<br />
Aircraft Deicing<br />
Fueling<br />
2.1 Design Aircraft<br />
When planning changes and/or improvements to an airport, a “design aircraft” must<br />
be identified that represents the size of aircraft typically using the airport, based on<br />
information from the airport and the airlines that use the airport. There are three<br />
parameters used in the selection of a design aircraft at KCI that include: Aircraft<br />
Approach Category (AAC), Airplane Design Group (ADG), and Taxiway Design<br />
Group (TDG). AAC is used for airspace planning, and approach and departure<br />
paths. For apron, taxilane, and taxiway design, the ADG and TDG define the design<br />
parameters for horizontal and vertical alignments.<br />
AAC is based on a speed of 1.3 times the stall speed in the landing configuration at<br />
maximum gross landing weight. The categories are summarized in Table 2.1-1,<br />
Aircraft Approach Categories, as defined in 14 Code of Federal Regulations<br />
(CFR) Part 97.<br />
Table 2.1-1<br />
AIRCRAFT APPROACH CATEGORIES<br />
Category<br />
A<br />
B<br />
C<br />
D<br />
E<br />
Speed<br />
≤ 91 knots<br />
≥ 91 knots and ≤ 121 knots<br />
≥ 121 knots and ≤ 141 knots<br />
≥ 141 knots and ≤ 166 knots<br />
≥ 166 knots<br />
Source: FAA AC 5300-13A, Table 1-1<br />
DRAFT<br />
ADGs are based on wingspan and tail height that determine separation<br />
standards. Table 2.1-2, Airplane Design Groups (ADG), summarizes the<br />
dimensions for each classification of ADGs, as defined in FAA Advisory Circular (AC),<br />
150/5300-13A, Airport Design. Based on information from the Airport and airlines,<br />
the typical airplane using KCI is an ADG III. Therefore, the design aircraft used for<br />
planning at KCI is an ADG III. Table 2.1-3, Design Aircraft, describes aircraft<br />
types and the percentage used at KCI.<br />
Landrum & Brown Page 15<br />
April 2013
KANSAS CITY INTERNATIONAL AIRPORT<br />
ADVANCE TERMINAL PLANNING STUDY<br />
PROGRAM CRITERIA DOCUMENT<br />
DRAFT<br />
Table 2.1-2<br />
AIRPLANE DESIGN GROUPS (ADG)<br />
Group # Tail Height (ft) Wingspan (ft)<br />
I < 20ʹ < 49ʹ<br />
II 20ʹ - < 30ʹ 49ʹ - < 79ʹ<br />
III 30ʹ - < 45ʹ 79ʹ - < 118ʹ<br />
IV 45ʹ - < 60ʹ 118ʹ - < 171ʹ<br />
V 60ʹ - < 66ʹ 171ʹ - < 214ʹ<br />
VI 66ʹ - < 80ʹ 214ʹ - < 262ʹ<br />
Source: FAA Advisory Circular (AC), 150/5300-13A, Table 1.2.<br />
Table 2.1-3<br />
DESIGN AIRCRAFT<br />
DRAFT<br />
Aircraft Type ADG TDG Wingspan (ft) Length (ft) Percent of Operations<br />
Widebody<br />
B-767-400 IV 5<br />
170.3<br />
201.4<br />
>1%<br />
B787-8<br />
V 5<br />
197.3<br />
186.1<br />
Narrowbody<br />
58%<br />
B-7373-900ER III 3 117.5 138.2<br />
Large Regional<br />
CRJ-900 III<br />
81.5<br />
119.3<br />
29%<br />
Embraer 190 III<br />
94.3<br />
118.9<br />
Small Regional<br />
CRJ-200 II<br />
69.6<br />
87.8<br />
11%<br />
Embraer 145 II<br />
65.7<br />
98.0<br />
Source: HNTB<br />
TDGs are based on main gear width and cockpit-to-main gear distance, and<br />
determine taxiway width and fillet design (See Figure 2.1-1, Taxiway Design<br />
Groups). Although wingspan typically determines taxiway/taxilane to<br />
taxiway/taxilane separations, in some instances, the separation is determined by<br />
TDG due to turning requirements. At least one Taxiway route should meet the<br />
requirements of the most demanding TDG, not only to the design aircraft TDG<br />
requirements.<br />
Landrum & Brown Page 16<br />
April 2013
KANSAS CITY INTERNATIONAL AIRPORT<br />
ADVANCE TERMINAL PLANNING STUDY<br />
PROGRAM CRITERIA DOCUMENT<br />
DRAFT<br />
Figure 2.1-1<br />
TAXIWAY DESIGN GROUPS<br />
Source:<br />
FAA AC 150/5300-13A<br />
2.2 Aircraft Gates and Loading Bridge Requirements<br />
2.2.1 METHODOLOGY<br />
One of the most reliable methodologies for projecting the number of aircraft<br />
parking positions at a terminal facility involves analyzing the projected peak hour<br />
aircraft operations in the form of an aircraft ramp chart. The ramp chart attempts<br />
to optimally schedule aircraft operations at all available terminal gate parking<br />
positions or at a Remain Overnight (RON) parking positions. The ramp chart<br />
methodology assumes an average ground occupancy time at the gate for the<br />
various types of aircraft to be serviced combined with a minimum time between<br />
when that aircraft leaves and when another aircraft can arrive at the same aircraft<br />
parking position. This methodology assumes that the airlines will attempt to<br />
maximize aircraft turns during its peak periods of operations within these base<br />
parameters of aircraft servicing times and a reasonable time allowance between<br />
turns referred inter gate time<br />
DRAFT<br />
The Ramp Chart relies heavily on the future flight schedules that are based on the<br />
existing July 14, 2011 flight schedule. The future flight schedules for 2025 and<br />
2030 are developed by growing the existing arrival and departure patterns of<br />
aircraft flights taking into account their seat capacities based on the future aircraft<br />
fleet mix needed to reach the future passenger and aircraft operation volumes.<br />
The peak hour aircraft operations used in preparing the ramp chart are shown in<br />
Section 1.3.7, Peak Activity for Operations; Table 1.3-3, KCI Peak Period Aircraft<br />
Operations Forecast; and the peak month, average day, and peak hour passengers<br />
are provided in Table 1.3-2, KCI Peak Period Enplanement Forecast.<br />
Landrum & Brown Page 17<br />
April 2013
KANSAS CITY INTERNATIONAL AIRPORT<br />
ADVANCE TERMINAL PLANNING STUDY<br />
PROGRAM CRITERIA DOCUMENT<br />
DRAFT<br />
Aircraft ramp charts for the New <strong>Terminal</strong> were developed using the 2025 and 2030<br />
design day flight schedules. Ramp charts were used to determine the number and<br />
size of aircraft parking positions both at the terminal as a contact gate or as a<br />
remote aircraft stand. Contact gates are serviced by a passenger loading bridge<br />
that connects the aircraft to the terminal holdroom while a remote aircraft is<br />
serviced by a busing connection that moves passengers to and from the terminal<br />
holdroom.<br />
The facility requirements analysis in this <strong>Study</strong> focused on using a combination of<br />
Preferential and Common Use peak passenger levels for the gate requirements.<br />
Preferential Use refers to those portions of the terminal, concourse, aircraft loading<br />
bridges, aircraft parking positions, apron, etc., that a single airline has priority over<br />
other airline users. Conversely, Common Use refers to those same facilities of the<br />
terminal, concourses and apron that are not assigned by lease to a single airline,<br />
but are used in common by multiple airlines. These areas include common use<br />
ticket counters, gates, and associated support space not otherwise held under an<br />
exclusive or preferential airline lease agreement with the Airport.<br />
The specific use assumptions in the development of facility requirements for the<br />
KCI Airport were that the three primary market share airlines would be assumed to<br />
be preferential users and that all other airlines would be treated as common use<br />
carriers. It should be noted that if all airlines at KCI were assumed as common use<br />
carriers the holdroom and gate areas could be reduced as a result of a higher<br />
utilization factor associated with shared facilities.<br />
Other functional projections are determined their relationship to the number and<br />
type of aircraft or the number of gates/seats serving the terminal area.<br />
Standardization of aircraft utilization and apron requirements are developed by<br />
using the Narrowbody Equivalent Gate (NBEG) index. This index converts the gate<br />
requirements of diverse aircraft types, from commuter aircraft to new large aircraft,<br />
so that they are equivalent to the apron capacity of a narrowbody aircraft gate.<br />
The amount of space or linear frontage each aircraft requires is based on the<br />
maximum wingspan of aircraft in its respective Aircraft Design Group (ADG).<br />
Aircraft are classified according to FAA Taxiway Design Groups as shown in<br />
Table 2.2-1, Narrowbody Equivalent Gate (NBEG) Index.<br />
DRAFT<br />
Landrum & Brown Page 18<br />
April 2013
KANSAS CITY INTERNATIONAL AIRPORT<br />
ADVANCE TERMINAL PLANNING STUDY<br />
PROGRAM CRITERIA DOCUMENT<br />
DRAFT<br />
Table 2.2-1<br />
NARROWBODY EQUIVALENT GATE (NBEG) INDEX<br />
FAA TAXIWAY DESIGN<br />
GROUP<br />
MAXIMUM<br />
WINGSPAN<br />
TYPICAL AIRCRAFT<br />
NBEG<br />
INDEX<br />
I Small Commuter 49’ Cessna 0.4<br />
II Medium Commuter 79’ SF340/CRJ 0.7<br />
III<br />
Narrowbody/Large<br />
Commuter<br />
118’ A320/B737/MD-80/ATR 1.0<br />
IIIa B757 125’ B757 1.1<br />
IV Widebody 171’ DC-10/MD-11/B767 1.5<br />
V Jumbo 214’ B747/A330,340/B777/B787 1.9<br />
VI NLA 262’ A380 2.3<br />
Source:<br />
FAA AC 150/5300-13 and Hirsh & Associates<br />
Physical location and proximity to the gate are important factors to consider when<br />
estimating the spatial requirements of gate holdrooms. The available holdroom<br />
area needs to be in close proximity to the gate being used. There is an advantage<br />
to having a configuration that locates holdroom seating in an open and contiguous<br />
manner since it allows the potential overflow of one holdroom into the adjacent<br />
holdroom, particularly if the adjacent holdroom does not have passengers at that<br />
moment awaiting a near term aircraft departure. These factors were taken into<br />
consideration when evaluating the future KCI requirements. The majority of the<br />
future KCI aircraft fleet mix is envisioned as narrowbody aircraft, however, select<br />
aircraft contact positions have the flexibility to accommodate widebody aircraft.<br />
For these infrequent occurrences it is assumed that the additional holdroom seating<br />
capacity needed for these infrequent widebody operations will be accommodated<br />
with a shared holdroom philosophy and nearby food and beverage seating capacity.<br />
DRAFT<br />
2.2.2 CURRENT CONDITIONS<br />
Currently, KCI operates out of its three separate terminals. The original terminals<br />
opened in 1972 with the capability of 30 gate doors on each terminal for a total of<br />
90 loading positions. The signage at the gates still reflects this original numbering<br />
system from 1 through 90. In actuality, KCI is only using 30 gates today out of a<br />
total of 62 available gates from all three terminals. There are 66 aircraft parking<br />
positions in total immediately adjacent to the three terminals but four of these<br />
positions are loaded from ground level. KCI has one international gate located at<br />
<strong>Terminal</strong> C. Narrowbody aircraft were 56 percent of passenger operations in 2012<br />
with less than one percent B757s, and the remaining 43 percent regional jets.<br />
The use of multiple terminals has become inefficient due to the number of unused<br />
gates (32 gates).<br />
Holdroom space within the KCI terminals is limited in size due to narrow overall<br />
depth of all three terminals at roughly 75 feet. The narrow depth comes from the<br />
original narrow curvilinear design of the Drive-to-Gate concept which attempted to<br />
minimize the walking distances between the vehicle curb and the gates.<br />
Landrum & Brown Page 19<br />
April 2013
KANSAS CITY INTERNATIONAL AIRPORT<br />
ADVANCE TERMINAL PLANNING STUDY<br />
PROGRAM CRITERIA DOCUMENT<br />
DRAFT<br />
This original design did not anticipate the need for passenger and hand luggage<br />
security screening. Today’s retrofit of the terminals now divides this limited 75 feet<br />
into separate non-secure landside and secure airside operations. In order to<br />
minimize the number of Transportation Security Administration’s (TSA) mandated<br />
Security Screen Checkpoints (SSCP), holdrooms were grouped together in small<br />
clusters and then each cluster was equipped with its own SSCP. This retrofit is<br />
cumbersome for several reasons:<br />
<br />
<br />
Separate secured holdroom clusters still generate the need for 14 SSCPs.<br />
Passengers are required to pass back through the SSCP after leaving the<br />
holdroom cluster.<br />
Due to the limited space in the holdroom clusters, the retrofitted<br />
configuration trades off holdroom space for secure restrooms and limited<br />
concessions.<br />
This tradeoff results in inadequate holdroom space, severely limited restroom<br />
facilities, and substandard concession offering inside the cluster resulting in a<br />
low LOS for passengers and a restricted ability to generate concession<br />
revenues for the Airport.<br />
2.2.3 FUTURE AIRCRAFT PARKING POSITIONS<br />
Domestic Service Requirements<br />
Based on the 2030 forecast, 41 contact gate aircraft parking positions are needed<br />
to accommodate the anticipated peak hour operations demands. For 2025, a total<br />
of 37 contact gate parking positions are needed. The future fleet mix envisioned<br />
for 2030 is not anticipated to vary significantly from the 2013 fleet which is<br />
dominated by narrowbody and smaller wingspan aircraft which was over 99 percent<br />
in 2012. As a consequence, all aircraft parking positions are planned to<br />
accommodate a minimum of an ADG III aircraft to allow for gate use flexibility.<br />
The maximum ADG III aircraft (B737-800/900 aircraft with a wingspan of 117 feet<br />
5 inches) was assumed for gate planning along with an associated wingtip clearance<br />
of 25 feet.<br />
DRAFT<br />
International Service Requirements<br />
The exception to having all narrowbody contact gates at KCI is the international<br />
arrivals capable gates. In the New <strong>Terminal</strong>, four gates will provide access to a<br />
sterile corridor leading to the Customs and Border Protection facilities. These four<br />
international-arrivals capable contact gates will be configured with multiple doors to<br />
allow for a “swing” capability between either a domestic or international operation.<br />
Two of these gate positions will also be configured to allow as large as an ADG V<br />
aircraft (B787-800) and will be paired with adjacent narrowbody aircraft positions<br />
to form a Multi-Aircraft Ramp System (MARS) gate. This will allow two narrowbody<br />
aircraft parking positions to accommodate a single widebody aircraft in the same<br />
apron location. Providing “swing” gates provides the Airport with a facility that can<br />
grow international air service to the passenger capacity of four simultaneous<br />
narrowbody aircraft or two widebody aircraft. The Federal Inspection Services (FIS)<br />
facilities were sized in relationship to this theoretical demand.<br />
Landrum & Brown Page 20<br />
April 2013
KANSAS CITY INTERNATIONAL AIRPORT<br />
ADVANCE TERMINAL PLANNING STUDY<br />
PROGRAM CRITERIA DOCUMENT<br />
DRAFT<br />
Remain Overnight (RON) Requirements<br />
Based on the 2030 forecast, 31 RON aircraft parking positions will be needed to<br />
stage access to the 41 contact gates at the New <strong>Terminal</strong> during the morning peak.<br />
For 2025 the number of RONs drops to 28. RON operations will require aircraft<br />
movement to an open contact gate for passenger loading and unloading<br />
Summary of Future Aircraft Parking Positions<br />
As shown in Table 2.2-2, Summary of Future Aircraft Parking Positions, a<br />
total of 41 contact gates and 31 RON aircraft parking positions will be necessary at<br />
KCI to handle the forecast 14 Million Annual Passengers (MAP) in 2030. All contact<br />
gates need to be capable of handling the majority of narrowbody aircraft types<br />
designated by the 2030 forecast in order to maximize flexibility of a common use<br />
operation. In 2025 a total of 37 contact gate parking positions and 28 RON parking<br />
positions are needed. Four out of the initial 37 gates will need to be capable of<br />
accommodating international operations. The passenger loading bridges on these<br />
four international-capable aircraft parking positions will also be configured to allow<br />
two of the gates to be used by a potential ADG V aircraft, the largest of which is<br />
anticipated to be a B787-800 aircraft.<br />
Table 2.2-2<br />
SUMMARY OF FUTURE AIRCRAFT PARKING POSITIONS<br />
Aircraft Parking Positions<br />
Forecast Year<br />
2025 2030<br />
<strong>Terminal</strong> Contact Gates 37 41<br />
Remote Overnight Stands (RONs) 28 31<br />
Source:<br />
Landrum & Brown<br />
DRAFT<br />
2.2.4 PASSENGER LOADING BRIDGE REQUIREMENTS<br />
The pathway to and from the contact gate door to the parked aircraft must meet<br />
Americans with Disabilities Act (ADA) requirements. This means that any fixed<br />
section and the passenger loading bridge at any of the contact gate positions may<br />
not exceed a 1-in-12 (8.33 percent) slope along its pathway. With ADG III aircraft<br />
(B737s) and smaller as the predominant aircraft through 2030, a finished floor<br />
height for gates of approximately 13 feet 6 inches above the apron has been<br />
assumed in order to minimize the length of the loading bridge required to reach the<br />
lowest and highest door sill height of the primary passenger loading of the aircraft<br />
types serving the Airport. Door sill heights for forecast aircraft range from five feet<br />
(CRJ-200) to 15 feet 2 inches (B787-800). Currently, used Jetbridge models,<br />
predominantly the A3-58/110, would be able to accommodate these sill heights<br />
with a maximum extension of 102 feet. Currently, 30 contact gates are used but<br />
by 2025 37 gates will be required and 41 contact gates are projected for 2030, all<br />
of which will require passenger loading bridges. Currently, there are no bussing<br />
operations to remote aircraft parking positions for commercial passenger operations<br />
and none are anticipated over the forecast horizon.<br />
Landrum & Brown Page 21<br />
April 2013
KANSAS CITY INTERNATIONAL AIRPORT<br />
ADVANCE TERMINAL PLANNING STUDY<br />
PROGRAM CRITERIA DOCUMENT<br />
DRAFT<br />
2.3 Apron Service Road<br />
Designated service roads are provided on or near aprons to restrict service vehicle<br />
movements to a confined area(s) where the pilot is familiar with seeing vehicle<br />
activity. Proper layout of service roads on an airfield contributes to airport safety<br />
and the reduction in runway incursions.<br />
Factors to consider when designing service roads include items such as<br />
current/future vehicle and ground-service equipment movement, space, bearing<br />
strength, height clearance, separation standards from runways/taxiways, and<br />
access. The width of service roads depends on the projected traffic levels, and the<br />
widest equipment expected to use the service road, etc.<br />
A proposed service road, for vehicles permitted to operate within the terminal area<br />
such as ground support equipment and other vehicles, will be located behind the<br />
aircraft parking positions and outside the taxilane object free areas 1 for access to<br />
aircraft. The service road should be designed to avoid crossing runways and<br />
taxiways/taxilanes to the extent possible. However, when a crossing is necessary,<br />
proper marking must be in place to ensure vehicles stop or yield to aircraft.<br />
2.4 Airside Security Requirements<br />
Airfield security will be maintained throughout the construction of the New <strong>Terminal</strong><br />
and continue when the new facilities are in operation. Security screening of<br />
construction personnel to meet FAA, Department of Homeland Security (DHS), and<br />
KCAD requirements will continue to be implemented. KCAD will develop a staffing<br />
plan to support the increased security screening of construction personnel for the<br />
program.<br />
DRAFT<br />
Where possible, facilities that require separate landside and airside access should<br />
be constructed along the Airport perimeter fence line to reduce unnecessary access<br />
to the airfield and potential security breaches. Temporary security fencing can be<br />
installed around the proposed terminal construction area during construction<br />
outside the AOA. Maximizing the amount of construction outside the AOA would<br />
result in an additional benefit: more personnel eligible to perform construction.<br />
Permanent AOA security fence and gates will be composed of chain link fence<br />
materials with barbed wire overguard to meet FAA and KCAD requirements. Chain<br />
link fences will be a minimum of eight feet tall with a three-strand barbed wire<br />
overguard. Any fence and gate modifications will interface with the Airport’s<br />
existing access control and monitoring system.<br />
1<br />
A two dimensional ground area surrounding taxiways and taxilanes which is clear of objects except<br />
for Navigation Aids (NAVAIDs) and objects whose location is fixed by function.<br />
Landrum & Brown Page 22<br />
April 2013
KANSAS CITY INTERNATIONAL AIRPORT<br />
ADVANCE TERMINAL PLANNING STUDY<br />
PROGRAM CRITERIA DOCUMENT<br />
DRAFT<br />
2.5 Aircraft Deicing<br />
Currently at KCI, aircraft are pushed back from the gate to deice. The glycol<br />
contaminated runoff is collected in trench drains along the perimeter of each<br />
terminal apron. Based on the apron pavement grades, the trench drains collect<br />
runoff from a significant portion of the apron as well as the gate deicing areas.<br />
Collection from a large area dilutes the concentration of the glycol-contaminated<br />
runoff and also increases the capacity need of the retention basins used for initial<br />
storage of glycol-contaminated runoff.<br />
KCI operates in accordance with the requirements of a National Pollutant Discharge<br />
Elimination System (NPDES) permit issued by the Missouri Department of Natural<br />
Resources (MDNR). The NPDES permit imposes controls intended to ensure that<br />
stormwater discharges at KCI meet applicable water quality standards. Conditions<br />
of the permit are implemented at the Airport through a Storm Water Pollution<br />
Prevention Plan (SWPPP). Under the terms of the permit, the Airport is responsible<br />
to the State of Missouri for all industrial and stormwater discharges originating on<br />
the property with the exception of the former American Airline Overhaul Base.<br />
KCAD is currently in negotiations with the MDNR regarding the outfall permit.<br />
The MDNR permit is a numerical limit-based permit focused on Biochemical Oxygen<br />
demand (BOD), Chemical Oxygen demand (COD), Total Suspended Solids (TSS),<br />
Oil and Grease (O/G), and Total Petroleum Hydrocarbons (TPH). Table 2.5-1,<br />
MDNR Operating Requirements, summarizes the current KCI MDNR Operating<br />
Permit.<br />
DRAFT<br />
In an effort to collect glycol-impacted stormwater during deicing operations at KCI,<br />
KCAD has installed an underground drainage system that directs<br />
glycol-contaminated runoff from the existing terminal aprons to a 2.4-million<br />
gallon, concrete lined retention basin. At this basin the glycol concentrations are<br />
measured to determine how the runoff should be discharged off of airport property.<br />
Landrum & Brown Page 23<br />
April 2013
KANSAS CITY INTERNATIONAL AIRPORT<br />
ADVANCE TERMINAL PLANNING STUDY<br />
PROGRAM CRITERIA DOCUMENT<br />
DRAFT<br />
Table 2.5-1<br />
MDNR OPERATING REQUIREMENTS<br />
Effluent Parameter<br />
Unit<br />
Final Effluent<br />
Limitations<br />
Daily<br />
Max.<br />
Monthly<br />
Average<br />
Monitoring Requirements<br />
Monitoring<br />
Frequency<br />
Sample<br />
Type<br />
Flow MGD * * once/month 24 hr. est.<br />
Precipitation Inches * * once/month 24 hr. est.<br />
BOD mg/L 45 30 once/month grab<br />
COD mg/L 120 90 once/month grab<br />
TSS mg/L 100 50 once/month grab<br />
TPH mg/L 15 10 once/month grab<br />
O/G mg/L 15 10 once/month grab<br />
pH-Units SU ** ** once/month grab<br />
Total BETX mg/L 0.75 0.75 once/month grab<br />
Benzene mg/L 0.07 0.07 once/month grab<br />
Methyl Tertiary Butyl<br />
Ether (MTBE)<br />
mg/L * * once/month grab<br />
Total Glycols mg/L * * once/month*** grab<br />
Ethylene Glycol mg/L * * once/month*** grab<br />
Propylene Glycol mg/L * * once/month*** grab<br />
Notes: * Monitoring Requirement Only<br />
** pH is measured in pH units and is not to be averaged.<br />
*** The pH is limited to the range of 6.0 9.0 pH units.<br />
Source: HNTB Corporation<br />
DRAFT<br />
Low concentrations of glycol are discharged into a pond east of the retention basins<br />
and ultimately into the Berlin Reservoir. At the north end of the reservoir, the<br />
overflow discharges into a tributary of Todd Creek. A monitoring station is located<br />
on the north end of the reservoir to measure compliance to KCI’s MDNR permit.<br />
Medium concentrations are gravity fed through a series of pipes to the Todd Creek<br />
wastewater treatment facility. Highly concentrated runoff is pumped from the<br />
retention basins into trucks and hauled directly to the Todd Creek wastewater<br />
treatment facility.<br />
The goal of the proposed aircraft deicing operations is to reduce the amount of<br />
surface area collecting glycol-contaminated runoff and increase the concentration of<br />
deicing fluids in the runoff. The higher concentrations will allow KCAD to develop a<br />
program that has one type of discharge method. Methods for achieving the goals<br />
are discussed in the following paragraphs.<br />
Landrum & Brown Page 24<br />
April 2013
KANSAS CITY INTERNATIONAL AIRPORT<br />
ADVANCE TERMINAL PLANNING STUDY<br />
PROGRAM CRITERIA DOCUMENT<br />
DRAFT<br />
2.5.1 CENTRALIZED DEICING OPERATIONS<br />
A centralized deicing facility is an aircraft deicing facility located at the terminal<br />
apron or along taxiways serving departure runways. Gate deicing operations will<br />
not be permitted at the New <strong>Terminal</strong> but centralized deicing locations will be<br />
utilized that will reduce the area to collect glycol-contaminated runoff.<br />
All centralized deicing facilities will meet the requirements of FAA Advisory Circular<br />
(AC) 150/5300-14B, Design of Aircraft Deicing Facilities.<br />
The design of deicing facilities should, to the extent practicable, meet the needs of<br />
air carriers, as outlined in FAA-approved aircraft ground deicing/anti-icing<br />
programs, and all other aviation community users. A key element in this effort is<br />
designing a facility that is efficient and offers users operational flexibility.<br />
Coordination of an airport owner’s Snow and Ice Control Plan and user’s ground<br />
deicing/anti-icing programs, with input from the FAA, will ensure that icing<br />
conditions affecting the safety of flight are better met.<br />
The forecasted peak hour of aircraft departures is from 06:05 to 07:05, with<br />
thirty-four departures. To determine the total number of deicing pads necessary to<br />
accommodate the peak hour traffic, it is necessary to understand the aircraft<br />
deicing process. Through discussions with aircraft deicing experts and analysis of<br />
deicing pad throughput at commercial service airports, it was determined that an<br />
average time for an aircraft to enter a deicing pad, complete the deicing process,<br />
and exit is 20 minutes.<br />
Based on the 20-minute deicing pad occupancy duration, three aircraft can be<br />
deiced per hour per pad. With a peak hour of thirty-four departures, twelve deicing<br />
pads will accommodate the peak hour. The proposed aircraft utilizing the deicing<br />
pads is summarized in Table 2.5-2, Projected Aircraft Fleet Mix, and the last<br />
column details the number of deicing pads required to accommodate each aircraft<br />
type.<br />
Table 2.5-2<br />
PROJECTED AIRCRAFT FLEET MIX<br />
Aircraft Type ADG Wingspan (ft) Length (ft)<br />
Wide Body<br />
B-767-400<br />
B787-8<br />
Narrow Body<br />
B-737-900ER<br />
Large Regional<br />
CRJ-900<br />
Embraer 190<br />
Small Regional<br />
CRJ-200<br />
Embraer 145<br />
DRAFT<br />
IV<br />
V<br />
170.3<br />
197.3<br />
201.4<br />
186.1<br />
Percent of<br />
Operations<br />
Necessary<br />
Deicing Pads<br />
>1% 1<br />
III 117.5 138.2 58% 8<br />
III<br />
III<br />
II<br />
II<br />
81.5<br />
94.3<br />
69.6<br />
65.7<br />
119.3<br />
118.9<br />
87.8<br />
98.0<br />
29% 3<br />
11% 1<br />
Source:<br />
HNTB Corporation<br />
Landrum & Brown Page 25<br />
April 2013
KANSAS CITY INTERNATIONAL AIRPORT<br />
ADVANCE TERMINAL PLANNING STUDY<br />
PROGRAM CRITERIA DOCUMENT<br />
DRAFT<br />
2.5.2 DEICING PAD SIZE REQUIREMENTS<br />
The size of an aircraft deicing pad is determined by the aircraft parking area and<br />
the maneuvering area for mobile deicing vehicles. The aircraft parking area is the<br />
inner area used for parking aircraft to receive deicing/anti-icing treatment.<br />
The width of the parking area equals the upper wingspan of the most demanding<br />
aircraft ADG using the deicing pad. The length of the parking area equals the<br />
fuselage length of the most demanding aircraft using the deicing pad.<br />
Widebody deicing pads will be sized based on the B787-8 aircraft dimensions.<br />
The 11 deicing pads to serve ADG III aircraft will be sized based on the B737-<br />
900ER aircraft. Deicing pads for the small regional jets (ADG II) will be sized based<br />
on the CRJ-200 aircraft.<br />
The Vehicle Maneuvering Area (VMA) for mobile deicing vehicles is the outer area<br />
that provides the “vehicle lane width” necessary for two or more mobile deicing<br />
vehicles to satisfactorily perform simultaneous, and complete left- and right-side<br />
uniform fluid distribution techniques for removing deposits of frost, ice, slush, and<br />
snow from aircraft surfaces and for anti-icing operations. The vehicle lane width<br />
must be 12.5 feet (3.8 m) and be mutually exclusive of any adjacent deicing pad.<br />
Adjacent deicing pads will be separated by a ten-foot wide vehicle safety zone<br />
(VSZ). A VSZ will also be located on the outboard edge of any outer deicing pad.<br />
Centralized deicing facilities will be located within the non-movement area in close<br />
proximity to the adjacent taxiway network. Deicing pads will be sized to<br />
accommodate the critical aircraft detailed previously. Table 2.5-3, Deicing Pad<br />
Dimensional <strong>Criteria</strong>, summarizes the deicing pad separation requirements<br />
defined in AC 150/5340-14A, Design of Aircraft Deicing Facilities.<br />
Table 2.5-3<br />
DEICING PAD DIMENSIONAL CRITERIA<br />
ADG<br />
DRAFT<br />
Outer Deicing Pads<br />
Taxi Centerline to Edge of Vehicle<br />
Safety Zone (VSZ)<br />
Interior Deicing Pads<br />
Taxi Centerline to Taxi Centerline<br />
V 138 ft. 286 ft.<br />
IV 112.5 ft. 235 ft.<br />
III 81 ft. 172 ft.<br />
II 57.5 ft. 125 ft.<br />
Source:<br />
FAA AC 150/5340-1B<br />
Aircraft deicing pads for off-gate facilities will have parallel taxiway centerlines to<br />
permit flow-through deicing operations. Separation criteria provided in Table 2.5-3<br />
takes into account the need for individual deicing pads to provide adequate wingtip<br />
clearance, sufficient maneuvering area around the aircraft to allow simultaneous<br />
treatment by two or more mobile deicing vehicles, and sufficient non-overlapping<br />
space for the VSZ between adjacent deicing pads and for outer deicing pads.<br />
Landrum & Brown Page 26<br />
April 2013
KANSAS CITY INTERNATIONAL AIRPORT<br />
ADVANCE TERMINAL PLANNING STUDY<br />
PROGRAM CRITERIA DOCUMENT<br />
DRAFT<br />
2.5.3 DEICING SUPPORT FACILITIES<br />
The proposed centralized deicing pad will require an efficient support network for<br />
chemical off-loading from transport vehicles and loading to deicing trucks.<br />
These facilities should provide close proximity to the centralized deicing pads to<br />
maintain efficient deicing operations. Described below are the required de-icing<br />
support facilities.<br />
Nighttime/Low-Visibility Lighting: All facilities will require permanent nighttime<br />
lighting structures or portable nighttime lighting systems are available so ground<br />
crews have the necessary illumination for deicing/anti-icing operations and<br />
pre-takeoff inspections during night or low-visibility conditions. One portable<br />
alternative is mobile deicing vehicles with modified lights that provide sufficient<br />
illumination for deicing/anti-icing treatments and pre-takeoff inspections during<br />
night or low visibility. AC 150/5360-13, <strong>Planning</strong> and Design Guidelines for Airport<br />
<strong>Terminal</strong> Facilities, Table 4-1, provides general lighting requirements for<br />
apron-related functions. The height of lighting poles must be in accordance with<br />
AC 150/5300-13, Object Clearing <strong>Criteria</strong>. Permanent nighttime lights should be<br />
aimed and shielded to avoid glare to pilots and the Air Traffic Control Tower (ATCT)<br />
line-of-sight without reducing the illumination of critical areas.<br />
Electronic Message Boards: The use of electronic message boards (EMBs) at<br />
off-gate deicing facilities by the service provider have increased the overall<br />
efficiency of deicing aircraft and improved the transfer of information between flight<br />
crews and service providers. In general, the primary purpose for installing EMBs is<br />
to: (1) reduce verbal communication between all involved parties; (2) provide<br />
flight crews with clear, concise information; (3) improve deicing pad operational<br />
safety and efficiency; and (4) reduce ground congestion by removing personnel and<br />
equipment from the deicing pad area after completing deicing/anti-icing operations.<br />
If EMBs are installed, they should be installed in accordance with SAE AS 5635,<br />
Message Boards (Deicing Facilities). The SAE aerospace standard defines the<br />
minimum content and appearance of the electronic display, functional capabilities,<br />
design requirements, and inspection and testing requirements for EMBs.<br />
One acceptable location for EMBs is within the VSZ.<br />
DRAFT<br />
Administrative Building: An administrative building is necessary to support the<br />
deicing operations that can include administrative areas, training rooms, and break<br />
areas for the deicing vehicle operators.<br />
Maintenance Building: A maintenance building is necessary for maintenance of the<br />
deicing vehicles that will include ample service bays. The building will also need to<br />
provide parking for the deicing vehicles.<br />
Loading Areas: A location for deicing vehicles to be loaded with glycol and water.<br />
Glycol Storage Tanks: Storage tanks are necessary to support the glycol loading<br />
and blending operations. The tanks need to be accessed from the landside to<br />
support delivery operations. To protect the performance characteristics of deicing<br />
fluids from degradation, storage tanks and fluid transfer systems installed at<br />
Landrum & Brown Page 27<br />
April 2013
KANSAS CITY INTERNATIONAL AIRPORT<br />
ADVANCE TERMINAL PLANNING STUDY<br />
PROGRAM CRITERIA DOCUMENT<br />
DRAFT<br />
deicing facilities must be designed in accordance with the fluid manufacturer’s<br />
recommendations. Fluid transfer systems must be dedicated to the specific fluid<br />
being handled to prevent the inadvertent mixing of fluids of different types or<br />
different manufactures.<br />
Access Road: A dedicated access road from the deicing pads to the truck loading<br />
area and maintenance building is necessary for the de-icing vehicle use.<br />
Employee Parking: An employee parking lot, outside the AOA fence, is needed for<br />
administration, maintenance, and deicing service operation employees.<br />
2.5.4 DEICING COLLECTION SYSTEM REQUIREMENTS<br />
Collection of glycol-contaminated runoff begins with reducing the application area of<br />
deicing fluids, grading the application area to collect the entirety of the deicing<br />
pad(s) runoff, and incorporating collection areas and pipe networks to convey the<br />
contaminated runoff to a retention facility for ultimate treatment or disposal.<br />
Pavement: The pavement must be either concrete or asphalt and designed for the<br />
aircraft fleet mix. The pavement should be grooved to assist in channeling deicing<br />
fluids for collection and to provide aircraft and personnel better traction.<br />
Apron grades and adjacent surface gradients are a maximum of one percent in<br />
accordance with AC 150/5300-13, Airport Design. Apron areas should direct flows<br />
away from deicing pad centerlines, fixed-fluid applicators, vehicle safety zones, and<br />
crew shelter. If interior covered drains are used, they must not create a hazard to<br />
aircraft and personnel.<br />
DRAFT<br />
The perimeter of the deicing pad must extend beyond the aircraft so no aircraft<br />
surface being deiced extends beyond the perimeter.<br />
Collection System: Diversion manholes will be installed within or immediately<br />
adjacent to the deicing pad, which will divert seasonal glycol runoff to the glycol<br />
collection system during the deicing season. Throughout the remainder of the year,<br />
valves within the diversion manholes can be adjusted to direct the stormwater<br />
runoff collected within the deicing pads to the stormwater collection system.<br />
Additionally, the valves within the diversion manholes will be manufactured of<br />
materials that prevent accelerated corrosion due to the high concentration of<br />
glycols.<br />
Area inlets and the diversion manholes need to be constructed of materials that are<br />
not susceptible to damage from the deicing materials. Concrete structures may<br />
require a special treatment to prevent the glycols from reacting with the cement<br />
materials and degrading the integrity of the structures. All pipes installed to<br />
convey glycol-contaminated runoff will be manufactured of High-density<br />
polyethylene (HDPE) or a similar material that cannot be damaged by the deicing<br />
materials.<br />
Landrum & Brown Page 28<br />
April 2013
KANSAS CITY INTERNATIONAL AIRPORT<br />
ADVANCE TERMINAL PLANNING STUDY<br />
PROGRAM CRITERIA DOCUMENT<br />
DRAFT<br />
Storage: Currently, glycol-contaminated runoff from the terminal apron is initially<br />
discharged into retention basins on the north side of the terminal apron adjacent to<br />
Bogota Avenue. Additionally, a three-million gallon above-ground storage tank<br />
(AST) is located west of the retention basins to collect glycol-contaminated runoff<br />
from the cargo and general aviation aprons located along Taxiway B, north of the<br />
terminal area. The runoff is stored in these facilities and analyzed for glycol<br />
concentration to determine the proper discharge method based on the level of<br />
glycol concentration.<br />
A similar concept is necessary for storage of the runoff from the centralized deicing<br />
facilities. Storage tanks are proposed to store the runoff and also assist in<br />
maintaining higher concentrations of glycol in the runoff by preventing precipitation<br />
from diluting the stored fluids.<br />
Discharge: Since deicing/anti-icing fluids are chemical products that affect the<br />
water quality of receiving waters and the aquatic communities that use those<br />
waters, the runoff collected needs to be discharged to meet the MDNR permit<br />
requirements and meet the requirements of Federal, state, and local environmental<br />
jurisdictions.<br />
There are multiple options to mitigate the higher concentrations of glycol runoff<br />
anticipated with the centralized deicing operations, as discussed below. However, a<br />
detailed benefit-cost analysis is necessary to identify a preferred alternative that<br />
has the least impact on the environment and provides the most economic benefit to<br />
the Airport.<br />
The concentrated glycol runoff can be sold to vendors that will haul the highly<br />
concentrated runoff directly from the storage tanks to the vendor’s facilities to be<br />
repurposed in accordance with all environmental jurisdictions.<br />
DRAFT<br />
The concentrated glycol runoff can be discharged directly to the sanitary sewer<br />
treatment plant for biochemical treatment. This would require the construction of a<br />
dedicated line from the storage tanks to the sanitary sewer system or the<br />
incorporation of haul trucks to transport the runoff to the treatment facility.<br />
A pump station can be utilized to discharge metered runoff to receiving waters such<br />
as Todd Creek. However, the higher concentrations anticipated would make<br />
meeting the MDNR permit requirements for discharge very difficult.<br />
On-airport anaerobic biochemical reactors can be incorporated to pre-treat runoff<br />
prior to discharge. The bioremediation system generally consists of a glycol<br />
contaminated stormwater collection and storage system, a bioreactor treatment<br />
system, and a gas/heat recovery system. Many treatment plants will only accept<br />
limited quantities of glycol-contaminated stormwater. Anaerobic systems,<br />
depending on the airport’s discharge permit, can reduce BOD concentration levels<br />
sufficiently to permit unrestricted disposal to a sanitary sewer treatment facility.<br />
Landrum & Brown Page 29<br />
April 2013
KANSAS CITY INTERNATIONAL AIRPORT<br />
ADVANCE TERMINAL PLANNING STUDY<br />
PROGRAM CRITERIA DOCUMENT<br />
DRAFT<br />
Recycling glycol provides airport management with recycled glycol and water, and<br />
may lower disposal cost of effluent through the resale of recovered product to fluid<br />
manufacturers or to other secondary markets. In addition, sludge disposal costs<br />
may be reduced that are incurred by other mitigation alternatives and less physical<br />
space may be needed for equipment. Typically a third party vendor conducts the<br />
recycling operations through a service agreement with the airport owner.<br />
2.6 Fueling Requirements<br />
2.6.1 EXISTING FUEL FACILITY<br />
The KCI Fuel Farm, located north of <strong>Terminal</strong>s A, B, and C, is operated and<br />
maintained by Allied Fuel and bounded by Brasilia Avenue, Mexico City Avenue, and<br />
Bern and Paris streets. Fuel is supplied to the facility by pipeline and trucks and<br />
receives daily fuel batch supplies equal to 220,000 gallons. The KCI Fuel Farm has<br />
adequate capacity to both receive, store, and settle fuel per ATA 103.<br />
Magellan Mainstream Partners own and operate a single six-inch Class 300 pipeline<br />
with a maximum delivery rate of 22,000 gallons per hour (gph) or 367 gallons per<br />
minute (gpm), and is used to transfer average batch fuel supplies equal to<br />
220,000 gallons per day (gpd) to the Airport. This flow rate can be maintained for<br />
ten hours. The pipeline filter separator is a Clay Treater rated at 840 gpm and a<br />
Coalescer Water/Sediment Filter rated at 800 gpm. The pipeline includes a turbine<br />
meter and a prover loop located at the KCI fuel facility.<br />
The fuel farm includes one truck off-load position rated for up to 2,000 gallons per<br />
minute (gpm) and six ASTs. Tank capacities include:<br />
<br />
<br />
<br />
DRAFT<br />
Four each 5,000 barrel (bbl) AST (210,000 gallons/each)<br />
Two each 8,000 bbl AST (336,000 gallons/each)<br />
Gross Capacity: 36,000 bbls.<br />
Net Usable Capacity into hydrant distribution system: 90% x 36,000 bbls =<br />
32,400 bbls (1,360,800 Gal).<br />
Fuel receipts are transferred to one 8,000 bbl and one 5,000 bbl on the first day.<br />
The fuel in these two tanks settle on the second day and the pipeline batch fuel<br />
receipt alternates into two additional 5,000-barrel tanks. The process repeats on<br />
the third day.<br />
The fuel farm transfer and hydrant distribution systems include equipment to move<br />
fuel from tank storage into other tanks, trucks, or to the aircraft gates at the<br />
terminal buildings. The system includes three types of distribution: transfer<br />
system, truck offload system, and hydrant distribution main lines.<br />
Landrum & Brown Page 30<br />
April 2013
KANSAS CITY INTERNATIONAL AIRPORT<br />
ADVANCE TERMINAL PLANNING STUDY<br />
PROGRAM CRITERIA DOCUMENT<br />
DRAFT<br />
Transfer System: Four 900 gpm Bingham 100 hp vertical turbine type pumps and<br />
four 900 gpm Facet Filter Separators are used to remove sediment and water from<br />
the fuel. The transfer system is used to transfer fuel from one tank to another, to<br />
clean up fuel through a filter separator, and to load Airport trucks to fuel cargo<br />
aircraft.<br />
Truck Offload System: Two positive displacement pumps are installed, each with a<br />
Facet Filter. A Clay Treater is also installed for removal of surfactants from tanker<br />
truck fuel receipts.<br />
Hydrant System: There are seventeen 1,000-gpm into-hydrant pumps.<br />
Nine pumps have been taken out of service, leaving eight 1,000-gpm pumps in<br />
service. An equal number (17) of Facet Filter Separators, one per pump, are<br />
installed with eight in operation. The hydrant system is used to supply fuel to the<br />
terminal gates to fuel aircraft.<br />
2.6.2 EXISTING FUEL CONSUMPTION<br />
The fuel consumption data for recent 12 months (April 2011 to March 2012) at KCI<br />
totaled 81,237,127 gallons. The average daily consumption for the same period<br />
was 222,567 gallons. Peak hourly fuel consumption during the busiest time period<br />
was 15,000 gpm. Current 2012 hourly peak fuel consumption is less than<br />
8,000 gpm.<br />
Five 16-inch main fuel hydrant distribution lines (mains) run from the fuel farm and<br />
south on Brasilia Avenue to <strong>Terminal</strong>s A, B, and C. The five mains are designated<br />
as Line A, B, C, D, and E. Lines A and B are currently 18-inch nominal diameter<br />
between the fuel farm and Gate C90. The other three lines (C, D, and E) vary in<br />
size but start out from the fuel farm as 18 inches, 16 inches, and 14 inches,<br />
respectively. However, Lines C, D, and E have been taken out of service and<br />
reported to be filled with nitrogen.<br />
DRAFT<br />
Line A feeds the outside of <strong>Terminal</strong> A, the inside loop of <strong>Terminal</strong> B, and half of the<br />
inside of <strong>Terminal</strong> C. The B Line feeds the inside of <strong>Terminal</strong> A, the outside of<br />
<strong>Terminal</strong> B, and the outside and part of the inside of <strong>Terminal</strong> C. The other lines<br />
(C, D, and E) are tied into the three terminal buildings through isolation valve<br />
vaults. All five lines dead end in an isolation valve vault located near <strong>Terminal</strong> C.<br />
Hydrant pressure in the mains is 150PSI.<br />
Table 2.6-1, Hydrant Distribution, compares multiple 16-inch lines to determine<br />
adequate pipe velocities given equal flow in each line.<br />
Landrum & Brown Page 31<br />
April 2013
KANSAS CITY INTERNATIONAL AIRPORT<br />
ADVANCE TERMINAL PLANNING STUDY<br />
PROGRAM CRITERIA DOCUMENT<br />
DRAFT<br />
Table 2.6-1<br />
HYDRANT DISTRIBUTION<br />
EVENT<br />
TERM A<br />
FLOW<br />
(GPM)<br />
TERM B<br />
FLOW<br />
(GPM)<br />
TERM C<br />
FLOW<br />
(GPM)<br />
TOTAL<br />
FLOW<br />
(GPM)<br />
Velocity<br />
2 - 16”<br />
Mains<br />
(FPS)<br />
Velocity<br />
3 - 16”<br />
Mains<br />
(FPS)<br />
Velocity<br />
4 - 16”<br />
Mains<br />
(FPS)<br />
Velocity<br />
5 - 16”<br />
Mains<br />
(FPS)<br />
Comments<br />
Current 2670 2670 2670 8010 6.4 4.2 3.2 2.6<br />
All Time<br />
Max<br />
Design<br />
Max<br />
Future<br />
New<br />
Term<br />
Source:<br />
5000 5000 5000 15,000 12.0 8.0 6.0 4.8<br />
5666 5667 5667 17,000 14.1 9.4 7.1 5.7<br />
7560 0 0 7560 6.0 4.1 3.1 2.5<br />
2 – 16”<br />
Good<br />
3 – 16”<br />
Needed<br />
4 – 16”<br />
Needed<br />
2 – 16”<br />
Good<br />
HNTB Corporation analysis based on Allied Aviation and Flow of Fluids through Valves, Fittings and Pipe,<br />
CRANE Technical Paper No. 410.<br />
Table 2.6-2, Flow Rates by Pipe Size, is a general listing of flow rates and<br />
velocities per SCH40 Carbon Steel pipe size.<br />
Table 2.6-2<br />
FLOW RATES BY PIPE SIZE<br />
PIPE DIAMETER 6 Feet per Second<br />
7 FPS 10 FPS<br />
(Inches)<br />
(FPS)<br />
6 530 620 880<br />
DRAFT<br />
8 940 1100 1600<br />
10 1500 1700 1700<br />
12 2100 2500 2500<br />
14 2900 3400 3400<br />
16 3800 4400 6300<br />
18 4800 5500 8000<br />
20 5875 6855 9790<br />
Source:<br />
HNTB Corporation analysis based on Allied Aviation and Flow of Fluids through Valves, Fittings and Pipe,<br />
CRANE Technical Paper No. 410.<br />
2.6.3 FUTURE PEAK FLOW ESTIMATE APPROACH<br />
The following assumptions are considered accurate at this time, but may change as<br />
the project’s planning and design phases occur. The total number of gates at the<br />
new terminal will be 41. There are an estimated 39 gates sized for Group III<br />
aircraft (B737) and two gates sized for Group V (B777 and B747) aircraft.<br />
The typical Group III gate turnaround average time is 30 minutes and the typical<br />
Group V average turnaround time is 60 minutes. The desired velocity in the<br />
hydrant main is between six and seven feet/second.<br />
Landrum & Brown Page 32<br />
April 2013
KANSAS CITY INTERNATIONAL AIRPORT<br />
ADVANCE TERMINAL PLANNING STUDY<br />
PROGRAM CRITERIA DOCUMENT<br />
DRAFT<br />
Peak fuel rate calculations are based on the assumed number and type of aircraft<br />
fueling at any one peak period. The estimated peak fuel flow is 8,000 gpm<br />
(Group III), plus 1,200 gpm (Group V) which equals 9,200 gpm. The New <strong>Terminal</strong><br />
design will use this estimate to calculate the components necessary to deliver that<br />
demand. As a check and balance, the highest recorded Peak Fuel Flow Rate during<br />
busiest operations was 15,000 gpm based on information provided by Allied<br />
Aviation.<br />
One 18-inch line is recommended to serve <strong>Terminal</strong>s B and C during the<br />
construction of the New <strong>Terminal</strong> based on the current peak demand on <strong>Terminal</strong>s<br />
B and C equal to 5,340 gpm. In addition, two 16-inch lines are recommended to<br />
serve the proposed New <strong>Terminal</strong> based on an estimated peak demand equal to<br />
7,560 gpm.<br />
2.6.4 EXPAND EXISTING FUEL FARM<br />
The KCI Fuel Farm is currently adequate with the estimated net reserve being<br />
6.1 days, based on a 222,567 GPD fuel consumption rate. Fuel reserves of less<br />
than four days create an undue risk for meeting airport fueling demands as a result<br />
of planned and/or unplanned events. To determine when reserves fall below four<br />
days, the existing Fuel Farm net days shortage was calculated for the following<br />
three growth scenarios:<br />
A. 300,000 Gallons per Day (GPD)<br />
B. 300,000 GPD + 10% = 330,000 GPD<br />
C. 300,000 + 20% = 360,000 GPD<br />
DRAFT<br />
Scenario A: (90% * 36,000 bbls * 42 gal/bbl)/300,000 GPD = 4.5 days<br />
Scenario B: (90% * 36,000 bbls * 42 gal/bbl)/330,000 GPD = 4.1 days<br />
Scenario C: (90% * 36,000 bbls * 42 gal/bbl)/360,000 GPD = 3.8 days<br />
Daily fuel consumption would need to increase 161 percent before the current fuel<br />
farm reserves would fall below four days. However, other risks, listed below,<br />
should be considered when planning fuel storage and may have a significant impact<br />
on the decision to add tanks.<br />
2.6.5 PLANNED PIPELINE SHUTDOWNS<br />
Consideration should be given to how reliable the pipeline supply is to the Airport.<br />
If deemed unreliable, fuel tanks could be added in order to maintain operations<br />
during an extended pipeline shutdown. Currently, a single six-inch pipeline<br />
provides over 90 percent of the fuel demands to the KCI Fuel Farm. So, while a<br />
single tanker offload island can supply between 1,600 and 2,000 gpm into tank<br />
storage that would not be practical to meet the demands of the fuel farm when the<br />
pipeline provides 220,000 GDP.<br />
Landrum & Brown Page 33<br />
April 2013
KANSAS CITY INTERNATIONAL AIRPORT<br />
ADVANCE TERMINAL PLANNING STUDY<br />
PROGRAM CRITERIA DOCUMENT<br />
DRAFT<br />
Regular visual inspections (fly overs) of the pipeline route are required of the<br />
pipeline owner and are necessary to determine anomalies that may have occurred<br />
along the route. Anomalies may include sink holes, flooding, and/or construction<br />
projects encroaching near, or on top of the pipeline. It is also required to launch<br />
“pigs” into the pipeline to determine and document pipe condition. It is common<br />
for pipeline owners to schedule “planned” shutdowns, typically up to five per year<br />
are scheduled with the Airport, to perform pipeline maintenance and make<br />
necessary repairs. These planned shutdowns typically do not last longer than<br />
ten hours. Shutdowns that last longer than two days will put the Fuel Farm<br />
operations at risk of not meeting fuel supply demands at KCI.<br />
2.6.6 UNPLANNED PIPELINE SHUTDOWNS<br />
An unplanned pipeline shutdown may be caused from a pump fire or severe<br />
weather incident, such as a lightning strike. Currently, none of the pumps have<br />
UVIR heat sensors to detect overheating bearings and alert operators, or to shut<br />
down the pumps. The ASTs do not have redundant high and high-high level<br />
detection and alarm. Tank suction and supply lines do have fusible link closure<br />
valves to prevent fuel from discharging out of the tank if the isolation valve seal<br />
fails.<br />
Hazard risks are very real, as experienced at Miami International Airport (MIA) on<br />
March 27, 2011, the Fuel Facility caught fire and was very disruptive to airport<br />
operations. Per News Week article, “MIAMI, March 27, 2011 (UPI) – Flight<br />
cancellations and delays at Miami International Airport will remain in place for some<br />
time due to a huge fire at its fuel depot, officials said Sunday.”<br />
DRAFT<br />
A review of the risks to the KCI fuel farm and reserves is recommended during the<br />
planning and design phase of the project. (See Exhibit X-4, Plan Fuel Storage<br />
Expansion, in Appendix X), regarding a future expansion concept to show how two<br />
8,000 bbl ASTs could be added to the existing fuel facility.<br />
2.6.7 COMMERCIAL VEHICLE STAGING AND DELIVERY LAYOUT<br />
The fuel farm is located to the north of the Airport on Brasilia Avenue and Bern<br />
Street. The fuel farm control building has a parking lot capacity for 35 vehicles.<br />
Commercial vehicles stage at the fuel farm to make deliveries. No additional<br />
commercial vehicle staging is needed.<br />
2.6.8 CONTROL VALVE VAULTS<br />
Control valve vaults will be equipped with motor-operated double block and bleed<br />
plug valves, low and high flow terminal control valves, and fuel shutoff capability.<br />
This protocol will be retained for each of the five new Control Valve Vaults installed<br />
on the airfield. The permanent valve control connectivity and power for all vault<br />
electrical equipment will be supplied from two dedicated Fuel Control Rooms at<br />
ramp level in the New <strong>Terminal</strong>.<br />
Landrum & Brown Page 34<br />
April 2013
KANSAS CITY INTERNATIONAL AIRPORT<br />
ADVANCE TERMINAL PLANNING STUDY<br />
PROGRAM CRITERIA DOCUMENT<br />
DRAFT<br />
2.6.9 EMERGENCY FUEL SHUTOFF (EFSO)<br />
Emergency fuel shutoff stations will be located in the vicinity of each aircraft gate.<br />
When activated, the EFSO station will stop the flow of fuel on that side of the New<br />
<strong>Terminal</strong>. Fuel flow shutdown will be accomplished by closing motor-operated<br />
valves in the associated control valve vault.<br />
2.6.10 FUELING PLANS<br />
For additional information about fueling, please refer to Appendix X, Fueling<br />
Exhibits lly this includes the following plans:<br />
<br />
<br />
<br />
<br />
Exhibit F-1: Fuel Site Plan<br />
Exhibit F-2: Fuel Storage Expansion Plan<br />
Exhibit F-3: Hydrant Distribution Plan – Temporary Term B&C Fueling<br />
Exhibit F-4: Hydrant Distribution Plan – Term A Fueling<br />
DRAFT<br />
Landrum & Brown Page 35<br />
April 2013
KANSAS CITY INTERNATIONAL AIRPORT<br />
ADVANCE TERMINAL PLANNING STUDY<br />
PROGRAM CRITERIA DOCUMENT<br />
DRAFT<br />
3. TERMINAL REQUIREMENTS<br />
3.1 Methodologies<br />
The existing and future capacities of the various functional components of the<br />
terminal complex were identified for the 2025 and 2030 passenger activity levels<br />
(PALs) during the KCI <strong>Advance</strong>d <strong>Terminal</strong> <strong>Planning</strong> <strong>Study</strong>. As described in<br />
Section 1.3.6, Peak Activity for Enplanements, the design day schedule of July 14,<br />
2011 was used as a starting point to determine peak hour forecast<br />
Major data inputs into the New <strong>Terminal</strong> facility requirements include annual<br />
enplanements and peak hour passengers both enplaning and deplaning, which are<br />
shown in Table 3.1-1, Peak Hour Activity Forecast. An assumption for the<br />
development of the KCI terminal facility requirements included using two types of<br />
airline operations and their associated peak hour passenger levels, “Preferential<br />
Use” and “Common Use.”<br />
Preferential Use passenger levels refer to the peak period for a specific air carrier’s<br />
operation which may actually occur in a different clock hour than the other carriers.<br />
These airline specific peak passenger demands reflect an airline’s use agreement<br />
with the Airport that provides them with the preferred use of certain terminal<br />
facilities over the other air carriers. Preferential facilities identified included ticket<br />
and check-in counters, aircraft gates and their holdrooms, baggage claim units, and<br />
operations offices.<br />
Table 3.1-1<br />
PEAK HOUR ACTIVITY FORECAST<br />
DRAFT<br />
Passenger Enplanements: 2011 2015 2020 2025 2030<br />
Annual 5,103,664 5,536,000 6,042,000 6,608,500 7,237,900<br />
Peak Month Percent of Annual 9.8% 9.8% 9.8% 9.8% 9.8%<br />
Peak Month 501,630 544,100 593,900 649,500 709,300<br />
Peak Day Percent of Peak Month 3.4% 3.4% 3.4% 3.4% 3.4%<br />
Design Day 17,100 18,600 20,300 22,200 24,100<br />
Peak Hour Percent of Design Day 11.3% 11.3% 11.3% 11.3% 11.3%<br />
Peak Hour 1,900 2,100 2,300 2,500 2,700<br />
Source:<br />
KCAD, Official Airline Guide, Landrum & Brown analysis.<br />
Common Use peak passenger levels refer to the peak passenger volumes in a given<br />
“rolling” hour, associated with a group of airlines that share certain facilities in<br />
common such as aircraft gates and their holdrooms, ticket and check-in counters,<br />
and baggage claim units. Each airlines’ business model at a particular airport<br />
station defines whether an airline falls into the category of Preferential Use or<br />
Common Use. With new emerging technologies such as Common Use Self Service<br />
(CUSS) and Common Use Passenger Processing System (CUPPS), airports are able<br />
to use space and facilities more efficiently by allowing each air carrier to share the<br />
terminal subcomponents such as check-in counters/kiosks and aircraft gates and<br />
their holdrooms with other airlines on a Common Use basis.<br />
Landrum & Brown Page 36<br />
April 2013
KANSAS CITY INTERNATIONAL AIRPORT<br />
ADVANCE TERMINAL PLANNING STUDY<br />
PROGRAM CRITERIA DOCUMENT<br />
DRAFT<br />
Since the specific future use airline agreements with KCI are expiring in 2014 and<br />
are therefore undefined for the 2025 and 2030 forecast horizons, it has been<br />
assumed that the New <strong>Terminal</strong> will be a combination of Preferential and Common<br />
Use agreements. The future terminal facility requirements included in this <strong>Study</strong><br />
assumed that the top three passenger volume airlines will decide to enter into<br />
Preferential Use agreements with the Airport while the remaining airlines will have<br />
certain facilities under a Common Use agreement with the Airport. This was<br />
considered a conservative planning approach for KCI. One of the purposes of the<br />
requirements program is to reserve sufficient areas for airside, terminal, and<br />
landside facilities while simultaneously representing a reasonable facilities<br />
requirement target for generating Rough Order of Magnitude (ROM) capital and<br />
operations costs for ensuring the New <strong>Terminal</strong>’s affordability. With this in mind, it<br />
should be mentioned that if Common Use lease agreements between all of the<br />
airlines and Airport turn out to be the norm, this could reduce the size of some<br />
facility requirements, for example check-in counters and baggage claim.<br />
Other functional area projections in the terminal facility requirements are<br />
determined by their relationship to the number and type of aircraft or the number<br />
of gates/seats serving the terminal. These areas of the terminal include airline<br />
operations space, inbound/outbound baggage operations, and secure public<br />
restrooms.<br />
The lack of consistency for the definition of the term “gate” has led to a need to<br />
standardize the definition when evaluating aircraft utilization and apron<br />
requirements. It is for this reason that the industry identified and defined the<br />
NBEG index (see Table 2.2-1, Narrowbody Equivalent Gate Index). This index<br />
converts gate requirements of diverse aircraft types such as small commuters to<br />
large widebody aircraft, to an equivalent of the apron capacity of a narrowbody<br />
aircraft gate. The amount of space or linear frontage each aircraft requires is based<br />
on the maximum wingspan of aircraft in its respective aircraft group.<br />
DRAFT<br />
Another method used for terminal facility comparisons is Equivalent Aircraft (EQA)<br />
Index. This is a way to look at the capacity of a gate. A good example would be<br />
ramp equipment (bag carts/containers) required for aircraft arrivals and departures<br />
at the gate. With EQA, each gate is converted based on the seating capacity of the<br />
aircraft that can be accommodated. Originally developed in the 1970’s, EQA was a<br />
technique for sizing terminal facilities when the majority of the aircraft in service<br />
had 80 to 110 seats, and some larger narrowbody aircraft had up to 150 seats.<br />
With new larger fleet mixes of regional and jet aircraft, the basis for EQA was<br />
revised. The EQA is still that of an ADG III narrowbody; however, this aircraft<br />
category now typically has seats in the range of 145 to 150. The new EQA of<br />
1.0 that was established uses 145 seats as the baseline denominator. While<br />
smaller aircraft may use the gate, the EQA capacity is based on the largest<br />
aircraft/seating typically in use. Table 3.1-2, Equivalent Aircraft (EQA) Index,<br />
summarizes the EQA of each aircraft group.<br />
Landrum & Brown Page 37<br />
April 2013
KANSAS CITY INTERNATIONAL AIRPORT<br />
ADVANCE TERMINAL PLANNING STUDY<br />
PROGRAM CRITERIA DOCUMENT<br />
DRAFT<br />
Table 3.1-2<br />
EQUIVALENT AIRCRAFT (EQA) INDEX<br />
FAA TAXIWAY DESIGN<br />
GROUP<br />
TYPICAL<br />
SEATS<br />
TYPICAL AIRCRAFT<br />
EQA<br />
INDEX<br />
I Small Commuter 25 Cessna 0.2<br />
II Medium Commuter 50 SF340/CRJ 0.4<br />
III Large Commuter 50 ATR/Dash8 0.4<br />
III Narrowbody 145 A320/B737/MD-80 1.0<br />
IIIa B757 185 B757 1.3<br />
IV Widebody 280 DC-10/MD-11/B767/B787 1.9<br />
V Jumbo 400 B747/A330,340/B777 2.8<br />
VI NLA 550 A380 3.8<br />
Source:<br />
The Apron & <strong>Terminal</strong> Building <strong>Planning</strong> Manual for US DOT, FAA by The Ralph M. Parsons Company:<br />
July 1975 and updated values based on Hirsh & Associates data.<br />
<strong>Program</strong>matic spatial requirements are also based on a particular LOS.<br />
This analysis represents a LOS C criteria or greater which is considered a good level<br />
of service with a stable passenger flow, acceptable delays, and good levels of<br />
comfort during peak periods. The LOS methodology identifies a range of values or<br />
the ability of capacity to meet demand.<br />
This type of programmatic approach to sizing facility areas is commonly used as the<br />
first step during the conceptual planning and can serve as a baseline program for<br />
the preliminary design of terminal projects. As the process proceeds through<br />
design areas such as holdrooms, circulation areas, concessions, and other various<br />
specific use areas, space-based requirements change as a result of professional<br />
judgment, physical configuration, and cost issues. Additionally, during architectural<br />
design/development the specific operating requirements of each individual airline is<br />
taken into account which further refines the overall size of the terminal. The facility<br />
requirements in this <strong>Study</strong> is what is needed to support the peak hour passenger<br />
activity levels and operating assumptions and as such does not represent any<br />
specific terminal configuration or aircraft gating plan. For this reason the actual<br />
physical design of the New <strong>Terminal</strong> may have a square footage total above or<br />
below the baseline conceptual facility requirements represented in this <strong>Study</strong>.<br />
DRAFT<br />
Landrum & Brown Page 38<br />
April 2013
KANSAS CITY INTERNATIONAL AIRPORT<br />
ADVANCE TERMINAL PLANNING STUDY<br />
PROGRAM CRITERIA DOCUMENT<br />
DRAFT<br />
3.2 <strong>Terminal</strong> Facility Requirements<br />
The New <strong>Terminal</strong> facility requirements are organized into seven general categories<br />
with various subcomponents in the proposed facilities program which is<br />
summarized in Table 3.2-1, Existing Facility Inventory and Future <strong>Terminal</strong><br />
Requirements.<br />
1. General<br />
o<br />
o<br />
Airport Statistics (Annual Enplanements, Peak Hour Enplanements)<br />
Gates<br />
2. Airline Space<br />
o<br />
o<br />
o<br />
Domestic/International Airline Space (Ticketing, Baggage Claim, etc.)<br />
Other Airline Space (Operations, Checked Bag Screening, etc.)<br />
Departure Lounges<br />
3. Concessions Space<br />
o<br />
o<br />
Non-Secure Concessions Space<br />
Secure Concessions Space<br />
4. Customs and Border Protection (CBP)<br />
5. Public Space<br />
o<br />
o<br />
o<br />
o<br />
Security Screening<br />
Circulation (Secure, Non-Secure, General)<br />
Restrooms<br />
Other Space<br />
6. Non-Public Space<br />
o<br />
o<br />
o<br />
Non-Airline Tennant Space (Airport Admin, Other Tenants)<br />
Other Space (Misc.)<br />
<strong>Terminal</strong> Functions (Maintenance/Janitorial/Storage,<br />
Mechanical/Electrical/Plumbing (MEP), Structure/Non-Net)<br />
7. Overall Summary<br />
DRAFT<br />
The Table 3.2-1 data compares existing terminal areas based on the 2012<br />
utilization of existing terminal facilities from KCI lease exhibits to the future<br />
terminal facility requirements for 2025 and 2030. The table provides this<br />
comparison in order to identify any deficiencies in the existing facilities relative to<br />
meeting future demands.<br />
Landrum & Brown Page 39<br />
April 2013
KANSAS CITY INTERNATIONAL AIRPORT PROGRAM CRITERIA DOCUMENT<br />
ADVANCE TERMINAL PLANNING STUDY DRAFT<br />
Landrum & Brown Page 40<br />
April 2013<br />
Table 3.2-1<br />
EXISTING FACILITY INVENTORY AND FUTURE TERMINAL REQUIREMENTS<br />
MCI Airport<br />
<strong>Terminal</strong> <strong>Program</strong><br />
General<br />
Units<br />
2012 Existing<br />
Facilities<br />
2025<br />
Recommended<br />
Facilities<br />
2030<br />
Recommended<br />
Facilities<br />
General 1<br />
Overall Airport Statistics<br />
Annual Passengers 10,207,328 13,217,000 14,475,800<br />
Annual Enplanements 5,103,664 6,608,500 7,237,900<br />
Annual Domestic Enplanements 5,059,794 - -<br />
Annual International Enplanements 43,870 72,000 85,800<br />
O&D Passengers 4,646,770 6,017,300 6,590,700<br />
Connecting Passengers 456,894 591,200 647,200<br />
Peak Hour Passenger Statistics<br />
Peak Hour Enplaned - Domestic 2,159 2,688 2,944<br />
Peak Hour Enplaned - International 125 235 257<br />
Total Peak Hour Enplaned 2 2,159 2,688 2,944<br />
Peak Hour Deplaned - Domestic 1,619 2,293 2,511<br />
Peak Hour Deplaned - International - - -<br />
Total Peak Hour Deplaned 2 1,619 2,293 2,511<br />
Total Peak Hour 2 3,283 4,282 4,690<br />
Gates/Positions<br />
Aircraft Gates/Positions (International in parenthesis) Excl + ComUse Exclusive Use Exclusive Use<br />
Small Commuter (Cessna) - - -<br />
Medium Commuter (CRJ/ERJ/BE1) - 4 4<br />
Large Commuter (CR7/E70) - - -<br />
Narrowbody (B737/A320) 16 33 37<br />
B-757 12 - -<br />
Widebody (B767) 2 - -<br />
Jumbo (B777/A340/B747) - - -<br />
NLA (A380) - - -<br />
Total Gates: 62 37 41<br />
1 1 Annual Passenger numbers are taken from the Demand Scenario Summary.<br />
DRAFT<br />
Total EQA 3 : 69.8 34.6 38.6<br />
Total NBEG 4 : 64.8 35.8 39.8<br />
Total Positions: 62 37 41<br />
2 2 The total peak hour numbers represent the total enplanement/deplanements peak hour and not the sum of the components as each may occur in separate hours.<br />
3 3 EQA (Equivalent Aircraft) normalizes gate based on seating capacity of accommodated aircraft.<br />
4 4 NBEG (Narrow Body Equivalent Gate): Used to normalize the apron frontage demand and capacity to that of a typical narrowbody aircraft gate.
KANSAS CITY INTERNATIONAL AIRPORT PROGRAM CRITERIA DOCUMENT<br />
ADVANCE TERMINAL PLANNING STUDY DRAFT<br />
Landrum & Brown Page 41<br />
April 2013<br />
Table 3.2-1 (continued)<br />
EXISTING FACILITY INVENTORY AND FUTURE TERMINAL REQUIREMENTS<br />
MCI Airport<br />
<strong>Terminal</strong> <strong>Program</strong><br />
Airline Space<br />
Units<br />
2012 Existing<br />
Facilities<br />
2025<br />
Recommended<br />
Facilities<br />
2030<br />
Recommended<br />
Facilities<br />
Domestic Airline Space<br />
Ticket Counter Exclusive Use Excl+ComUse Use Excl+ComUse Use<br />
Linear Counter Check-in Positions (Kiosk) pos 142 57(64) 65(72)<br />
Total Check-in Locations (Kiosk) pos 169 124(128) 138(144)<br />
Total Linear Position Length lf 650 400 430<br />
Number of Unassigned Check-in Positions pos - - -<br />
Total Unassigned Position Length lf - - -<br />
Counter Area (Includes any curb check) sf 10,210 4,200 4,600<br />
Ticketing Queue (including any free standing kiosks) sf 12,844 11,700 12,700<br />
Curbcheck Positions pos 0 6 8<br />
Airline Ticket Offices sf 12,978 12,000 12,900<br />
Baggage Claim Common Use Common Use Common Use<br />
Claim Devices units 14 8 8<br />
Linear Frontage Required lf 680 980 1,080<br />
Linear Frontage <strong>Program</strong>med lf 1,403 1,280 1,280<br />
Baggage Claim Hall (Includes Device, Queues & Circulation w/in Positive Claim area ) sf 29,092 48,600 48,600<br />
Baggage Services sf 9,600 3,900 4,300<br />
Airline Clubs/VIP Lounges sf 5,742 2,000 2,000<br />
SubTotal: 80,466 82,400 85,100<br />
International Airline Space<br />
Ticket Counter<br />
Linear Counter Check-in Positions (Kiosk) pos 0 8(0) 12(0)<br />
Total Check-in Locations (Kiosk) pos 0 8(0) 12(0)<br />
Total Linear Position Length lf 0 40 60<br />
Counter Area (Includes any curb check) sf - 400 600<br />
Ticketing Queue (including any free standing kiosks) sf - 1,000 1,500<br />
Curbcheck Positions pos 0 0 0<br />
Airline Ticket Offices sf - 1,200 1,800<br />
Airline Clubs/VIP Lounges sf - 2,000 2,000<br />
SubTotal: - 4,600 5,900<br />
Other Airline Space<br />
Outbound Bag Make-Up 4 sf 65,483 69,200 81,100<br />
Inbound Bag Delivery sf 36,464 19,200 19,200<br />
Baggage Train Circulation sf - 13,800 15,000<br />
Checked Baggage Screening (TSA Space) 5 sf 20,725 16,400 16,400<br />
Level 1 Inspection Units (EDS) 6 no 1 3 3<br />
Airline Operations sf 100,338 93,400 104,200<br />
Other Airline Offices/Systems and Support sf 19,285 14,000 15,600<br />
SubTotal: 242,295 226,000 251,500<br />
Departure Lounges<br />
DRAFT<br />
Gates/Positions Excl + ComUse Exclusive Use Exclusive Use<br />
Small Regional (Cessna/Metro) sf - - -<br />
Medium Regional (BE1/CRJ,CR7,9/ERJ/SF340) sf 18,447 3,600 3,600<br />
Large Regional (Q400/E170,175,190) sf - - -<br />
Narrowbody (A320/B737w) sf 98,535 72,600 81,400<br />
B-757(winglets) sf 15,636 - -<br />
Widebody (B767/MD11) sf 6,800 - -<br />
Jumbo (B747,787,777/A330,340) sf - - -<br />
Super Jumbo (A380) sf - - -<br />
SubTotal: 139,418 76,200 85,000
KANSAS CITY INTERNATIONAL AIRPORT PROGRAM CRITERIA DOCUMENT<br />
ADVANCE TERMINAL PLANNING STUDY DRAFT<br />
Landrum & Brown Page 42<br />
April 2013<br />
Table 3.2-1 (continued)<br />
EXISTING FACILITY INVENTORY AND FUTURE TERMINAL REQUIREMENTS<br />
MCI Airport<br />
<strong>Terminal</strong> <strong>Program</strong><br />
US Customs & Border Protection Services (CBP)<br />
Concessions Space<br />
DRAFT<br />
2025<br />
2030<br />
2012 Existing<br />
Recommended Recommended<br />
Facilities<br />
Units<br />
Facilities<br />
Facilities<br />
Non-Secure Concessions Space<br />
Rental Car<br />
Number of Counters pos 5 6 7<br />
Counter Area/Offices sf - 2,400 2,800<br />
Queue sf - 1,800 2,100<br />
Non-Secure Concessions sf 25,780 10,600 11,700<br />
Non-Secure Storage sf 8,811 2,700 2,900<br />
SubTotal: 34,591 17,500 19,500<br />
Secure Concessions Space<br />
Secure Concessions sf 18,157 67,577 67,577<br />
Secure Storage sf 5,722 16,193 16,193<br />
SubTotal: 23,879 83,770 83,770<br />
Primary Processing<br />
Units<br />
Primary Inspection Booths (Double Counters) units 3 0 4<br />
Area Primary Inspection Booths sf 837 - 1,500<br />
Primary Inspection Queue sf 1,186 - 3,800<br />
Primary Inspection Support sf 2,318 700 700<br />
SubTotal: 4,341 700 6,000<br />
Baggage Claim<br />
Claim Devices Required units 1 0 1<br />
Linear Frontage Required lf 166 0 450<br />
Linear Frontage <strong>Program</strong>med lf 0 0 300<br />
Baggage Claim Hall sf 5,182 - 11,400<br />
SubTotal: 5,182 - 11,400<br />
Secondary Processing<br />
Passport Control Check Positions pos 0 1 1<br />
Area Passport Control Check sf - 200 200<br />
Area Secondary Waiting sf - 400 800<br />
Exam Podiums and Baggage Belts (2 belts per unit) units 2 0 0<br />
Area Secondary Inspection sf 1,146 - -<br />
Baggage X-Ray Processing (1 X-Ray per unit) units 0 1 1<br />
Area X-Ray Inspection sf . 1,500 1,500<br />
Secondary Inspection Support sf 1,075 1,100 1,100<br />
SubTotal: 2,221 3,200 3,600<br />
Support Space<br />
CBP Administration sf 3,554 700 800<br />
CBP Administration Support sf 2,016 600 600<br />
SubTotal: 5,570 1,300 1,400<br />
Other Space<br />
Sterile Corridor Circulation sf 851 100 3,000<br />
In-Transit/Sterile Holding Areas sf - - -<br />
Public Sterile Restrooms sf 727 - 1,000<br />
General Circulation sf 319 100 2,600<br />
Greeter Lobby<br />
Greeter Waiting Area sf 697 - 600<br />
Other sf - - -<br />
Baggage Recheck<br />
Number Recheck Positions pos 0 0 0<br />
Area Recheck Positions sf - - -<br />
Queue Baggage Recheck sf - - -<br />
SubTotal: 2,594 200 7,200
KANSAS CITY INTERNATIONAL AIRPORT PROGRAM CRITERIA DOCUMENT<br />
ADVANCE TERMINAL PLANNING STUDY DRAFT<br />
Landrum & Brown Page 43<br />
April 2013<br />
Table 3.2-1 (continued)<br />
EXISTING FACILITY INVENTORY AND FUTURE TERMINAL REQUIREMENTS<br />
MCI Airport<br />
<strong>Terminal</strong> <strong>Program</strong><br />
Public Space<br />
Units<br />
2012 Existing<br />
Facilities<br />
2025<br />
Recommended<br />
Facilities<br />
2030<br />
Recommended<br />
Facilities<br />
Security Screening Checkpoint (SSCP)<br />
Number of Lanes pos 23 14 16<br />
Queuing Area sf 2,573 6,300 7,600<br />
Checkpoint Screening Area sf 24,364 24,000 27,100<br />
TSA Offices sf 5,463 3,000 3,500<br />
SubTotal: 32,400 33,300 38,200<br />
Circulation<br />
Ticket Lobby Circulation sf - 8,800 9,500<br />
Baggage Claim Circulation sf - 8,500 8,500<br />
Secure Circulation (Incl. Fire/Service Stairs to Apron) sf - 96,700 107,500<br />
General Public Circulation (Includes Vestibules, Vert Circ, Corridors) sf 174,378 64,300 69,900<br />
Public Seating sf 16,129 2,000 2,200<br />
Domestic Meeter/Greeter Lobby sf 7,000 10,000 10,900<br />
Transportation (Shuttle Service) & Hotel Courtesy Phones sf 1,144 700 700<br />
SubTotal: 198,651 191,000 209,200<br />
Restrooms<br />
Public Restrooms - Secure sf 5,040 5,600 7,000<br />
Public Restrooms - Non-Secure sf 17,977 10,900 12,000<br />
SubTotal: 23,017 16,500 19,000<br />
Other Space<br />
Misc Tenant<br />
American Credit Union (AAFCU), Central Carts, Chapel, USO, USPS sf 8,900 8,900<br />
Smoking Lounge sf 1,500 1,500<br />
Other (Displays, Information Counters, Visitors Commission etc) sf 702 700 700<br />
SubTotal: 702 11,100 11,100<br />
DRAFT<br />
Non-Public Space<br />
Non-Airline Tenant Space<br />
Airport Administration<br />
Offices/Support (City) sf 29,326 5,100 5,100<br />
Airport Police (Includes Locker Facilities) sf 413 2,000 2,000<br />
Other Tenants<br />
Misc Tenant sf 3,093 6,600 6,600<br />
SubTotal: 32,832 13,700 13,700<br />
Other Space<br />
Non-Public Restrooms / Lockers sf 22,197 2,700 3,000<br />
Non-Public Circulation sf 92,993 27,100 29,900<br />
Other sf 2,642 - -<br />
SubTotal: 117,832 29,800 32,900<br />
<strong>Terminal</strong> Function<br />
Maintenance/Janitorial/Storage/Shops sf 16,826 7,500 8,500<br />
Mechanical/Electrical/Telephone/Plumbing sf 101,710 91,900 103,300<br />
Building Systems (Structure/Non-net/Void) sf 23,533 21,800 24,600<br />
Exterior - Other (ie Public Gardens, etc) sf - - -<br />
SubTotal: 142,069 121,200 136,400
KANSAS CITY INTERNATIONAL AIRPORT PROGRAM CRITERIA DOCUMENT<br />
ADVANCE TERMINAL PLANNING STUDY DRAFT<br />
Landrum & Brown Page 44<br />
April 2013<br />
Table 3.2-1 (continued)<br />
EXISTING FACILITY INVENTORY AND FUTURE TERMINAL REQUIREMENTS<br />
MCI Airport<br />
<strong>Terminal</strong> <strong>Program</strong><br />
Summary<br />
2008-2028<br />
Source: Landrum & Brown<br />
Units<br />
2012 Existing<br />
Facilities<br />
2025<br />
Recommended<br />
Facilities<br />
2030<br />
Recommended<br />
Facilities<br />
General<br />
Annual Enplanements 5,103,664 6,608,500 7,237,900<br />
Annual O&D Enplanements (%) 4,646,770 (91.%) 6,017,300 (91.1%) 6,590,700 (91.1%)<br />
Annual Connecting Enplanements (%) 456,894 (9.%) 591,200 (8.9%) 647,200 (8.9%)<br />
Peak Hour Enplaned Domestic 2,159 2,688 2,944<br />
Peak Hour Enplaned International 125 235 257<br />
Peak Hour Deplaned Domestic 1,619 2,293 2,511<br />
Peak Hour Deplaned International - - -<br />
Gates/Positions 62 37 41<br />
Airline Space<br />
Domestic Airline Space sf 80,466 82,400 85,100<br />
International Airline Space sf - 4,600 5,900<br />
Other Airline Space sf 242,295 226,000 251,500<br />
Departure Lounges sf 139,418 76,200 85,000<br />
SubTotal: 462,179 389,200 427,500<br />
Concessions<br />
Non-Secure Concessions Space sf 42,322 17,500 19,500<br />
Secure Concessions Space sf 23,879 83,770 83,770<br />
SubTotal: 66,201 101,270 103,270<br />
US Customs & Border Protection Services 7<br />
Design Hour Passengers pax 45 - 257<br />
Primary Processing sf 4,341 700 6,000<br />
Baggage Claim sf 5,182 - 11,400<br />
Secondary Processing sf 2,221 3,200 3,600<br />
Support Space sf 5,570 1,300 1,400<br />
Other Space sf 2,594 200 7,200<br />
SubTotal: 19,908 5,400 29,600<br />
Public Space<br />
Security sf 32,400 33,300 38,200<br />
Circulation sf 198,651 191,000 209,200<br />
Restrooms sf 23,017 16,500 19,000<br />
Other Space sf 702 11,100 11,100<br />
SubTotal: 254,770 251,900 277,500<br />
Non-Public Space<br />
Non-Airline Tenant Space sf 32,832 13,700 13,700<br />
Other Space sf 117,832 29,800 32,900<br />
<strong>Terminal</strong> Functions sf 142,069 121,200 136,400<br />
SubTotal: 292,733 164,700 183,000<br />
Total<br />
DRAFT<br />
Total Functional <strong>Terminal</strong> Area: 953,722 791,270 884,470<br />
Total Gross <strong>Terminal</strong> Area: 1,095,791 912,470 1,020,870
KANSAS CITY NEW TERMINAL STUDY<br />
ADVANCE TERMINAL PLANNING STUDY<br />
PROGRAM CRITERIA DOCUMENT<br />
DRAFT<br />
3.2.3 TERMINAL AREA REQUIREMENTS<br />
The overall passenger enplanements were forecasted to grow at an annual average<br />
rate of 1.9 percent per year from approximately 5.1 million enplanements in 2011<br />
to 7.2 million enplanements in 2030. Peak hour enplanements are forecasted to<br />
grow from 1,900 passengers in 2011 to 2,900 passengers by 2030.<br />
As mentioned in Section 2.2.2, Current Conditions, of the 62 available gates<br />
(66 positions) KCI is currently operating from 30 gates as of 2012 and is forecasted<br />
to grow to 41 gates by 2030. Widebody aircraft are not predicted to operate<br />
commercial passenger service over the forecast period with limited B757<br />
operations, less than one percent, in 2030. However, one gate is held throughout<br />
the planning horizon for future operating flexibility.<br />
The narrowbody aircraft was used as the design aircraft and is expected to account<br />
for the predominant share of passenger operations maintaining 56 percent in 2012<br />
and 58 percent by 2030. Regional jets are expected to continue to account for a<br />
steady share of the passenger operations decreasing slightly from 44 percent in<br />
2011 to 42 percent by 2030. Large regional jets such as the 100-seat Embraer are<br />
assumed to potentially replace, or offer incremental capacity for the current aging<br />
100-seat aircraft such as the B717 and DC9 fleets.<br />
3.2.3.1 Airline Space<br />
The need for airline service represents a major portion of the passenger processing<br />
functions of a terminal. It contains all the exclusive areas typically required and<br />
leased by the airline tenants to support their operations. These functions include<br />
ticketing, baggage claim, airline operations and support, and departure lounges<br />
(holdrooms).<br />
DRAFT<br />
Airport tenant interviews were held with various station managers during the 2008<br />
Master Plan. These discussions along with on-site observations during this <strong>Study</strong><br />
were used to determine the adequacy of the various airline functions for conceptual<br />
planning purposes. It is anticipated that as the New <strong>Terminal</strong> concept moves into<br />
the subsequent architectural design/development phase, each individual airline will<br />
be consulted relative to their individual operational requirements. The airline<br />
requirements for the New <strong>Terminal</strong> that represent a conceptual baseline for<br />
planning purposes are discussed in the following paragraphs.<br />
Domestic/International Airline Space<br />
Airline Ticket Counters refers to the area occupied by the ticket counter, ticket<br />
agents, and the ticket counter baggage belt. It is typically assumed as an exclusive<br />
use operation for most U.S. airlines. This airline function is based on the peak hour<br />
origin and destination (O&D) enplaning (departing) passengers, their associated<br />
early arrival profiles, acceptable service times associated with the check-in process,<br />
and the percentage of the originating passengers that actually check-in at the<br />
terminal versus going directly to the gate or checking in at any offsite location.<br />
Industry accepted planning factors were used in this baseline analysis.<br />
Landrum & Brown Page 45<br />
April 2013
KANSAS CITY NEW TERMINAL STUDY<br />
ADVANCE TERMINAL PLANNING STUDY<br />
PROGRAM CRITERIA DOCUMENT<br />
DRAFT<br />
The typical airline ticket counter has evolved over the past years to include both<br />
standard agent positions and the self-service electronic kiosk. These kiosks can<br />
either be converted from in-line counter positions, be free standing in the ticketing<br />
queue area, or be a combination of both. Each airline typically has their own<br />
arrangement within the ticketing area, which has reduced the need for some in-line<br />
counter positions but has increased the amount of queue space needed in the ticket<br />
lobby. The free standing kiosk is typically referred to as a “Two-Step” process<br />
where the passenger checks in at the kiosk and the traditional in-line counter<br />
position becomes the bag drop and additional assistance location.<br />
Based on a review of the lease drawings and discussions with the Airport, the<br />
existing terminals have a combined total of approximately 169 possible check-in<br />
locations for passengers made up of 142 traditional staffed counter positions,<br />
30 self-service counters or kiosks, and 16 free-standing kiosks. However, with<br />
FAA’s current 100 percent baggage screening requirements, this number is slightly<br />
less than what is potentially available with some Explosive Detection Screening<br />
(EDS) machines occupying the space of potential counter positions and queue area.<br />
The airlines currently lease around 78 traditional staffed in-line counter positions.<br />
The 27 in-line kiosks mentioned above were converted from 24 staffed positions for<br />
a total of 105 linear counter positions. There are also an additional 16<br />
free-standing kiosks which have various configurations in the ticketing queues for a<br />
total of 121 equivalent check-in locations. In order to plan for future “equivalent<br />
positions,” the existing ratio of 1.2 has been retained. This ratio is calculated by<br />
dividing 121 possible check-in locations by 105 linear positions.<br />
International check-in functions are included in these domestic totals. Current air<br />
traffic at KCI includes flights by Air Canada which are handled by United’s check-in<br />
area, Frontier, and charters.<br />
DRAFT<br />
The existing ticket counters at KCI vary in length and configuration based on<br />
individual airline preferences. Generally they consist of a 6.5-foot double counter<br />
plus a shared 30-inch bag drop for an average of 4.5 feet per ticket agent position<br />
compared to a domestic carrier average of 4.25 feet per agent. A planning factor of<br />
5.5 feet has been assumed for future requirements which also accounts for counter<br />
breaks for agent access.<br />
The current 142 traditional linear check-in counter positions between the three<br />
terminals at KCI account for a total length of 650 feet. The future requirement of<br />
430 linear feet is based on an exclusive and common use of 65 standard in-line<br />
counter positions which were calculated from the individual airline’s peak hour<br />
requirements. Equivalent positions would translate to 72 check-in locations of<br />
which eight would occupy ticket queue space based on the current ratio.<br />
Landrum & Brown Page 46<br />
April 2013
KANSAS CITY NEW TERMINAL STUDY<br />
ADVANCE TERMINAL PLANNING STUDY<br />
PROGRAM CRITERIA DOCUMENT<br />
DRAFT<br />
The existing ticket counter area measures approximately 10,210 square feet, of<br />
which 4,690 square feet is unoccupied. Most of the existing counter areas measure<br />
between ten and 16 feet from ticket counter face to the back wall and are<br />
dependent on each airline’s operational setup. Based on an industry standard<br />
depth of ten feet from the face of the ticket counters to the back wall behind the<br />
counters, 4,600 square feet would be needed by 2030.<br />
The ticketing queue is a function of the counter frontage and the acceptable<br />
planning depth for passenger queuing in front of the counter positions.<br />
The existing depth for all three terminals at KCI varies based on each airlines’<br />
ticketing configuration but is generally 21 feet deep on average. A future depth of<br />
30 feet has been used to account for required queue space needed for the area<br />
taken up by any free standing kiosks and their passengers. The existing area<br />
measures 12,840 square feet and accommodates the recommended existing facility<br />
requirement of 12,800 square feet. By 2030 an area of 12,700 square feet will be<br />
needed to adequately handle the 65 linear counter positions or 72 equivalent<br />
check-in locations.<br />
The Airline Ticket Office (ATO) refers to the office area leased to the airlines and is<br />
generally located directly behind or adjacent to the ticket counter to provide<br />
support functions for the ticket agents and other airline administrative space.<br />
However, this space can be located in other terminal areas, as necessary.<br />
Typically, the ATO space is 25 to 30 feet deep along the full length of the ticket<br />
counters. At KCI, all of the airline ATO offices are located adjacent to the counters<br />
or up on the mezzanine levels. The existing offices are located in 12,978 square<br />
feet with most of this space accounted for on the mezzanine levels of the terminals.<br />
However, the offices located adjacent to the ticket counters are generally too small.<br />
The future ATO requirement of 12,900 square feet is based on a depth of 30 feet<br />
along the 430 linear feet of required ticket counter.<br />
DRAFT<br />
The Baggage Claim (Domestic) area is occupied by the baggage claim devices and<br />
the queuing area for active claiming. Baggage claim requirements are primarily<br />
based on the percentage of deplaned terminating passengers in a peak 20-minute<br />
period, the percentage of those passengers checking bags, and to a lesser extent<br />
the number of bags checked. Because most passengers arrive at the claim area<br />
before their baggage arrives there should be sufficient claim frontage to<br />
accommodate the concentration of these peak passengers. This analysis focused<br />
on using the existing preferential use claim areas for future requirements.<br />
The existing claim devices range in size from 85 linear feet of frontage to 150 feet<br />
with an overall length for all devices of 1,403 feet. Analysis shows that American<br />
and Northwest’s small claim devices of less than 100 linear feet are generally too<br />
small for their current demand. The future recommended size of claim devices is<br />
150 linear feet, which would adequately handle passengers from a typical<br />
narrowbody aircraft with multiple flights by smaller regional aircraft. The existing<br />
recommended claim frontage was 1,400 linear feet, or 12 devices, suggesting that<br />
the existing planning factor of 0.5 linear feet per peak hour terminating passenger<br />
is adequate to handle the current activity at KCI. However, given the larger<br />
suggested devices, the future planning factor has been increased to a more typical<br />
Landrum & Brown Page 47<br />
April 2013
KANSAS CITY NEW TERMINAL STUDY<br />
ADVANCE TERMINAL PLANNING STUDY<br />
PROGRAM CRITERIA DOCUMENT<br />
DRAFT<br />
1.5 linear-foot per peak hour terminating passenger. This results in a need of<br />
1,080 linear feet by 2030. The total provided claim length of 1,280 linear feet<br />
results in eight claim devices.<br />
The recommended size of the baggage claim hall area is 35 square feet per linear<br />
foot of claim area to provide adequate queuing and circulation space. The existing<br />
claim area of approximately 29,092 square feet is undersized to meet the<br />
suggested 42,600-square foot requirement. This is primarily due to the shallow<br />
claim retrieval areas which often measure between 3.5 feet and 14 feet.<br />
The existing general circulation area often serves as the retrieval and circulation<br />
area for most of these devices. The future demand will require 48,600 square feet<br />
of claim hall or approximately 16 square feet per peak hour deplaned terminating<br />
passenger.<br />
Baggage Services includes the area of baggage service offices which are leased to<br />
the airlines. Typically these offices are only required by airlines with sufficient<br />
activity to warrant staffing. Currently, there are 11 offices totaling 9,600 square<br />
feet that include 3,911 square feet in four unassigned offices resulting in a planning<br />
factor of 720 square feet per leased office. The future planning factor of<br />
one-square foot per design hour passenger results in a need of 4,300 square feet<br />
by 2030.<br />
Presently there are no Airline Clubs/V.I.P. Lounges operating at KCI. Such facilities<br />
are typically, but not exclusively provided by the dominant carrier at an airport.<br />
These facilities are generally determined by each airline’s criteria for level of<br />
passenger activity and the type of markets being served by the airport.<br />
The current planning ratio of 2,000 square feet per club was used to determine the<br />
future 2030 requirement of 2,000 square feet.<br />
Other Airline Space<br />
DRAFT<br />
The Outbound Bag Make-Up area is directly behind the airline offices and is used for<br />
the accumulation, storage, and make-up of outbound baggage from the ticket<br />
counter and curbside check-in areas. This space typically consists of the make-up<br />
units, baggage train circulation and maneuvering lanes, the tug/cart staging areas,<br />
and in some cases, the Transportation Security Administration (TSA) baggage<br />
screening EDS devices. Most of the airlines at KCI reported having adequate<br />
operation space except for U.S. Airways and Southwest Airlines that reported<br />
having inadequate space during the 2008 MP. A method for providing a consistent<br />
basis for baggage system planning involves using the EQA as previously described<br />
in Section 3.1, Methodologies. The existing leased preferential make-up areas<br />
totaled 70,740 square feet for a planning ratio of 2,000 square feet per EQA. Using<br />
this existing ratio, the future 2030 demand would require 81,100 square feet of<br />
space.<br />
The Inbound Bag Delivery area is used to feed bags to the baggage claim devices.<br />
The existing area measures 36,464 square feet and most airlines reported this as<br />
adequate although, as with their outbound area, US Airways and Southwest Airlines<br />
reported a shortage of space as did American Airlines during the 2008 MP.<br />
Landrum & Brown Page 48<br />
April 2013
KANSAS CITY NEW TERMINAL STUDY<br />
ADVANCE TERMINAL PLANNING STUDY<br />
PROGRAM CRITERIA DOCUMENT<br />
DRAFT<br />
This existing area of 36,464 square feet resulted in a planning factor of 22 square<br />
feet per peak hour deplaned terminating passenger compared to an industry<br />
standard of eight to ten square feet, which suggests the existing area is adequate<br />
to handle the current demand. Using a more typical 8.4 square feet, the 2030<br />
demand would need 19,200 square feet of area.<br />
Currently, Checked Baggage Screening for possible explosives is being<br />
accomplished via nine stand-alone units on the passenger service level in the<br />
ticketing area. Future program requirements assumed a centralized screening area<br />
that would operate on an in-line system integrated into the make-up system. EDS<br />
requirements were based on 63 percent of the 2007 schedule departing passengers<br />
in the peak 30 minutes of the peak hour. A processing rate of 400 bags per hour<br />
per EDS unit with 60 percent of the originating passengers checking bags and<br />
1.5 bags per passenger has been assumed. The 2030 demand year results in a<br />
need for 16,400 square feet which includes the area needed for primary and<br />
secondary units, conveyors, offices, and circulation.<br />
The Airline Operations area is used by the airlines for their everyday operations<br />
which includes the apron level support spaces for aircraft crew, aircraft servicing,<br />
and other related support facilities. A program area is typically based on the<br />
number of gates determined by using an EQA related methodology. The demand<br />
for operations space is a function of the size and number of aircraft being served<br />
based on individual airline operating policies.<br />
There are currently 100,300 square feet of apron level operations, of which<br />
approximately 32,740 square feet is leased to the airlines. Most of the airlines<br />
reported having adequate operations space with the exception of Southwest and US<br />
Airways during the 2008 MP. The current leased square foot per EQA ratio is 950<br />
which is at the lower range for spoke airports. The existing available ratio is a<br />
more reasonable 2,700 square feet per EQA and this has been used for future<br />
planning requirements. The 2030 demand level requires 104,200 square feet of<br />
space.<br />
Other Airline Offices/Systems and Support areas, such as centralized ground power,<br />
preconditioned air, computer rooms, etc. have been included in this category.<br />
A typical allowance of fifteen percent of the airline operations space has been used<br />
and should be considered as supplemental to the overall mechanical and electrical<br />
systems area in the program. The future 2030 demand level requires<br />
15,600 square feet.<br />
Departure Lounges (Holdrooms)<br />
DRAFT<br />
In evaluating the capacity of the holdrooms, physical location and proximity to the<br />
gate are important factors to consider. The available holdroom space needs to be<br />
relatively close to the gate. Multiple gates with adjacent holdrooms typically have<br />
additional boarding space capacity resulting from sharing holdroom seating<br />
between the gates. These factors were taken into consideration when evaluating<br />
the future requirements.<br />
Landrum & Brown Page 49<br />
April 2013
KANSAS CITY NEW TERMINAL STUDY<br />
ADVANCE TERMINAL PLANNING STUDY<br />
PROGRAM CRITERIA DOCUMENT<br />
DRAFT<br />
Holdrooms are based on the mix of gates and the average seating capacity of each<br />
aircraft design category. These areas generally consist of the passenger seating<br />
area, the airline’s podium and associated queue space, the loading bridge egress<br />
corridor, circulation, and any additional square footage allowances for areas such as<br />
telephone banks, child play areas, etc.<br />
When sizing these areas the amount of seating area is typically based on an<br />
industry standard of 80 percent of the aircraft seating capacity. Of this percentage<br />
a range from 50 to 80 percent is allocated to the number of passengers seated with<br />
the remaining 20 to 50 percent standing. At KCI, a typical planning ratio of<br />
80 percent seated and 20 percent standing has been applied.<br />
The physical layout of the holdroom consists of a 180-square foot wide (six feet)<br />
loading bridge egress corridor with an assumed average 30-foot deep holdroom.<br />
Current holdrooms average a 45-foot depth which accounts for the unique<br />
operational layout of the three terminals. This extra depth is needed to allow for<br />
the inclusion of the decentralized security screening checkpoints, restrooms, and<br />
small concessions areas that occupy space within the secure perimeter.<br />
The podium position area and associated queue space is allocated at between 90 to<br />
115 square feet. Existing holdrooms are paired or clustered. This grouping<br />
together of holdrooms has made it possible to reduce the physical amount of<br />
holdroom seating area needed. A ten percent reduction in the seating areas at KCI<br />
has been assumed for the future requirements. Additionally, to reflect the specific<br />
operating characteristics of airlines with frequent flights and short ground times,<br />
like Southwest’s operation, a heavy utilization factor of 30 percent has been used.<br />
This factor takes into account the additional passengers from more than one flight<br />
at the gate at the same time.<br />
The average seating capacities and recommended holdroom sizes are summarized<br />
in Table 3.2-2, Passenger Holdroom Typical Areas, below.<br />
Table 3.2-2<br />
PASSENGER HOLDROOM TYPICAL AREAS<br />
FAA TAXIWAY DESIGN GROUP<br />
DRAFT<br />
TYPICAL<br />
SEATS<br />
TYPICAL AIRCRAFT<br />
AREA (SF)<br />
I Small Commuter 25 Cessna 550<br />
II Medium Commuter 50 SF340/CRJ 810<br />
III Large Commuter 50 ATR/Dash8 1,240<br />
III Narrowbody 150 A320/B737/MD-80 2,400<br />
IIIa B757 185 B757 3,000<br />
IV Widebody 280 DC-10/MD-11/B767/B787 3,700<br />
Source:<br />
FAA AC 150/5300-13, Airport Design, Hirsh & Associates, and Landrum & Brown<br />
Landrum & Brown Page 50<br />
April 2013
KANSAS CITY NEW TERMINAL STUDY<br />
ADVANCE TERMINAL PLANNING STUDY<br />
PROGRAM CRITERIA DOCUMENT<br />
DRAFT<br />
The existing holdroom capacity at KCI is approximately 132,618 square feet, of<br />
which 86,826 square feet is currently being leased by the airlines.<br />
The recommended holdroom area is 68,200 square feet which is less than the<br />
existing available area. During the 2008 MP most of the airlines reported having<br />
adequate holdroom area, but United has said their holdrooms are generally too<br />
small. Analysis of their existing holdroom area suggests the area is adequate to<br />
handle their current schedule. However, given the fact that area includes security<br />
and restrooms along with the varying depth of the seating area, this could suggest<br />
there are times when the area is at, or over capacity. This could generally be said<br />
for all the holdroom areas. The 2030 demand level requires 85,000 square feet.<br />
3.2.3.2 Concessions Space<br />
This category of the terminal space program represents all of the areas devoted to<br />
commercial concessions that generate revenue for the Airport. In general, these<br />
include food/beverage, news/gift/sundry (business centers, shoe shine, barber<br />
shops, specialty stores, etc.), rental car (RAC), and other revenue-generating<br />
functions. These amenities provide the passenger with necessary services and<br />
discretionary goods and services during the processing function, and provide vital<br />
revenue to the Airport.<br />
A general planning rule suggests approximately ten percent of public space should<br />
be allocated to concessions with a recommended 80 to 90 percent of the total<br />
concessions area allocated to the secure side of the terminal beyond security.<br />
The remaining 10 to 20 percent should be in the non-secure or landside area of the<br />
terminal area. Approximately four percent of the public area at KCI is allocated to<br />
concessions space and about 90 percent of the revenue generating area in the<br />
non-secure area of the terminals, with the majority of this being allocated to the<br />
mezzanine levels. This is due to the unique operational layout of the three<br />
terminals and suggests a need for more revenue generating concessions space.<br />
DRAFT<br />
Accepted industry standards recommend approximately 1,500 square feet of total<br />
concessions space per 100,000 annual enplanements (ANNEP). KCI currently has<br />
44,460 square feet of concessions resulting in a ratio of 620 square feet per<br />
100,000 ANNEP. For future terminal area space requirements a ratio of<br />
1,300 square feet per 100,000 ANNEP, with a split of 80 percent secure and<br />
20 percent non-secure has been used. The existing recommended concessions<br />
program results in an area of 66,350 square feet or approximately ten percent of<br />
the public area. The future 2030 demand requires 83,770 square feet of space.<br />
An additional area is typically reserved for storage and service areas which is equal<br />
to 25 to 35 percent of the total concessions space program. These areas typically<br />
include storage areas, preparation kitchens, employee lockers, loading docks, trash<br />
compactors, and concessionaires’ administrative offices. At KCI this existing area<br />
equals approximately 14,010 square feet or 55 percent of the public area. A more<br />
typical 25 percent has been used for future space requirements, which reflects the<br />
type of concession operations at KCI. The result is a need for 16,200 square feet<br />
by 2030. However, this initial estimate for future requirements should be reviewed<br />
by the concession operators.<br />
Landrum & Brown Page 51<br />
April 2013
KANSAS CITY NEW TERMINAL STUDY<br />
ADVANCE TERMINAL PLANNING STUDY<br />
PROGRAM CRITERIA DOCUMENT<br />
DRAFT<br />
It should be noted that this space does not account for any RAC facilities because<br />
this area will be located in the new remote consolidated RAC site. Any future<br />
requirements are still considered to be remote.<br />
3.2.3.3 U.S. Customs and Border Protection Services (CBP)<br />
The CBP, often referred to as Federal Inspection Services (FIS), are required by law<br />
for the processing of international passengers into the U.S. and its priority mission<br />
is homeland security. It consists of U.S. government agencies which include<br />
U.S. Immigration and Naturalization Services (INS), U.S. Customs Services (USCS),<br />
Animal and Plant Health Inspection Services (APHIS), and Public Health Services<br />
(PHS). CBP facilities consist of passenger processing areas for each agency as well<br />
as required support space for offices, maintenance, and other areas.<br />
The future program’s facility requirements and processing functions are assumed to<br />
reflect that of a two-step process adopted nationally. In this procedure all<br />
international arriving passengers are subject to primary inspection by the INS and a<br />
secondary more selective inspection in the secondary processing function by<br />
U.S. Customs. Although this is a national policy, implementation may vary at each<br />
airport based on local conditions and annual activity levels. This is the case at KCI<br />
where currently the INS and Customs are combined in the same space.<br />
An interview with CBP, held during the 2008 MP, revealed annual activity at<br />
35,000 to 40,000 passengers as compared to the current 43,870 passengers per<br />
year. The majority of passengers are U.S. citizens coming from Mexico for which<br />
processing is fairly simple. The CBP estimated an average throughput of<br />
approximately 100 passengers per half hour. The current international service is<br />
provided by Air Canada through their contract carrier, Jazz, year round and<br />
seasonally by Frontier. Southwest is assumed as a potential international service<br />
carrier in the future. All flights from Canada into KCI are pre-cleared. Gate 90 in<br />
<strong>Terminal</strong> C handles these international inbound arriving passengers. This is an<br />
arrival gate only with no associated holdroom space for outbound passengers,<br />
which means the CBP can handle only one arrival flight at a time. They have<br />
operated in their current configuration for years and for the most part this facility is<br />
adequate for the current passenger volumes. Some exceptions have been noted<br />
such as:<br />
<br />
<br />
DRAFT<br />
Inadequate exit area to the meeters/greeters hall. Line-of-sight issues to the<br />
Immigration/Customs area allows visitors to take pictures of passengers as<br />
they process, which is considered a security issue for the agencies.<br />
CBP would like some sort of visual barrier to prevent this from occurring.<br />
CBP has expressed a desire for more record storage, electrical outlets, and<br />
functioning shower/locker facilities. Currently there is no hot water for these<br />
areas.<br />
The future CBP agency inspection and support area requirements are based on the<br />
CBP, Airport Technical Design Standards Passenger Processing Facilities,<br />
August 2006 document. CBP space requirements are sized for a capacity stated in<br />
terms of passengers per hour and the type of facility planned for such as small<br />
(under 800 passengers/hour), medium (800 to 2,000 passengers/hour), and large<br />
Landrum & Brown Page 52<br />
April 2013
KANSAS CITY NEW TERMINAL STUDY<br />
ADVANCE TERMINAL PLANNING STUDY<br />
PROGRAM CRITERIA DOCUMENT<br />
DRAFT<br />
(greater than 2,000 passengers/hour) airports. KCI, under these scenarios, would<br />
fall under the small airport category processing, less than 200 passengers/hour.<br />
The recommended future layout, space permitting, would have Primary Inspection,<br />
baggage claim, and Secondary Inspection on one level with other offices and<br />
support space on different levels as needed. At a minimum the Secondary<br />
Inspection and Support area needs to be on the passenger processing level for<br />
direct access.<br />
As previously mentioned, CBP considers the current 19,910 square feet to be<br />
adequately sized for the current passenger volumes. However, the current<br />
recommended size for this function is 29,100 square feet which in turn represents a<br />
need for more space in the individual agency areas such as in their support<br />
functions. For future planning the CBP functions have been sized to handle the<br />
future 2030 forecast level of 275 passengers per hour resulting in a facility of<br />
approximately 29,600 square feet. Fully staffed however, the CBP facilities can<br />
handle 400 passengers an hour with a 90 second per passenger turn over time.<br />
The baggage carousels are sized to roughly the same capacity (450-600 passenger<br />
per hour assuming two bags per passenger). CBP may evaluate the airport’s traffic<br />
projections on a case-by-case basis and update any requirements as needed. As a<br />
result, certain agency functions may be combined or left out of the program all<br />
together.<br />
3.2.3.4 Public Space<br />
Security Screening Checkpoint (SSCP)<br />
DRAFT<br />
This area of the program is dedicated to the TSA space for screening departing<br />
passengers. Future planning requirements are based on the Recommended<br />
Security Guidelines for Airport <strong>Planning</strong>, Design and Construction, March 2011,<br />
document published by the TSA.<br />
These areas generally include two types of screening configurations. The “2 to 2”<br />
module includes two lanes with two x-rays per two magnetometers with a footprint<br />
of 29 feet by 42 feet. An additional ten feet of depth has been added downstream<br />
for reconciliation of passenger baggage and personal belongings. Overall, this area<br />
requires 754 square feet of space.<br />
The second module type is the “2 to 1” or two lanes consisting of two x-rays per<br />
one magnetometer with a footprint of 22 feet by 44 feet with an additional ten feet<br />
of depth downstream for a total of 594 square feet of space. The “2 to 1” module<br />
type is becoming more prevalent, according to TSA, in that it provides greater<br />
flexibility for staffers to work among different checkpoint lanes. These modules<br />
generally consist of the primary screening areas and their equipment, and a<br />
secondary search area (holding or wanding area). Additional area needs to be<br />
added will be for passenger queuing and exits, and space permitting, area for TSA<br />
offices.<br />
Landrum & Brown Page 53<br />
April 2013
KANSAS CITY NEW TERMINAL STUDY<br />
ADVANCE TERMINAL PLANNING STUDY<br />
PROGRAM CRITERIA DOCUMENT<br />
DRAFT<br />
Currently KCI has nine security checkpoints, one for each airline, down from 11 in<br />
2006. Southwest uses two checkpoints for their holdroom areas. This operation is<br />
unique only to KCI in that it decentralizes security to each of the boarding gate<br />
areas thereby reducing the capacity of the holdrooms themselves. KCI currently<br />
has at least one x-ray machine per checkpoint but if that one machine goes down it<br />
essentially delays the airline until the machine is fixed. In some cases they have<br />
changed the current setup to include one magnetometer per two x-ray machines<br />
which has saved valuable space. Another disadvantage to this operation is that it<br />
spreads the function between three terminals, making it difficult to move TSA staff<br />
between positions. KCI also has a very high re-screen rate of 25 to 30 percent<br />
compared to the national average of just four percent. This is generally attributed<br />
to passengers leaving the holdroom area to go to the concessions area. It should<br />
be noted that this percentage was reduced from about 34 percent with the addition<br />
of bathrooms in the holdroom areas which again reduced the effective passenger<br />
capacity of the area. TSA has also expressed an interest in having a centralized<br />
training area in each terminal and more break rooms. TSA at KCI is capable of<br />
processing around 200 passengers per hour and in some instances have done as<br />
many as 300 per hour.<br />
For future planning requirements, a throughput of 150 passengers per lane per<br />
hour has been used which is more typical of what is being surveyed in the industry<br />
but should be reviewed periodically as activity levels change. A more centralized<br />
security area has also been established in the terminal core, split between two<br />
checkpoints, but it is also dependent on the final terminal conceptual layout.<br />
A module of “2 to 1” with a queuing depth of 30 feet has been used. Security<br />
screening lanes and area requirements are a function of the peak ten-minute<br />
throughput per number of required check-in positions. A processing time of<br />
20 seconds per passenger has been used for this analysis.<br />
The combined total of the security screening functions at KCI equals approximately<br />
24,200 square feet between the three terminals. The existing recommended total<br />
of 9,600 square feet is a direct result of a more centralized security screening area.<br />
The future 2030 demand requires an area of approximately 38,200 square feet.<br />
Circulation<br />
DRAFT<br />
The following categories represent the public circulation areas within the terminal<br />
and concourse areas which include the ticket lobby, baggage claim, secure<br />
circulation, general circulation, public seating areas, a meeters/greeters lobby for<br />
arriving passengers, and additional space for areas such as transportation and hotel<br />
courtesy phones. Each of these categories is described below.<br />
Ticket Lobby Circulation space is within the ticket lobby area leading up to the ticket<br />
counter queue. It is generally used for cross-circulation from the ticket counter to<br />
the security checkpoint areas. The current circulation depth within the three<br />
terminals ranges from 15 to 25 feet. A future planning requirement of 25 feet has<br />
been used for this analysis. Given KCI’s operational layout, what is considered<br />
Landrum & Brown Page 54<br />
April 2013
KANSAS CITY NEW TERMINAL STUDY<br />
ADVANCE TERMINAL PLANNING STUDY<br />
PROGRAM CRITERIA DOCUMENT<br />
DRAFT<br />
general circulation in the programmed area is used for the ticketing areas as well.<br />
Therefore, no existing ticket lobby circulation area is tabulated. The 2030 demand<br />
year requires 9,500 square feet of space.<br />
Baggage Claim Circulation represents the main circulation area adjacent to the<br />
claim area. As with the ticket lobby, the general circulation area handles the claim<br />
area circulation and, therefore, no square footage areas have been tabulated in the<br />
existing facility program. A depth of 25 feet for cross circulation along the full<br />
length of the claim area has been used for this analysis. By 2030 an area<br />
8,500 square feet would be required.<br />
Secure Circulation is all the area beyond the security checkpoint areas and consists<br />
primarily of the central corridor of the concourses and any adjacent egress stairs on<br />
the holdroom level. Again, given the unique operational layout of the three<br />
terminals, there are essentially no secure circulation areas except those areas that<br />
include any connecting holdrooms and vertical circulation elements such as those<br />
found in <strong>Terminal</strong> A, leading from Gate 6 down to the apron level holdroom area for<br />
Air Midwest on Gates 1 through 5. For future planning 45-foot, double-loaded<br />
corridors (i.e. gate holdrooms on both sides of the concourse) have been assumed<br />
which is a typical planning standard for longer concourses requiring moving walks.<br />
For areas not requiring assisted passenger movement a single-loaded corridor of<br />
30 feet is standard.<br />
The future calculated area is based on NBEG or an area per equivalent concourse<br />
length determined by gates. However, the actual amount of secure circulation will<br />
depend on the specific proposed concourse configurations and whether they consist<br />
of gates on one or both sides of the corridor. Using a 45-foot double-loaded<br />
concourse requires approximately 2,700 square feet per NBEG. The future 2030<br />
demand year requires 107,500 square feet of secure circulation.<br />
DRAFT<br />
The General Circulation area of the program includes all the other areas of<br />
circulation that make up the non-secure public functions of the terminal and include<br />
areas such as vertical circulation elements, corridors, and any other architectural<br />
spaces that tie the functional elements of the terminal together. For the New<br />
<strong>Terminal</strong> a planning standard of 15 percent has been used, which is typical for<br />
similarly sized terminals. The future requirement of 69,900 square feet is<br />
recommended to meet the 2030 planning level year.<br />
Public Seating includes the general waiting areas near the ticket lobby, baggage<br />
claim area, and concessions. Currently, the public seating areas are located in<br />
between the vestibules and diagonally across from each of the airlines’ baggage<br />
claim areas. The typical planning standard is to provide seating for approximately<br />
15 percent of the peak hour departing passengers and their well-wishers along with<br />
the meeters/greeters for the arriving passengers. Since no survey data was<br />
available for the historic ratio of visitors to passengers, a typical ratio of<br />
.05 visitors/passengers was used along with a LOS C standard of 15 square feet per<br />
seated passenger/visitor. Analysis shows the existing area of 16,129 square feet of<br />
seating is more than adequate to meet the current demand and exceeds the<br />
Landrum & Brown Page 55<br />
April 2013
KANSAS CITY NEW TERMINAL STUDY<br />
ADVANCE TERMINAL PLANNING STUDY<br />
PROGRAM CRITERIA DOCUMENT<br />
DRAFT<br />
recommended existing area of 1,400 square feet. This is generally due to the<br />
operational layout of the terminal and the dedicated baggage claim areas.<br />
The future 2030 demand year requires 2,200 square feet of space.<br />
The Domestic Meeters/Greeters Lobby includes the functional space required to<br />
accommodate the arriving passenger’s meters/greeters in and around the baggage<br />
claim area of the terminal. The calculations include factors such as peak hour<br />
arriving passengers, visitor to passenger ratios, square feet per visitor, and average<br />
dwell time per arriving passenger and their visitors. For this analysis a typical<br />
15 visitor per passenger ratio has been assumed along with a LOS C standard of<br />
20.5 square feet per passenger/visitor factor. Dwell times used for passengers and<br />
visitors were five minutes and 30 minutes, respectively. As stated previously, since<br />
the general circulation area of the existing terminals serve the ticket lobby and<br />
baggage claim area, circulation requirements for meters/greeters lobbies do not<br />
exist. The 2030 demand year requires a total area of 10,900 square feet for a<br />
domestic meeters/greeters lobby to meet the projected peak hour level of activity.<br />
Currently KCI has approximately 1,144 square feet of area allocated to<br />
Transportation and Hotel Courtesy Phones which is located in each of the airlines’<br />
baggage claim areas. With the replication of terminals and exclusive claim areas,<br />
this area is generally oversized to meet current demand levels of activity. A typical<br />
planning standard of 90 to 110 square feet per 1,000,000 annual enplanements is<br />
used. For this analysis a factor of 110 square feet has been used. This results in<br />
an area of approximately 700 square feet required for the transportation and hotel<br />
courtesy phone area by the year 2030.<br />
Restrooms<br />
DRAFT<br />
This category represents the area of public space allocated to passenger restroom<br />
facilities. The program has been divided between the non-secure (ticketing,<br />
baggage claim, and concessions areas) and secure (concourse areas beyond<br />
security) portions of the terminal and related concourses.<br />
Restrooms by code should have as many toilets for women as toilets and or urinals<br />
for men. Based on the airport’s lease drawings the majority of the restrooms have<br />
more fixtures for men than women. The exception is where restrooms have been<br />
located inside the holdroom areas where the ratio is equal. <strong>Planning</strong> factors are<br />
based on a typical 2.5-square foot per peak hour total O&D passenger and their<br />
visitors for non-secure areas, and a restroom module located in the secure<br />
concourse areas for every eight EQA. The typical module for concourses serving<br />
O&D activity is 1,600 square feet which includes both men’s and women’s facilities.<br />
The existing non-secure area measures approximately 17,977 square feet while the<br />
secure area measures only 5,040 square feet. This is due to the current functional<br />
layout of the terminals because of the limited area available inside the secure<br />
holdroom areas. An existing recommended non-secure/secure area requirement is<br />
8,400 and 5,600 square feet, respectively. The 2030 demand level year requires<br />
an area of 10,900 square feet for non-secure areas of the terminal and<br />
5,600 square feet for the secure concourse area locations.<br />
Landrum & Brown Page 56<br />
April 2013
KANSAS CITY NEW TERMINAL STUDY<br />
ADVANCE TERMINAL PLANNING STUDY<br />
PROGRAM CRITERIA DOCUMENT<br />
DRAFT<br />
Other Space<br />
This category accounts for miscellaneous tenant space which includes areas such as<br />
business centers and shuttle services. Other areas accounted for include display<br />
areas, information counters, etc. A planning factor of ten square feet per 100,000<br />
ANNEP has been assumed for the miscellaneous tenant and business center<br />
requirement, 20 square feet for shuttle services, and five square feet for the<br />
information counters and display areas. The total 2030 requirement is for<br />
approximately 11,100 square feet.<br />
3.2.3.5 Non-Public Space<br />
Non-Airline Tennant Space<br />
This category includes the “back of house” area that is not accessible to the public<br />
and generally consists of areas such as airport administration (if not in a remote<br />
location), airport police, and any airport-related offices and support space.<br />
Airport Administration represents the total area devoted to airport administration<br />
including city space functions. It generally consists of reception areas, offices,<br />
conference rooms, storage areas, work areas, and rooms for special events such as<br />
VIP press conferences, and other airport-related operations space such as airport<br />
police. The requirements for airport administration are a function of staffing<br />
generated by the airport. This area is principally located in an office complex<br />
adjacent to the terminal; however, some space can be allocated within the terminal<br />
area itself. A review of the airport lease drawings shows there is approximately<br />
29,300 square feet of administration/operations space within the terminal area.<br />
No change is anticipated for the New <strong>Terminal</strong>, but future space requirements<br />
should be reviewed by the KCAD.<br />
Other Tenants accounts for any other miscellaneous tenant space within the<br />
terminal area. A planning factor of ten square feet per 100,000 ANNEP has been<br />
used for the analysis. The 2030 demand year requires approximately 6,600 square<br />
feet of additional space.<br />
Other Space<br />
DRAFT<br />
This category accounts for the non-public restroom facilities and circulation areas<br />
typically found in airline operations and airport administrative space.<br />
The majority of Non-Public Restrooms, which in some areas include locker space,<br />
are accounted for on the apron level of all three terminal buildings. The existing<br />
area is approximately 22,197 square feet. The current ratio of non-public space to<br />
non-public restrooms has been used for future planning requirements and results in<br />
an area of 2,900 square feet required for non-public restrooms by 2030.<br />
The Non-Public circulation area provides access to the airline operations, airport<br />
administration areas, concessions, support, and other areas typically not used by<br />
the traveling public. Typical planning standards base this on 10 to 15 percent of<br />
Landrum & Brown Page 57<br />
April 2013
KANSAS CITY NEW TERMINAL STUDY<br />
ADVANCE TERMINAL PLANNING STUDY<br />
PROGRAM CRITERIA DOCUMENT<br />
DRAFT<br />
the non-public functional areas. KCI has a relatively high ratio of 30.4 percent<br />
which can be attributed to the overall operational layouts of the three terminals.<br />
It should also be noted that this area of the program is often a matter of<br />
interpretation by the consultant as to whether or not to include this space in the<br />
public or non-public category. For future planning requirements a ratio of ten<br />
percent has been used requiring an area of 26,400 square feet for non-public<br />
circulation by 2030.<br />
<strong>Terminal</strong> Function<br />
This category accounts for all the mechanical, electrical, utility, janitorial, storage,<br />
and shop areas as well as the structure and non-net areas of the building.<br />
These areas combined with the other functional areas of the terminal and concourse<br />
locations create the total gross footprint of the building.<br />
The Maintenance/Janitorial/Storage/Shops area accounts for the building<br />
maintenance facilities and consists of shops, storage, office space, circulation, and<br />
janitorial closets. Typical planning standards require one to two percent of the total<br />
functional areas. For this analysis 1.5 percent has been used, which closely reflects<br />
the existing ratio of 1.6 percent. The existing recommended area of 11,200 square<br />
feet reflects the future consolidation of a single terminal building.<br />
The 2030 demand level requires 8,500 square feet for the building maintenance<br />
facilities.<br />
The Mechanical/Electrical/Telephone/Plumbing area of the program includes all the<br />
utility support areas for the terminal and is generally a percentage of the enclosed<br />
functional areas of the terminal, typically 10 to 12 percent. Recent trends in<br />
computer systems, telecommunications, and other building-related systems have<br />
increased the demand for these areas within the terminal building. Some of these<br />
areas can be accommodated in the airline operations area, whereas common use<br />
systems need to be located in the airport-controlled areas. For this analysis<br />
12.2 percent of the functional area has been used which is an increase from the<br />
existing 11.2 percent ratio. The existing area of 101,710 square feet is adequate to<br />
meet the current activity level experienced by the Airport. The total 2030<br />
requirement is 103,200 square feet for utility support areas.<br />
DRAFT<br />
The Building Systems (Structural/Non-Net/Void) ties together all the previous<br />
functional elements of the program to provide a better estimate of the total gross<br />
building area. Unusable space or special structures, often make up this category of<br />
the program, and depending on how the gross areas are determined, a factor of<br />
two to five percent is typically added for this category.<br />
The existing terminal gross area was taken from the airport terminal space<br />
allocation drawings. All functional elements were then added together and<br />
subtracted from the gross area footprint per terminal to calculate the non-net areas<br />
of the three buildings. A ratio of three percent has been used for this analysis<br />
resulting in a requirement of approximately 24,500 square feet by 2030 for building<br />
systems area.<br />
Landrum & Brown Page 58<br />
April 2013
KANSAS CITY NEW TERMINAL STUDY<br />
ADVANCE TERMINAL PLANNING STUDY<br />
PROGRAM CRITERIA DOCUMENT<br />
DRAFT<br />
3.2.4 SECURITY SCREENING CHECKPOINT CONSIDERATIONS<br />
Since the formation of the TSA, the layout of Security Screening Checkpoints<br />
(SSCP) has evolved. Some of this evolution is due to equipment standardization by<br />
the TSA, but some is due to advancements in technologies. For example, the<br />
traditional x-ray machines are being replaced by dual-view machines that can<br />
provide images in two directions as well as classify objects based on molecular<br />
weights. Another example of technology changes includes the addition of<br />
equipment such as the <strong>Advance</strong>d Imaging Technology (AIT) equipment and<br />
Explosive Trace Detection (ETD). The future will continue to see the advancement<br />
of technology that could include Liquid Explosive Detection (LED) equipment, as<br />
well as further advances in the carry-on baggage x-ray technology, and higher<br />
capacity/higher speed AIT type equipment.<br />
3.2.4.1 Checkpoint Layout<br />
TSA currently publishes guidelines for SSCP layouts that include the various<br />
equipment types being utilized across the country. The latest version of the<br />
standard was issued in October 2012, and provides the overall equipment base<br />
configurations. The space planning criteria has continued to evolve based upon the<br />
information gathered about the overall operation of the current configurations.<br />
One of the parameters noted recently pertains to throughput in lanes that utilize<br />
AIT units as the primary passenger screening device. The traditional lane<br />
configuration included two x-ray machines to screen carry-on baggage, with a<br />
single, shared Walk Through Metal Detector (WTMD) between the two x-ray lines.<br />
This was based upon the x-ray machine throughput versus the WTMD throughput.<br />
The WTMD throughput was fairly high, but the WTMD units have been supplanted<br />
by AIT units that have much lower throughput. At the same time, airlines have<br />
implemented checked baggage fees, which increased the quantity of screened<br />
carry-on baggage. Between these two factors, the TSA now recommends that each<br />
x-ray machine have a dedicated AIT/WTMD instead of the shared lane to equalize<br />
throughput. This approach increases the overall width of each processing lane.<br />
3.2.4.2 Throughput<br />
DRAFT<br />
The throughput of a SSCP lane is based upon several factors that include travel<br />
experience of the passengers, the type of equipment in use at each airport, and the<br />
overall configuration among other factors. One consideration to study is the impact<br />
of implementing the TSA Pre✓ program. This program is used to pre-screen<br />
frequent flyer passengers and determine the possible threat that each passenger<br />
could pose to commercial aviation. For passengers that are part of the Pre✓<br />
program, the screening requirements are reduced, allowing the passenger to leave<br />
liquids and electronics within bags, leave on shoes and belts, and use WTMD type<br />
equipment instead of AIT equipment. This equates to faster throughput for these<br />
lines than that of a standard SSCP lane. However, the current TSA randomly<br />
selects people in the Pre✓ program to process through the more stringent regular<br />
passenger screening lanes. This also holds true for some international flight<br />
exclusions as well. Based on experience with the program, the percentage of<br />
people allowed through the Pre✓ lane is far lower than the percentage that are<br />
Landrum & Brown Page 59<br />
April 2013
KANSAS CITY NEW TERMINAL STUDY<br />
ADVANCE TERMINAL PLANNING STUDY<br />
PROGRAM CRITERIA DOCUMENT<br />
DRAFT<br />
enrolled, creating much longer queue lines and much slower processing times than<br />
would be expected. While it is expected that this will improve in the future, it is<br />
important to note that being in the Pre✓ program does not automatically ensure<br />
that a person will be allowed to process through the Pre✓ lane. For purposes of<br />
this analysis, the throughputs shown in Table 3.2-3, Expected Passenger<br />
Throughputs per Lane Type, are expected. Also, in order to account for different<br />
possible scenarios, percentages will be calculated for each year to show a possible<br />
range of lane requirements, as shown in Table 3.2-4, Checkpoint Lane<br />
Requirements.<br />
Table 3.2-3<br />
EXPECTED PASSENGER THROUGHPUTS PER LANE TYPE<br />
Lane Type Throughput Notes:<br />
TSA Pre✓ Lane/Trusted Traveler 5.0<br />
Standard Passenger Lane with AIT 2.4<br />
Special Assistance/Family Passenger<br />
Lane<br />
Source:<br />
Ross & Baruzzini<br />
Table 3.2-4<br />
CHECKPOINT LANE REQUIREMENTS<br />
1.5<br />
Based on observed throughputs at<br />
existing facility at KCI<br />
Based on observed throughputs at<br />
existing facility at KCI<br />
Checkpoint Lane Types<br />
Percentage of Passengers<br />
TSA Pre✓ Lane/Trusted Traveler 10% 25% 50%<br />
Standard Passenger lane with AIT 85% 70% 45%<br />
Special Assistance/Family Passenger Lane 5% 5% 5%<br />
Source:<br />
Ross & Baruzzini<br />
DRAFT<br />
The TSA Pre✓ program is still fairly new, so the long-term percentage of<br />
passengers that will enroll in this program is unknown. Some estimates place<br />
participation as high as 75 percent of the passenger population, but this is<br />
considered an optimistic estimate. Likewise, the current population of passengers<br />
enrolled in Pre✓ is still fairly low. For the comparison of various scenarios, the<br />
quantity of lanes is calculated using differing percentages of passengers in the Pre✓<br />
program.<br />
Landrum & Brown Page 60<br />
April 2013
KANSAS CITY NEW TERMINAL STUDY<br />
ADVANCE TERMINAL PLANNING STUDY<br />
PROGRAM CRITERIA DOCUMENT<br />
DRAFT<br />
3.2.4.3 Calculations<br />
Current passenger counts and predicted passenger counts for 2025 and 2030 are<br />
based on the KCI Forecast Update dated April 27, 2012 as provided by L&B.<br />
Table 3.2-5, Peak Hour Passenger Statistics, indicates the expected Peak Hour<br />
Enplanements forecasted for the years noted. The numbers indicate the worst case<br />
scenario for peak hour, and this was used to determine the maximum number of<br />
lanes required for the quantities shown.<br />
Table 3.2-5<br />
PEAK HOUR PASSENGER STATISTICS<br />
Year<br />
2012<br />
Year<br />
2025<br />
Year<br />
2030<br />
Peak Hour Enplanements - Domestic 2,159 2,688 2,944<br />
Peak Hour Enplanements - International 125 235 257<br />
Total Passengers Enplaned 2,284 2,923 3,201<br />
Checkpoint Throughput – Passengers per<br />
Minute<br />
Passenger Processing Queue Time (Maximum) – 10<br />
Minutes Adjusted Load Factor<br />
Source:<br />
Adjusted Checkpoint Throughput – Passengers<br />
per Minute<br />
Ross & Baruzzini<br />
38.1 48.8 53.4<br />
0.86 0.86 0.9<br />
32.8 42 46<br />
DRAFT<br />
The calculation for SSCP lane quantity requirements will include three different<br />
percentages to account for the passengers enrolled in the TSA Pre✓ program – ten<br />
percent, 25 percent, and 50 percent. These percentages are meant to fulfill two<br />
roles. First, this allows for an assessment of the current situation where only a<br />
small percentage of passengers are enrolled in Pre✓, which is the main reason for<br />
the inclusion of the ten percent figure. Second, the 25 percent and 50 percent<br />
figures account for the impact of the Pre✓ program for year 2025 and 2030.<br />
Overall, it is expected that the enrollment will continue to grow, but the top figure<br />
of 50 percent is intended to be conservative to ensure that sufficient lanes are<br />
provided.<br />
As with all calculations of this type, it is important to bear in mind that the<br />
calculation is based on the peak hour. The quantity of lanes required for non-peak<br />
times are expected to be much lower. The checkpoint throughput in passengers<br />
per minute is noted above, assuming that all passengers for the peak hour are<br />
processed within that hour. This assumes that the overall queue will be very<br />
limited, with little to no queue time. The Adjusted Checkpoint Throughput is based<br />
upon allowing for the peak load to be processed over the course of 70 minutes,<br />
allowing for a ten-minute average queue to form during peak screening times, as<br />
shown in Table 3.2-6, Lane Requirements for Minimal Queue Time – 2012.<br />
Landrum & Brown Page 61<br />
April 2013
KANSAS CITY NEW TERMINAL STUDY<br />
ADVANCE TERMINAL PLANNING STUDY<br />
PROGRAM CRITERIA DOCUMENT<br />
DRAFT<br />
Currently the existing SSCPs in the KCI terminals are distributed throughout each<br />
terminal facility with approximately four SSCPs per terminal, for a total of<br />
16 SSCPs. Because of this arrangement, the perception is that the wait times are<br />
low. It would be a customer service policy decision to increase the allowable wait<br />
time at the checkpoint.<br />
Table 3.2-6<br />
LANE REQUIREMENTS FOR MINIMAL QUEUE TIME - 2012<br />
Expected Lane Requirements -2012<br />
Population in TSA Pre✓/Trusted<br />
Traveler<br />
Percentage<br />
Total<br />
Passengers<br />
Expected<br />
Throughput<br />
Total<br />
Lanes<br />
10% 3.9 5.0 0.8<br />
Standard Passenger lane with AIT 85% 32.4 2.4 13.5<br />
Special Assistance/Family Passenger<br />
Lane<br />
Expected Lane Requirements – 2012<br />
Population in TSA Pre✓/Trusted<br />
Traveler<br />
5% 2 1.5 1.4<br />
15.7<br />
25% 9.6 5.0 2<br />
Standard Passenger lane with AIT 70% 226.7 2.4 11.2<br />
Special Assistance/Family Passenger<br />
Lane<br />
Expected Lane Requirements – 2012<br />
Population in TSA Pre✓/Trusted<br />
Traveler<br />
5% 211.2 1.5 1.4<br />
14.6<br />
50% 19.1 5.0 3.9<br />
Standard Passenger lane with AIT 45% 17.2 2.4 7.2<br />
Special Assistance/Family Passenger<br />
Lane<br />
DRAFT<br />
5% 2 1.5 1.4<br />
12.5<br />
Source:<br />
Ross & Baruzzini<br />
In order to meet the requirements for the current expected peak hour, the quantity<br />
of lanes range from 16 lanes assuming only a ten-percent Pre✓ enrollment down to<br />
approximately 13 SSCPs lanes assuming a 50 percent Pre✓ enrollment. If the<br />
allowable processing time for the peak hour is allowed to be extended to<br />
70 minutes, which will allow a queue line to form, then the quantity of lanes would<br />
be as shown in Table 3.2-7, Lane Requirements for Peak Hour Load<br />
Processed in 70 Minutes – 2012; Table 3.2-8, Lane Requirements for Peak<br />
Hour Load Processed in 70 Minutes – 2025; and Table 3.2-9, Lane<br />
Requirements for Peak Hour Load Processed in 70 Minutes – 2030.<br />
Landrum & Brown Page 62<br />
April 2013
KANSAS CITY NEW TERMINAL STUDY<br />
ADVANCE TERMINAL PLANNING STUDY<br />
PROGRAM CRITERIA DOCUMENT<br />
DRAFT<br />
Table 3.2-7<br />
LANE REQUIREMENTS FOR PEAK HOUR LOAD PROCESSED IN 70 MINUTES -<br />
2012<br />
Expected Lane Requirements – 2012<br />
Percentage<br />
Total<br />
Passengers<br />
Expected<br />
Throughput<br />
Total<br />
Lanes<br />
Population in TSA Pre✓/Trusted Traveler 10% 3.3 5.0 0.7<br />
Standard Passenger lane with AIT 85% 27.9 2.4 11.7<br />
Special Assistance/Family Passenger<br />
Lane<br />
Expected lane Requirements – 2012<br />
5% 1.7 1.5 1.2<br />
Population in TSA Pre✓/Trusted Traveler 25% 8.2 5.0 1.7<br />
Standard Passenger<br />
DRAFT<br />
lane with AIT 70% 23 2.4 9.6<br />
Special Assistance/Family Passenger<br />
5% 17 1.5 1.2<br />
Lane<br />
12.5<br />
Expected lane Requirements – 2012<br />
Population in TSA Pre✓/Trusted Traveler 50% 16.4 5.0 3.3<br />
Standard Passenger lane with AIT 45% 14.8 2.4 6.2<br />
Special Assistance/Family Passenger<br />
5% 1.7 1.5 1.2<br />
Lane<br />
10.7<br />
Source: Ross & Baruzzini<br />
In order to meet the adjusted processing time for peak hour, allowing for the peak<br />
hour passengers to be processed in approximately 70 minutes, the quantity of<br />
SSCP lanes would range from 14 lanes, assuming only a ten percent Pre✓<br />
enrollment, down to approximately 11 lanes, assuming a 50 percent Pre✓<br />
enrollment.<br />
13.6<br />
Landrum & Brown Page 63<br />
April 2013
KANSAS CITY NEW TERMINAL STUDY<br />
ADVANCE TERMINAL PLANNING STUDY<br />
PROGRAM CRITERIA DOCUMENT<br />
DRAFT<br />
Table 3.2-8<br />
LANE REQUIREMENTS FOR PEAK HOUR LOAD PROCESSED IN 70 MINUTES –<br />
2025<br />
Expected Lane Requirements -2025<br />
Percentage<br />
Total<br />
Passengers<br />
Expected<br />
Throughput<br />
Total<br />
Lanes<br />
Population in Pre✓/Trusted Traveler 10% 34.2 5.0 0.9<br />
Standard Passenger lane with AIT 85% 35.7 2.4 14.9<br />
Special Assistance/Family Passenger Lane 5% 2.1 1.5 1.4<br />
Expected lane Requirements – 2012<br />
Population in Pre✓/Trusted Traveler 25% 10.5 5.0 2.1<br />
Standard Passenger lane with AIT 70% 29.4 2.4 12.3<br />
Special Assistance/Family Passenger Lane 5% 2.1 1.5 1.4<br />
Expected lane Requirements – 2012<br />
Population in Pre✓/Trusted Traveler 50% 21 5.0 4.2<br />
Standard Passenger lane with AIT 45% 18.9 2.4 7.9<br />
Special Assistance/Family Passenger Lane 5% 2.1 1.5 1.4<br />
Source:<br />
Ross & Baruzzini<br />
17.2<br />
15.8<br />
13.5<br />
Table 3.2-9<br />
LANE REQUIREMENTS FOR PEAK HOUR LOAD PROCESSED IN 70 MINUTES –<br />
2030<br />
Expected Lane Requirements -2030<br />
DRAFT<br />
Percentage<br />
Total<br />
Passengers<br />
Expected<br />
Throughput<br />
Population in Pre✓/Trusted Traveler 10% 4.6 5.0 1<br />
Total<br />
Lanes<br />
Standard Passenger lane with AIT 85% 39.1 2.4 16.3<br />
Special Assistance/Family Passenger Lane 5% 2.3 1.5 1.6<br />
Expected lane Requirements – 2012<br />
Population in Pre✓/Trusted Traveler 25% 11.5 5.0 2.3<br />
Standard Passenger lane with AIT 70% 32.2 2.4 13.5<br />
Special Assistance/Family Passenger Lane 5% 2.3 1.5 1.6<br />
Expected lane Requirements – 2012<br />
Population in Pre✓/Trusted Traveler 50% 23 5.0 4.6<br />
Standard Passenger lane with AIT 45% 20.7 2.4 8.7<br />
Special Assistance/Family Passenger Lane 5% 2.3 1.5 1.6<br />
18.9<br />
17.4<br />
14.9<br />
Source:<br />
Ross & Baruzzini<br />
Landrum & Brown Page 64<br />
April 2013
KANSAS CITY NEW TERMINAL STUDY<br />
ADVANCE TERMINAL PLANNING STUDY<br />
PROGRAM CRITERIA DOCUMENT<br />
DRAFT<br />
Based upon the calculations, it is apparent that the quantity of SSCP lanes required<br />
can vary widely. However, looking at the 2012 Total Lane requirements (using the<br />
adjusted throughput as a basis) for a ten percent Pre✓ population and the 2030<br />
Total Lane Requirements for a 50-percent Pre✓ population, it is expected that the<br />
SSCP lane quantities would be close to being the same. Based upon the<br />
calculations, approximately 15 lanes would be required at peak times if the overall<br />
processing of the peak hour is allowed to extend to approximately 70 minutes.<br />
The current recommendation of 16 lanes allows a buffer for equipment maintenance<br />
and failure, unscheduled excess traffic, and other unforeseen circumstances.<br />
Another aspect to consider is the advancement of technology and passenger<br />
familiarity with the process for that equipment. While the AIT units have been in<br />
use for several years as specific facilities, the implementation of these units at all<br />
airports is still on-going. The metrics used in this calculation are based upon<br />
observed passenger throughputs on the existing equipment at the existing facilities.<br />
Over time, it would be expected that the screening time per passenger would go<br />
down based upon familiarity with the process, allowing for a higher PPM metric for<br />
the standard passenger screening. Also, the advancement in screening equipment<br />
such as LED could also negate the requirement to remove liquids, aerosols, and<br />
gels from baggage for screening, reducing the time required for screening.<br />
These factors, in conjunction with customer service metrics for allowable screening<br />
wait times, should be considered when determining the total quantity of SSCP lanes<br />
required.<br />
3.2.4.4 Employee Screening<br />
DRAFT<br />
All of the discussion above was based upon loadings for screening of passengers<br />
only. Another factor to consider is the screening of employees including airline<br />
ramp workers, airline customer service representatives, flight crews, and tenant<br />
and concession personnel. At the present time, the screening of employees that<br />
have Secure Identification Display Area (SIDA) or Secure Area badges through<br />
security screening checkpoint type of equipment is not mandated. There has been<br />
much discussion of implementing requirements of this type, so this should be<br />
considered as part of the overall exercise.<br />
For purposes of this document, the overall population will be considered to be<br />
approximately ten percent of the passenger load. Based upon practices at other<br />
airports, there are several different scenarios that can be considered. Many of<br />
these scenarios will need to be vetted against the staffing plan for the TSA or<br />
checkpoint screening company to compare the impact that each scenario would<br />
have on the overall staffing requirements.<br />
Remote Employee Screening: Several airports such as Denver International Airport<br />
or Atlanta Hartsfield (ATL) have remote employee entry points in remote parking<br />
areas. The employee is vetted upon entry into the parking area. At DIA, the<br />
employee enters a building in the parking area and gains entry to a bus<br />
transportation area by use of the Access Control System that includes biometric<br />
verification. This facility also has SSCP lanes, and random employees are selected<br />
for screening. However, if full employee screening were mandated, this facility<br />
Landrum & Brown Page 65<br />
April 2013
KANSAS CITY NEW TERMINAL STUDY<br />
ADVANCE TERMINAL PLANNING STUDY<br />
PROGRAM CRITERIA DOCUMENT<br />
DRAFT<br />
could be used to screen all employees prior to allowing them to board a bus that<br />
drops the employees on the airside of the airport. This process allows for the<br />
employees to be screened in a separate area from the traveling public, but does not<br />
allow for the easy sharing of screening personnel between the employee SSCP and<br />
the traveling public SSCP.<br />
Separate Employee Screening: Airports such as Chicago O’Hare Airport (ORD)<br />
utilizes employee SSCPs that are located between the traveling public checkpoints.<br />
These allow for employees or goods to be screened, but not in a shared<br />
environment as the traveling public. However, as these SSCPs are in close<br />
proximity to the traveling public SSCPs, the sharing of screening personnel is easily<br />
accomplished. Also, as this configuration is usually from public to sterile, all<br />
badged employees including sterile area personnel or airline crews would be able to<br />
be processed through this SSCP. This would remove the common disruption caused<br />
by these personnel passing through the traveling public SSCP.<br />
Screening of employees through the traveling public SSCPs: At many airports,<br />
employees that need to pass from public to sterile are required to be screened<br />
through a traveling public SSCP. While this does maximize the efficiency of the<br />
screening staff, it is not ideal from a customer service point of view and can be<br />
disruptive to the passenger screening process.<br />
In order to maximize the efficiency of the screening staff utilization and also<br />
maintain high service levels for the traveling public, it is recommended that the<br />
process for screening employees and goods be planned and space allocated for<br />
screening locations separate from the primary passenger SSCPs, even if these are<br />
not implemented on day one. (See Table 3.2-10, Employee/Crew Screening).<br />
Table 3.2-10<br />
EMPLOYEE/CREW SCREENING<br />
DRAFT<br />
Employee Crew Quantities Year 2012 Year 2025 Year 2030<br />
10% of Passenger Loading – Peak Hour 228.4 292.3 320.1<br />
Employee/Crew Per Minute 3.8 4.9 5.3<br />
Source:<br />
Ross & Baruzzini<br />
Based on using a ten percent of passenger loading factor, and assuming that the<br />
employee/crew screening process will be similar to the Trusted Traveler and Known<br />
Crewmember process, the recommendation is to provide two SSCP lanes. For the<br />
initial build-out, only one SSCP lane may be required to be staffed. However, for<br />
redundancy of equipment, having two SSCP lanes would ensure that a single<br />
equipment failure would not shut down the employee screening area.<br />
Goods Screening: In order to make the best use of personnel, it would be<br />
recommended that the design include provisions for goods screening at the<br />
employee/crew area or in an area adjacent to this SSCP. Goods screening usually<br />
entails a large, pallet style screening device to check for contraband or weapons in<br />
goods being delivered for concessions. In many cases, personnel are required to<br />
Landrum & Brown Page 66<br />
April 2013
KANSAS CITY NEW TERMINAL STUDY<br />
ADVANCE TERMINAL PLANNING STUDY<br />
PROGRAM CRITERIA DOCUMENT<br />
DRAFT<br />
pass from public to sterile as part of the screening, which can require the screening<br />
of employees as part of the goods screening process. In some cases, the screening<br />
is conducted by the screening personnel and goods are stored in locked areas on<br />
both sides. If this is the case, the plan would require the implementation of locked<br />
areas on the public side and sterile side for storage of the goods. Also, as many<br />
items are refrigerated or frozen, these storage areas would require refrigerated or<br />
frozen storage areas.<br />
The screening personnel are used not only for the traveling public SSCP, they are<br />
also utilized in the Check Baggage Screening areas to perform ETD and searches in<br />
the Level 3 screening areas as well as possibly staff employee, crew, and goods<br />
screening areas. Accounting for these functions as part of the initial design and<br />
providing a means for these personnel to transit directly from the various areas to<br />
other areas will significantly increase the efficiency and utilization of the screening<br />
personnel. In some newer facilities, these types of areas have been stacked<br />
vertically and dedicated stairs have been provided to allow direct access between<br />
these areas. Inclusion of these vertical circulation routes in the initial design and<br />
accounting for any access control or other surveillance required as part of these<br />
elements will simplify any future implementations or changes in security for the life<br />
of the facility.<br />
3.2.4.5 Conclusion<br />
In order to ensure long-term viability of the SSCP space or spaces, it is important<br />
to plan sufficient space for not only upcoming equipment, but also for a sufficient<br />
quantity of SSCP lanes. Other facilities that have been constructed or renovated<br />
since the creation of the TSA have provided screening spaces that included space<br />
for future SSCP lanes. While not all of the SSCP lanes may be implemented on day<br />
one, allocating the space to add SSCP lanes facilitates future expansion, as well as<br />
allowing for the implementation of newer generations of screening equipment,<br />
without necessarily requiring the removal of the existing equipment. This flexibility<br />
will serve the Airport well and allow for a more seamless operation in the future.<br />
DRAFT<br />
3.2.5 SUMMARY OF TERMINAL BUILDING REQUIREMENTS<br />
KCI’s <strong>Terminal</strong> Improvement <strong>Program</strong> (TIP), which was completed in 2004,<br />
renovated and added holdroom space, restrooms within the secured holdrooms,<br />
and included all new mechanical and electrical systems. Even after the program<br />
was completed, merging airlines, reduced flight schedules, and inefficient<br />
operations and aging infrastructure make interoperation between the three<br />
terminals increasingly difficult. A replacement terminal is necessary to supplant the<br />
aging infrastructure of the three terminals and their increasing functional<br />
obsolescence. It should be noted that the future program assumes greater<br />
efficiencies through consolidation of the functions into one terminal that are<br />
replicated in the current operational layouts of the three terminals. This reduces<br />
the overall gross terminal area need.<br />
Landrum & Brown Page 67<br />
April 2013
KANSAS CITY NEW TERMINAL STUDY<br />
ADVANCE TERMINAL PLANNING STUDY<br />
PROGRAM CRITERIA DOCUMENT<br />
DRAFT<br />
KCI currently has a gross terminal area of approximately 1,105,100 square<br />
feet. The existing recommended facilities for 2012 require a gross terminal area of<br />
864,400 square feet indicating the current facilities are oversized for the current<br />
level of peak hour activity. There are exceptions to this assessment. Certain areas<br />
of the terminals require additional space to meet demand requirements, such as<br />
the operational layouts of the holdroom areas, security, secure concessions and<br />
circulation areas, baggage claim circulation, integration of checked baggage<br />
screening into the baggage handling system, and some individual airline operations<br />
space.<br />
The new terminal program is split into two planning implementation levels for 2025<br />
and 2030 as seen in Table 3.2-11.<br />
Table 3.2-11<br />
SUMMARY OF THE TERMINAL AREA PROGRAM<br />
Aircraft Parking Positions<br />
Forecast Year<br />
2025 2030<br />
Total Functional <strong>Terminal</strong> Area 791,270 884,470<br />
Total Gross <strong>Terminal</strong> Area 912,470 1,020,870<br />
Sources:<br />
<strong>Terminal</strong> Area <strong>Program</strong> / Landrum & Brown<br />
The future program requirements have been shown to be less than the current<br />
aggregated terminal area of the existing three terminals, indicating an excess of<br />
throughout the projected future. Since that the gross terminal area of the existing<br />
facilities is spread over three separate terminals, many of the future program<br />
requirement improvements cannot be easily met through expansion or contractions<br />
of the current terminal design with its concrete structure and narrow width hemmed<br />
in on the airside by existing gates and on the landside by existing curb, roadways<br />
and structured parking. Many factors, including airline consolidation, aging<br />
facilities, and difficulties in interoperability among multiple processors, have led to<br />
the recommendation that a new single consolidated terminal with expansion<br />
capabilities is the preferred choice to meet the <strong>Advance</strong> <strong>Terminal</strong> <strong>Planning</strong> project<br />
goals.<br />
DRAFT<br />
3.3 Concessions Requirements<br />
This section highlights current features of the concession program at the Airport<br />
which will be beneficial to the Airport operators when the time comes to develop a<br />
thriving concessions program in the New <strong>Terminal</strong>. Also discussed are some of the<br />
features that should be included in the future concessions program.<br />
Landrum & Brown Page 68<br />
April 2013
KANSAS CITY NEW TERMINAL STUDY<br />
ADVANCE TERMINAL PLANNING STUDY<br />
PROGRAM CRITERIA DOCUMENT<br />
DRAFT<br />
3.3.1 EXISTING AIRPORT RETAIL PROGRAM REVIEW<br />
The historical financial performance of the concession program at KCI was reviewed<br />
for the past two fiscal years. Although the future concession program will be<br />
substantially different, it is important to consider the performance of the existing<br />
concessions as indicators of consumer preferences and behavior that may affect<br />
future development. Table 3.3-1, Airport Space by Location, presents a<br />
summary of the existing concession space in the three terminals at the Airport by<br />
type and location.<br />
Table 3.3-1<br />
AIRPORT CONCESSION SPACE BY LOCATION (SQ. FT.)<br />
Food Service<br />
Retail<br />
<strong>Terminal</strong> A <strong>Terminal</strong> B <strong>Terminal</strong> C Total Airport<br />
Space<br />
% of<br />
Total<br />
Space<br />
% of<br />
Total<br />
Space<br />
% of<br />
Total<br />
Space<br />
% of<br />
Total<br />
Airside 72 1% 408 2% 172 3% 652 2%<br />
Landside 4,720 75% 14,998 75% 4,234 71% 23,952 75%<br />
Total Food<br />
Service<br />
4,792 76% 15,406 78% 4,406 74% 24,604 77%<br />
Airside - 0% - 0% 82 1% 82 0%<br />
Landside 1,498 24% 4,469 22% 1,489 25% 7,456 23%<br />
Total Retail 1,498 24% 4,469 22% 1,571 26% 7,538 23%<br />
Total<br />
Concession<br />
Space<br />
Source:<br />
DRAFT<br />
6,290 100% 19,875 100% 5,977 100% 32,142 100%<br />
Kansas City Aviation Department<br />
The concessions area in the three terminals currently includes over 32,000 square<br />
feet. Approximately 730 square feet is allocated to concessions in the post-security<br />
areas of the terminals. Pre-security concessions account for 98 percent of the<br />
concession space, which is unusual in comparison with other U.S. airports.<br />
Over 60 percent of the concession space at KCI is located in <strong>Terminal</strong> B. In each of<br />
the three terminals, nearly three-fourths of the concession space is allocated to<br />
food service concessions. The remaining concession space is primarily allocated to<br />
convenience retail stores, with three exceptions on Concourse B: PGA Tour Shop;<br />
Babies on the Go, that offers diapers, baby wipes, snacks and other products<br />
targeted towards parents with infants; and a shoeshine stand and Shine on the Go.<br />
Figure 3.3-1, Food Service Concession Space And Gross Sales, FY 2011, and<br />
Figure 3.3-2, Retail Concession Space And Gross Sales, FY 2011, show the<br />
concession space allocated and the gross sales generated, by concession type.<br />
Generally, concession space and gross sales are closely correlated, although the<br />
<strong>Terminal</strong> C concessions produce a higher percentage of both food service and retail<br />
sales than the percentage of space allocated for each category.<br />
Landrum & Brown Page 69<br />
April 2013
KANSAS CITY NEW TERMINAL STUDY<br />
ADVANCE TERMINAL PLANNING STUDY<br />
PROGRAM CRITERIA DOCUMENT<br />
DRAFT<br />
Figure 3.3-1<br />
FOOD SERVICE CONCESSION SPACE AND GROSS SALES, FY 2011<br />
70%<br />
60%<br />
50%<br />
40%<br />
63%<br />
59%<br />
30%<br />
20%<br />
19%<br />
18%<br />
18%<br />
24%<br />
10%<br />
0%<br />
Note:<br />
Source:<br />
Fiscal year sales are estimates based on CY10 and CY11 data.<br />
Kansas City Aviation Department; HMSHost<br />
Figure 3.3-2<br />
RETAIL CONCESSION SPACE AND GROSS SALES, FY 2011<br />
70%<br />
60%<br />
50%<br />
<strong>Terminal</strong> A <strong>Terminal</strong> B <strong>Terminal</strong> C<br />
% of Total Concession Space % of Total Sales<br />
DRAFT<br />
59%<br />
52%<br />
40%<br />
30%<br />
20%<br />
20%<br />
16%<br />
21%<br />
32%<br />
10%<br />
0%<br />
<strong>Terminal</strong> A <strong>Terminal</strong> B <strong>Terminal</strong> C<br />
% of Total Concession Space % of Total Sales<br />
Source:<br />
Kansas City Aviation Department; The Paradies Shops<br />
Landrum & Brown Page 70<br />
April 2013
KANSAS CITY NEW TERMINAL STUDY<br />
ADVANCE TERMINAL PLANNING STUDY<br />
PROGRAM CRITERIA DOCUMENT<br />
DRAFT<br />
Table 3.3-2, Concession Productivity, Fiscal Years 2010-2011, lists a<br />
summary of food service and retail concession sales, and productivity statistics for<br />
fiscal years 2010 and 2011. Table 3.3-3, Revenue to KCAD, Years Ending<br />
April 30, presents a summary of revenue for years 2010 and 2011.<br />
Table 3.3-2<br />
CONCESSION PRODUCTIVITY, FISCAL YEARS 2010-2011<br />
Food Service<br />
Source:<br />
Sales<br />
Sales/<br />
Enplanement<br />
Square<br />
Feet<br />
Kansas City Aviation Department; HMSHost; The Paradies Shops<br />
Table 3.3-3<br />
REVENUE TO KCAD, YEARS ENDING APRIL 30<br />
Square Feet/<br />
Thousand<br />
Enplanements<br />
Note: Concession sales estimates are by fiscal year (ending June 30)<br />
Source: Kansas City Aviation Department; HMSHost; The Paradies Shops<br />
Sales/<br />
Square Foot<br />
2011 $ 18,525,769 $ 3.71 24,604 4.92 $ 753<br />
2010 $ 17,717,169 $ 3.58 24,604 4.97 $ 720<br />
Total Retail<br />
2011 $ 6,163,465 $ 1.23 7,538 1.51 $ 818<br />
2010 $ 5,917,456 $ 1.20 7,538 1.52 $ 785<br />
Total<br />
2011 $ 24,689,234 $ 4.94 32,142 6.43 $ 768<br />
2010 $ 23,634,625 $ 4.78 32,142 6.50 $ 735<br />
Food Service<br />
Retail<br />
DRAFT<br />
2010 2011<br />
Sales $ 18,345,719 $ 19,248,041<br />
Revenue to the KCAD $ 1,625,321 $ 1,763,036<br />
Effective Rent Percentage 8.9% 9.2%<br />
Sales $ 5,529,380 $ 6,472,213<br />
Revenue to the KCAD $ 777,780 $ 963,758<br />
Effective Rent Percentage 14.1% 14.9%<br />
Landrum & Brown Page 71<br />
April 2013
KANSAS CITY NEW TERMINAL STUDY<br />
ADVANCE TERMINAL PLANNING STUDY<br />
PROGRAM CRITERIA DOCUMENT<br />
DRAFT<br />
3.3.2 COMPARABLE AIRPORT CONCESSION PERFORMANCE<br />
In order to gauge the general performance of KCI’s concession program, the<br />
concession performance was examined at ten airports of similar size to KCI as listed<br />
in Table 3.3-4, Comparable Airports.<br />
Table 3.3-4<br />
COMPARABLE AIRPORTS<br />
IATA Code<br />
Source:<br />
SMF<br />
BNA<br />
OAK<br />
MKE<br />
MEM<br />
YYC<br />
STL<br />
PDX<br />
SAN<br />
YUL<br />
AirProjects, Inc.<br />
Airport Name<br />
Sacramento International<br />
Nashville International<br />
Oakland International<br />
General Mitchell International (Milwaukee)<br />
Memphis International<br />
Calgary International<br />
Lambert-St. Louis International<br />
Portland International<br />
San Diego International<br />
Montreal-Trudeau International<br />
Figure 3.3-3, Concession Space by Type, 2010, shows a comparison of the<br />
total food service and retail concession space for each airport listed in Table 3.3-4.<br />
DRAFT<br />
Figure 3.3-3<br />
CONCESSION SPACE BY TYPE, 2010<br />
Source:<br />
Airport Revenue News Fact Book 2011; compiled by AirProjects, Inc.<br />
Landrum & Brown Page 72<br />
April 2013
KANSAS CITY NEW TERMINAL STUDY<br />
ADVANCE TERMINAL PLANNING STUDY<br />
PROGRAM CRITERIA DOCUMENT<br />
DRAFT<br />
KCI has approximately 24,600 square feet of food service concession space, which<br />
is the second lowest amount among the comparable airports and well below the<br />
37,700-square foot average. The food service space allocated at KCI is<br />
approximately 4.9 square feet per 1,000 enplaning passengers, which is well below<br />
the average of 6.6 square feet per 1,000 enplaning passengers at the comparable<br />
airports. The total retail concession space allocated at KCI is approximately<br />
7,500 square feet, which is the least of any of the comparable airports. This retail<br />
space allocation is approximately 1.5 square feet of space per 1,000 enplaning<br />
passengers. This per-passenger space allocation for retail is well below the average<br />
for the comparable airports of 3.9 square feet per 1,000 enplaning passengers.<br />
Table 3.3-5, Food Service Concession Productivity, 2010, and Table 3.3-6,<br />
Retail Concession Productivity, 2010, summarize the productivity of the food<br />
service and retail concessions among the comparable airports by comparing the<br />
sales per enplanement and sales per square foot.<br />
Table 3.3-5<br />
FOOD SERVICE CONCESSION PRODUCTIVITY, 2010<br />
Airport Sales/Epax Sales/SqFt<br />
Kansas City International $ 3.71 $ 753<br />
Oakland International $ 4.57 $ 1,099<br />
General Mitchell International $ 4.66 $ 649<br />
Lambert-St. Louis International $ 4.72 $ 581<br />
DRAFT<br />
Sacramento International $ 4.77 $ 792<br />
Nashville International $ 4.95 $ 816<br />
San Diego International $ 5.29 $ 1,288<br />
Memphis International $ 5.59 $ 627<br />
Portland International $ 5.76 $ 746<br />
Montreal-Trudeau International $ 6.95 $ 835<br />
Calgary International $ 7.15 $ 1,027<br />
Note: Kansas City International productivity data is for FY 2011.<br />
Source: Airport Revenue News Fact Book 2011; compiled by AirProjects, Inc.<br />
Landrum & Brown Page 73<br />
April 2013
KANSAS CITY NEW TERMINAL STUDY<br />
ADVANCE TERMINAL PLANNING STUDY<br />
PROGRAM CRITERIA DOCUMENT<br />
DRAFT<br />
Table 3.3-6<br />
RETAIL CONCESSION PRODUCTIVITY, 2010<br />
Airport Sales/Epax Sales/SqFt<br />
Kansas City International $ 1.23 $ 818<br />
Oakland International $ 2.10 $ 431<br />
General Mitchell International $ 2.19 $ 1,351<br />
Lambert-St. Louis International $ 2.36 $ 780<br />
Sacramento International $ 2.44 $ 896<br />
Nashville International $ 2.76 $ 1,614<br />
San Diego International $ 3.01 $ 730<br />
Memphis International $ 3.05 $ 741<br />
Portland International $ 4.36 $ 498<br />
Montreal-Trudeau International $ 4.79 $ 851<br />
Calgary International $ 5.00 $ 1,158<br />
Note: Kansas City International productivity data is for FY 2011.<br />
Source: Airport Revenue News Fact Book 2011; compiled by AirProjects, Inc.<br />
For both food service and retail concessions, KCI lags behind the comparable<br />
airports in terms of productivity as measured by sales per enplanement. Sales per<br />
square foot at the Airport are slightly below the average for the comparable airports<br />
for food service, but slightly above the average for retail productivity. High sales<br />
per square foot do not necessarily imply a successful concession program. It may<br />
also suggest that there is inadequate concession space, which negatively impacts<br />
customer service, product variety, and concession sales and revenue.<br />
DRAFT<br />
Figure 3.3-4, Total Revenue Versus Enplaned Passengers, 2010, shows a<br />
comparison of total concession rental revenue earned by each of the comparable<br />
airport operators versus the number of enplaned passengers at that airport for<br />
2010.<br />
Landrum & Brown Page 74<br />
April 2013
KANSAS CITY NEW TERMINAL STUDY<br />
ADVANCE TERMINAL PLANNING STUDY<br />
PROGRAM CRITERIA DOCUMENT<br />
DRAFT<br />
Figure 3.3-4<br />
TOTAL REVENUE VERSUS ENPLANED PASSENGERS, 2010<br />
$10,000,000<br />
SAN<br />
Total Rent Revenue<br />
$9,000,000<br />
$8,000,000<br />
$7,000,000<br />
$6,000,000<br />
$5,000,000<br />
$4,000,000<br />
SMF<br />
MKE<br />
OAK<br />
YYC<br />
PDX<br />
Note:<br />
Source:<br />
$3,000,000<br />
MCI<br />
$2,000,000<br />
4,000,000 6,000,000 8,000,000<br />
Enplanements<br />
KCI data is for FY 2011; revenue data for BNA, MEM, STL and YUL were unavailable.<br />
Airport Revenue News Fact Book 2011; compiled by AirProjects, Inc.<br />
Among the comparable airports, the concessions at KCI produce significantly less<br />
revenue. This may be explained, at least in part, by the fact that the Airport has<br />
the lowest percentage rent for its concessions among those airports for which data<br />
was available (rent revenue data was not available for all comparable airport<br />
concession programs). Table 3.3-7, Total Concession Sales and Effective<br />
Percentage Rent, 2010, shows the food service, retail concessions, and total<br />
concession sales combined effective percentage rent at the comparable airports.<br />
DRAFT<br />
Table 3.3-7<br />
TOTAL CONCESSION SALES AND EFFECTIVE PERCENTAGE RENT, 2010<br />
Airport Total Sales ($m) Effective %<br />
Kansas City International $ 24.7 11.0%<br />
Sacramento International $ 34.5 14.5%<br />
Nashville International $ 36.2 NA<br />
Oakland International $ 32.2 13.7%<br />
General Mitchell International $ 34.5 15.0%<br />
Memphis International $ 38.0 NA<br />
Calgary International $ 75.4 11.6%<br />
Lambert-St. Louis International $ 46.8 NA<br />
Portland International $ 70.9 12.6%<br />
San Diego International $ 68.1 14.4%<br />
Montreal-Trudeau International $ 73.0 NA<br />
Note: Kansas City International data is for FY 2011.<br />
Source: Airport Revenue News Fact Book 2011; compiled by AirProjects, Inc.<br />
Landrum & Brown Page 75<br />
April 2013
KANSAS CITY NEW TERMINAL STUDY<br />
ADVANCE TERMINAL PLANNING STUDY<br />
PROGRAM CRITERIA DOCUMENT<br />
DRAFT<br />
Although the total effective concession rent is not significantly below those at the<br />
comparable airports, the food service effective rent is quite a bit lower. In FY 2011,<br />
the food service effective percentage rent at KCI was 9.1 percent, which was<br />
approximately 3.3 percent less than the average food service effective rent for the<br />
comparable airports. Conversely, the 15.6 percent, effective rent for the retail<br />
concessions at the Airport is higher than the 13.8 percent average among the<br />
comparable airports.<br />
3.3.3 MARKET RESEARCH<br />
3.3.3.1 Market Overview<br />
The Kansas City metropolitan statistical area (MSA), as defined by the U.S. Census<br />
Bureau, is a fifteen-county metropolitan area, anchored by Kansas City, Missouri,<br />
that spans the border between Missouri and Kansas. The MSA population was<br />
estimated at 2,487,526 in 2011. It is the second largest metropolitan area in<br />
Missouri after Greater St. Louis and is the largest MSA in Kansas. The MSA includes<br />
a number of suburbs, including Independence, Missouri; Kansas City, Kansas;<br />
Olathe, Kansas; and Overland Park, Kansas. The median household income for the<br />
Kansas City MSA in 2011 was estimated at $51,095 and the average household<br />
income in 2011 was $66,296. Figure 3.3-5, Kansas City MSA Current<br />
Population by Age, shows that almost 50 percent of the population is under the<br />
age of 34.<br />
Figure 3.3-5<br />
KANSAS CITY MSA CURRENT POPULATION BY AGE<br />
DRAFT<br />
Age 55-64,<br />
11.5%<br />
Over 65,<br />
12.3%<br />
Under 18,<br />
24.9%<br />
Age 45-54,<br />
14.4%<br />
Age 35-44,<br />
13.4%<br />
Age 25-34,<br />
13.9%<br />
Age 18-24,<br />
9.5%<br />
Source: Nielsen Pop-Facts Demographics, 2011<br />
Landrum & Brown Page 76<br />
April 2013
KANSAS CITY NEW TERMINAL STUDY<br />
ADVANCE TERMINAL PLANNING STUDY<br />
PROGRAM CRITERIA DOCUMENT<br />
DRAFT<br />
Per capita income in the Kansas City MSA rose sharply in the early 2000’s, peaked<br />
in 2008, fell during the 2008-2009 recession, and has since started to recover, as<br />
shown in Figure 3.3-6, Kansas City MSA Per Capita Income Since 2000.<br />
Figure 3.3-6<br />
KANSAS CITY MSA PER CAPITA INCOME SINCE 2000<br />
Source:<br />
DRAFT<br />
U.S. Department of Commerce; Bureau of Economic Analysis<br />
Landrum & Brown Page 77<br />
April 2013
KANSAS CITY NEW TERMINAL STUDY<br />
ADVANCE TERMINAL PLANNING STUDY<br />
PROGRAM CRITERIA DOCUMENT<br />
DRAFT<br />
The population of the Kansas City MSA over the age of 25 tends to achieve a higher<br />
level of education than that of the entire U.S., as shown in Figure 3.3-7,<br />
Educational attainment, Kansas City MSA.<br />
Figure 3.3-7<br />
EDUCATIONAL ATTAINMENT, KANSAS CITY MSA<br />
50.0%<br />
45.0%<br />
40.0%<br />
35.0%<br />
30.0%<br />
25.0%<br />
20.0%<br />
15.0%<br />
10.0%<br />
5.0%<br />
0.0%<br />
Source:<br />
High School<br />
Diploma or<br />
less<br />
Some<br />
College<br />
U.S. Census Bureau<br />
Figure 3.3-8, Cost of Living Index, displays the cost of living in major<br />
metropolitan areas in the U.S. for the second quarter of 2011. The cost of living in<br />
the Kansas City region is slightly below the national average, which adds to its<br />
attractiveness as a place to live.<br />
Figure 3.3-8<br />
COST OF LIVING INDEX<br />
180<br />
160<br />
140<br />
120<br />
100<br />
80<br />
60<br />
40<br />
20<br />
0<br />
College<br />
Degree<br />
Graduate or<br />
Professional<br />
Degree<br />
KC MSA<br />
DRAFT<br />
US<br />
Source:<br />
The Council for Community and Economic Research<br />
Landrum & Brown Page 78<br />
April 2013
KANSAS CITY NEW TERMINAL STUDY<br />
ADVANCE TERMINAL PLANNING STUDY<br />
PROGRAM CRITERIA DOCUMENT<br />
DRAFT<br />
Per capita retail sales in Kansas City are well above the U.S. average, better than<br />
many major metropolitan areas, as shown in Figure 3.3-9, Per Capita Retail<br />
Sales. This sales statistic is an indicator that KCI travelers may have a strong<br />
propensity to dine and shop at the Airport if an appealing concession program were<br />
available.<br />
Figure 3.3-9<br />
PER CAPITA RETAIL SALES<br />
$16,000<br />
$14,000<br />
$12,000<br />
$10,000<br />
$8,000<br />
$6,000<br />
$4,000<br />
$2,000<br />
Source:<br />
www.kcmo.org<br />
3.3.3.2 Population Characteristics<br />
Because approximately 62 percent of the passengers using the Airport are Kansas<br />
City residents, local population characteristics and lifestyle trends were researched<br />
to gain insights into the retail preferences and purchasing patterns of the Airport’s<br />
passenger base. The following are some of the more pertinent results of this<br />
research.<br />
Compared to the U.S. population, Kansas City residents are:<br />
<br />
<br />
<br />
<br />
<br />
<br />
$0<br />
DRAFT<br />
slightly less likely to eat gourmet foods whenever possible, try new food<br />
products, or eat healthy<br />
slightly more likely to drink micro-brewed beer or light beer<br />
seven percent less likely to drink low or non-alcoholic beer<br />
between six and seven percent less likely to drink upscale alcoholic<br />
beverages, such as cognac, brandy, Armagnac, or Scotch whiskey<br />
more likely to drink domestic wine and beer than imported wine and beer<br />
slightly less likely to have a budget that allows for the purchase of designer<br />
clothes, or to keep up with the latest fashions<br />
Landrum & Brown Page 79<br />
April 2013
KANSAS CITY NEW TERMINAL STUDY<br />
ADVANCE TERMINAL PLANNING STUDY<br />
PROGRAM CRITERIA DOCUMENT<br />
DRAFT<br />
<br />
<br />
<br />
<br />
<br />
<br />
<br />
<br />
more likely to spend over $400 per year on children’s clothing<br />
slightly more likely to own multiple personal computers and Apple personal<br />
computers<br />
slightly less likely to be the first to have new electronic equipment<br />
slightly more likely to have gone on-line in the last month to make a<br />
purchase or gather shopping information<br />
slightly less likely to state that the Internet is their primary entertainment<br />
source or to play online games<br />
more likely to include power boating (five percent greater), bowling (two<br />
percent greater), and weight training (two percent greater) activities<br />
slightly less likely to belong to an environmental organization<br />
slightly less likely to be willing to pay higher prices for environmentallyfriendly<br />
products<br />
The overall implications of this data are that the Kansas City area residents are<br />
fairly conservative regarding the adoption of fashion and food trends and do not<br />
travel frequently. It should be noted, though, that Kansas City is known for its<br />
barbeque, and is the home of many renowned restaurants. Residents enjoy good,<br />
freshly-prepared food, and high-quality food that may not be widely considered<br />
“gourmet” or “healthy.” The research suggests that restaurants that focus on<br />
familiar foods and domestic beverages would tend to be more successful.<br />
3.3.3.3 Possible Concessions at the Airport<br />
The Kansas City area is home to numerous shopping venues, ranging from upscale,<br />
boutique-focused venues to those that cater to big-box and discount operations.<br />
Some of the area’s significant shopping destinations are:<br />
<br />
<br />
<br />
DRAFT<br />
Country Club Plaza - A shopping, dining, and entertainment district<br />
encompassing a 15-block area and encompasses over 150 shops and dozens<br />
of restaurants. Shops range from nationally-known high fashion retailers to<br />
local favorites. Food offerings range from sports bars to upscale fine local<br />
dining to nationally known chain restaurants. The venue also features a wide<br />
variety of specialty food offerings, including coffee, chocolate, and cupcakes.<br />
Oak Park Mall - one of the region’s largest indoor shopping centers, featuring<br />
a wide variety of over 170 specialty shops as well as department store<br />
anchor tenants located in Overland Park.<br />
Zona Rosa - one of the region’s premier outdoor shopping, dining, and<br />
entertainment destinations, featuring both nationally- and locally-owned<br />
venues, offering patrons a superb variety of shopping and dining<br />
experiences.<br />
Landrum & Brown Page 80<br />
April 2013
KANSAS CITY NEW TERMINAL STUDY<br />
ADVANCE TERMINAL PLANNING STUDY<br />
PROGRAM CRITERIA DOCUMENT<br />
DRAFT<br />
The Kansas Legends Outlet Center - offers both shopping and educational /<br />
entertainment options honoring famous Kansans in athletics, music,<br />
exploration, science, technology, politics, art, and much more, recognizing<br />
the men and women who truly make the state unique. The Center features a<br />
diverse mix of outlet-type stores and is also home to some unique offerings.<br />
<br />
<br />
Crown Center - often called a city within a city, located in the heart of<br />
downtown Kansas City, with three levels of great shopping and dining that<br />
complement two luxury hotels, multiple office buildings, a residential<br />
community, and several entertainment attractions. It surrounds the<br />
worldwide headquarters of Hallmark Cards, Inc. and also offers unique<br />
shopping opportunities.<br />
Brookside - A destination venue for people seeking unique dining and unique<br />
and ethnic shopping experiences, located just south of Country Club Plaza.<br />
The diversity and creativity of the Kansas City region’s shopping and dining venues<br />
provide substantial opportunities from which to acquire and adapt ideas for<br />
developing a unique concession experience in the new <strong>Terminal</strong> at KCI. Many of<br />
these venues have unique products and would allow for significant participation by<br />
local business owners. Incorporating such ideas into the Airport’s concession<br />
program could allow the Airport to showcase local businesses and significantly<br />
increase its non-aviation revenue, which, in turn, would be a support to the<br />
community.<br />
The following businesses are headquartered in the Kansas City region or have<br />
significant ties to the area. The businesses presented highlight some locally-based<br />
or known vendors that could enhance the concession program and provide a deeper<br />
awareness and appreciation of Kansas City region. Some of these businesses<br />
already operate retail concepts, while others would need to develop a retail<br />
concept, if interested.<br />
<br />
<br />
<br />
<br />
<br />
<br />
DRAFT<br />
AMC Theaters - the second largest movie theater chain in North America<br />
Applebee’s Restaurants - which already has an airport operation at Richmond<br />
International Airport<br />
Garmin - the world’s largest manufacturer of GPS devices and headquartered<br />
in Olathe<br />
Hallmark Cards - the largest producer of greeting cards in the U.S., also has<br />
a retail business under the Hallmark Crown brand<br />
National Association of Intercollegiate Athletics (NAIA) - an athletic<br />
association that organizes college and university-level athletic programs<br />
(membership includes smaller colleges and universities across the U.S. and<br />
Canada)<br />
Russell Stover Candies - a family-owned confectionary company that owns<br />
both its own and the Whitman’s brand, and operates over 40 retail stores,<br />
besides wholesaling its products to a multitude of shops and stores.<br />
Landrum & Brown Page 81<br />
April 2013
KANSAS CITY NEW TERMINAL STUDY<br />
ADVANCE TERMINAL PLANNING STUDY<br />
PROGRAM CRITERIA DOCUMENT<br />
DRAFT<br />
<br />
<br />
Sprint-Nextel Corporation - operates the third-largest wireless telecommunications<br />
network in the U.S and also operates the Sprint Prepaid<br />
Group, which includes Boost Mobile and the Virgin Mobile USA brands.<br />
Wolferman’s Bakery - founded in Kansas City, but is now operated by Harry<br />
& David’s and offers a wide variety of baked goods, primarily through the<br />
Internet and catalogue retail outlets.<br />
One of the strongest ways to bring a local feel to an airport is to offer the brands<br />
and types of food for which the region is famous. Kansas City is most closely<br />
identified with barbeque. Currently, there are over 100 restaurants in the Kansas<br />
City area that specialize in this style of cooking, ranging from roadside stands to<br />
full-service establishments. The following list includes some of more widely-known<br />
brands that might be appropriate for the Airport.<br />
<br />
<br />
<br />
<br />
<br />
<br />
<br />
Fiorella’s Jack Stack Barbeque - has four locations in the Kansas City area<br />
Jack Stack’s - an upscale dining experience featuring all varieties of Kansas<br />
City barbeque and a wide variety of side dishes<br />
Zagat’s - at one point named Jack Stack’s the best barbeque in the U.S.<br />
Arthur Bryant’s Barbeque - Possibly the best known, using a combination of<br />
hickory and oak to achieve a unique flavor<br />
Gates Bar-B-Q – the sauce is not sweetened with molasses, unlike other<br />
Kansas City-style barbeque sauces<br />
Woodyard Bar-B-Que - is a working lumberyard and roadside barbecue amid<br />
storage complexes on the Kansas/Missouri border that uses a variety of<br />
different woods to achieve their unique flavor and is especially known for its<br />
“burnt end chili”<br />
Oklahoma Joe's Barbecue and Catering - received top honors at national<br />
barbeque contests as part of the Slaughterhouse Five pit master team and<br />
features antibiotic-free meats slow-cooked over white oak.<br />
Kansas City offers far more than great barbeque. There are a number of other<br />
well-known and well-respected local restaurants, such as:<br />
<br />
<br />
<br />
<br />
Bread and Butter Concepts<br />
Eggtc<br />
Chip’s Chocolate Factory<br />
The Roasterie<br />
There are a number of products that could be considered typical of the region, and<br />
could be favored by travelers seeking souvenirs of their visit. As the new terminal<br />
is developed, the possibility of establishing individual stores or retail merchandise<br />
units around one or more of these themes could be considered.<br />
<br />
<br />
DRAFT<br />
Wizard of Oz-themed merchandise<br />
Barbeque sauces, rubs, and accessories, featuring the products of Kansas<br />
City’s noted barbeque purveyors<br />
Landrum & Brown Page 82<br />
April 2013
KANSAS CITY NEW TERMINAL STUDY<br />
ADVANCE TERMINAL PLANNING STUDY<br />
PROGRAM CRITERIA DOCUMENT<br />
DRAFT<br />
<br />
<br />
<br />
<br />
<br />
Memorabilia from Kansas City’s professional sports teams<br />
Logo merchandise from the many universities in and around the Kansas City<br />
area<br />
Merchandise celebrating Kansas City’s noted and historic music culture and<br />
the American Jazz Museum<br />
Memorabilia based on the displays and the history of Kansas City’s Negro<br />
Leagues Baseball Museum<br />
A “legends” of Kansas City themed offering, building on the diverse collection<br />
of notable residents of the region and their contributions to all aspects of<br />
modern American culture and life<br />
In addition to the large corporations in the region that may offer opportunities for<br />
locally-branded operations at the Airport, there are many smaller, locally-known<br />
retailers that could help make the Airport’s concession program unique.<br />
<br />
<br />
<br />
<br />
<br />
Stuff<br />
The Vintage Market<br />
The (NEW) Dime Store<br />
Gifted Hands Gift Shop<br />
Indigo Wild<br />
3.4 Specialty Systems and New Technology<br />
DRAFT<br />
3.4.1 GENERAL REQUIREMENTS<br />
The New <strong>Terminal</strong> should be built based upon the objective of creating a modern,<br />
secure, and efficient airport terminal environment. Today’s Information and<br />
Communication Technology (ICT) has become one of the most valuable business<br />
enablers to create such environment. ICT permeates every aspect of<br />
communications, operations, and security. A properly planned technology<br />
environment provides reliable systems that reduce costs and provide enhanced<br />
services to airlines and passengers as well as operational efficiency and enhanced<br />
safety and security.<br />
The New <strong>Terminal</strong> systems should be designed to adapt to the ever-changing<br />
aviation operations and passenger requirements. The intent is to create systems<br />
that are capable of adapting to change with minimal disruption during transition<br />
from existing to new facilities. The overall concept is to standardize the equipment<br />
to the greatest extent possible; thus simplifying long-term support, maintenance,<br />
and operations. The infrastructure should provide fiber optic cabling throughout the<br />
New <strong>Terminal</strong> and associated facilities to allow for day one connectivity and<br />
sufficient extra capacity for future expansion.<br />
Landrum & Brown Page 83<br />
April 2013
KANSAS CITY NEW TERMINAL STUDY<br />
ADVANCE TERMINAL PLANNING STUDY<br />
PROGRAM CRITERIA DOCUMENT<br />
DRAFT<br />
3.4.1.1 Introduction<br />
Figure 3.4-1, <strong>Terminal</strong> Area Phasing Plan 2025, depicts the New <strong>Terminal</strong><br />
Concept Design.<br />
Figure 3.4-1<br />
TERMINAL AREA PHASING PLAN 2025<br />
DRAFT<br />
Source:<br />
Landrum & Brown<br />
One of the primary purposes for the infrastructure is to provide a redundant,<br />
available, and expandable communication backbone, both active and passive to<br />
support the Airport, key business partners, and tenants. The new passenger<br />
terminal building should include significant communications infrastructure including<br />
two properly sized Main Equipment Rooms (MERs) that will act as the terminal main<br />
equipment rooms and main connection points to airport-wide systems, which are<br />
presumed to be located in the two existing data centers on campus outside the new<br />
terminal project limits. The MERs should house all electronic equipment for ICT<br />
systems and should act as the main distribution facility to the various internal<br />
Telecommunication Rooms (TRs) within the PTB and its associated facilities.<br />
Landrum & Brown Page 84<br />
April 2013
KANSAS CITY NEW TERMINAL STUDY<br />
ADVANCE TERMINAL PLANNING STUDY<br />
PROGRAM CRITERIA DOCUMENT<br />
DRAFT<br />
The New <strong>Terminal</strong> should also contain numerous safety and security systems.<br />
Safety systems should include a fire alarm and its associated voice evacuation.<br />
Security systems should include:<br />
<br />
<br />
<br />
<br />
<br />
<br />
<br />
Access Control, to provide secured facilities as well as segregation and<br />
tracking of access activities<br />
Identity Management that is compatible with the overall airport-wide security<br />
system<br />
Video Surveillance System (VSS)<br />
Storage Area Network (SAN) for the storage of video to provide surveillance<br />
of the New <strong>Terminal</strong><br />
Passenger and hand luggage screening equipment at Security Screening<br />
Checkpoints (SSCP)<br />
Customs screening equipment within the Customs and Border Protection<br />
(CBP) area<br />
Hold Baggage Screening (HBS) equipment<br />
Several communication systems should be provided for the New <strong>Terminal</strong><br />
operations. A Voice over IP (VoIP) telephone system for telecommunications using<br />
telephony devices located at all applicable spaces within the New <strong>Terminal</strong>.<br />
A Public Address system will provide specific zone paging, courtesy announcements,<br />
emergency evacuation, and overall mass notification. A Master Cable or<br />
alternatively an Internet Protocol Television (IPTV) distribution system to provide<br />
general TV programs throughout the PTB. Infrastructure should be required to<br />
support other applications such as CNN, interactive systems, control, management,<br />
scheduling, mapping, wayfinding, and messaging.<br />
DRAFT<br />
Audio Visual systems should be provided in the conference rooms, operation center<br />
facilities, and other locations within the PTB. The systems should include all<br />
display, input, and control equipment for each local space. A Distributed Antenna<br />
System should be provided to amplify radio signals for assured reception of public<br />
safety 800MHz Trunk radio, very-high frequency (VHF) radio, ultra-high frequency<br />
(UHF) radio, and cellular telephone signals inside the PTB.<br />
Various Airport Operation Systems should be provided including passenger<br />
processing, resources management, and common use systems. In addition, an<br />
airport operations database and systems integration should be provided to ensure<br />
state of the art operations and common use functionality for the New <strong>Terminal</strong>.<br />
Lastly, in order to support green initiatives, all technology equipment should be<br />
Energy Star 4.0 certified products, as applicable. All products should also bear the<br />
Restriction of Hazardous Substances Directive (ROHS), as applicable. All servers,<br />
desktop computers, and storage equipment should be virtualized to maximize the<br />
use of available assets without wasting energy for duplicative storage and<br />
processing equipment. Likewise, monitors should utilize LED backlit technology<br />
instead of cold-cathode fluorescent to reduce energy consumption, as applicable.<br />
Landrum & Brown Page 85<br />
April 2013
KANSAS CITY NEW TERMINAL STUDY<br />
ADVANCE TERMINAL PLANNING STUDY<br />
PROGRAM CRITERIA DOCUMENT<br />
DRAFT<br />
3.4.2 OVERALL ICT DESIGN GOALS<br />
The design of the ICT systems should be made with a clear understanding of the<br />
future of each technology. Infrastructure (pathways and spaces) should be<br />
designed for the latest technology in fiber optics and copper media with<br />
consideration for future technology additions. Systems should be scalable and<br />
ready for anticipated growth and interface with disparate systems.<br />
Only technologies that make sense, based on the typical size and anticipated KCI<br />
environment, should be considered for use. For example, systems that require<br />
huge upfront capital investments or most applicable to large international hubs,<br />
should not be considered.<br />
Topologies and infrastructure components within a passenger terminal facility must<br />
be reliable. Careful consideration should be given to the redundancies and<br />
expected end of life cycles of all technology components.<br />
Systems should be designed with information and physical security in mind.<br />
Careful considerations should be given to human and system interaction and<br />
potential inherent vulnerabilities.<br />
Various ICT Systems and infrastructure components that should be utilized in the<br />
New <strong>Terminal</strong> are discussed in Appendix X, Specialty Systems and New Technology.<br />
3.4.3 CODES AND STANDARDS<br />
DRAFT<br />
Systems should be implemented in accordance with best practices, standards as<br />
well as local codes and requirements of authorities and organizations having<br />
jurisdiction. A list is included in Appendix X, Specialty Systems and New<br />
Technology.<br />
3.4.4 PASSIVE/ACTIVE INFRASTRUCTURE<br />
3.4.4.1 Wide Area Network (WAN) / Campus Area Network (CAN)<br />
/ Local Area Network (LAN)<br />
The Wide Area Network (WAN) is assumed to be associated with off-campus<br />
headquarter systems such as Kansas City city-wide systems, and Federal<br />
Government DHS, Federal Bureau of Investigation (FBI) National Crime Information<br />
Center (NCIC), TSA, CBP systems. The equipment and systems associated with<br />
these WAN should be provided by either the City or respective Government agency<br />
and should be installed and connected as part of the new <strong>Terminal</strong> project, if<br />
required.<br />
It is assumed that the existing Campus Area Network (CAN) should be upgraded, if<br />
needed, and extended as part of this project. The CAN consists of existing<br />
terminals and facilities located within the Airport especially during transitioning<br />
phases. The Mechanical Equipment Rooms (MERs) of the New <strong>Terminal</strong> should be<br />
considered a branch of hierarchical star network topology for the overall airport.<br />
Landrum & Brown Page 86<br />
April 2013
KANSAS CITY NEW TERMINAL STUDY<br />
ADVANCE TERMINAL PLANNING STUDY<br />
PROGRAM CRITERIA DOCUMENT<br />
DRAFT<br />
The CAN infrastructure should include single mode (nine-micron) optical fiber cables<br />
routed in a redundant fashion to two data centers / distribution facilities on the<br />
Airport. This should include two points of entry into the New <strong>Terminal</strong>. Redundant<br />
CAN connections should be designed to minimize single points of failure between<br />
the New <strong>Terminal</strong> and the existing Airport data network. CAN hardware located<br />
within the MERs should consist of distribution level switches connected to redundant<br />
infrastructures for fiber and electrical power.<br />
The Local Area Network (LAN) will consist of the local data network, infrastructure,<br />
and connections within the New <strong>Terminal</strong> and associated new facilities.<br />
LAN infrastructures include fiber optics backbone and horizontal copper and fiber<br />
media installations and supporting hardware (conduit, racks, and equipment).<br />
All IP-based devices should share the common physical LAN infrastructure and<br />
should include video, voice, and data services; wireless networks; building<br />
automation; overhead paging; intercom; and airport operating systems. Virtual<br />
LANs (VLANs) should be created to segregate network traffic for each system.<br />
The New <strong>Terminal</strong> should feature a redundant backbone topology within each<br />
Telecommunications Room (TR) connected to both MERs by fiber optic cables.<br />
Distribution Layer routing and switching should be provided by communications<br />
devices located within the MER. Access Layer switching should be provided by<br />
48-port power-over-Ethernet (POE) switches, where applicable, configured in a<br />
stack-topology with two connections to the MERs distribution layer switches via the<br />
redundant backbone topology.<br />
The New <strong>Terminal</strong> is planned as a converged network environment of which a<br />
dedicated security LAN for the use of security systems such as Video Surveillance<br />
and Access Control should not be required. The idea is to logically segregate and<br />
secure security systems with duplicating network infrastructure, management, and<br />
support.<br />
DRAFT<br />
Other LANs should also be present inside the New <strong>Terminal</strong> such as the law<br />
enforcement NCIC, CBP, and TSA, as well as airline-based circuits for connectivity<br />
to host systems via dedicated circuits for common use systems airlines.<br />
It is highly recommended that the Data Center network be fully virtualized using<br />
unified fabric architecture with fully redundant distribution/aggregation levels.<br />
This should support new technologies such as Fiber Channel over Ethernet and<br />
provide ten Gigabyte per second (GB/s) or multiples of ten GB/s speeds with near<br />
zero latency, high quality of service (QoS), and sufficient redundancy to prevent<br />
outages of service to the Airport. Likewise, for data security the KCI LAN should<br />
provide 802.1x security and Network administration control.<br />
The LANs should provide full coverage for all required IP data connectivity inside<br />
the New <strong>Terminal</strong>. At least 50 percent of all passive data outlets should be fully<br />
activated by being fully patched to the network, the rest of the data outlets should<br />
be provided only as spares and only terminated at the TR patch panel. Likewise,<br />
each network switch should not be utilized beyond 75 percent of the total ports<br />
capacity (e.g. 36 ports of a 48-port switch); the other 25 percent of the ports<br />
Landrum & Brown Page 87<br />
April 2013
KANSAS CITY NEW TERMINAL STUDY<br />
ADVANCE TERMINAL PLANNING STUDY<br />
PROGRAM CRITERIA DOCUMENT<br />
DRAFT<br />
should be reserved as spares for future use. Similar reserved capacity should be<br />
provided in the Distribution and Core levels of the network, with a minimum of<br />
25 percent capacity left in the form of available ports on the provided modules.<br />
The network over subscription ration general rule should be as follows:<br />
• Access to Distribution 20:1<br />
• Distribution to Core 4:1<br />
• Core to Core 1:1<br />
All Access Switches should be Layer 3/Layer 2 switches. All LAN equipment should<br />
be provided with redundant power supplies and redundant fans. For the chassisbased<br />
Distribution and Core switches, the power supplies and the processing cards<br />
should be fully redundant to provide a fully fault tolerant unit.<br />
3.4.4.2 Outside Plant “OSP” and Backbone Cabling<br />
The Airport-wide backbone and intra-building backbone cabling infrastructures<br />
should consist of high strand count Single Mode fiber optic cabling Single Mode<br />
cables. Overall, the fiber cables infrastructure should be provided with a minimum<br />
of 100 percent spare capacity in all runs after the ICT systems are implemented.<br />
All fiber should be run in a manner to minimize fiber splices, and no run from end to<br />
end should contain more than two fusion splices unless noted otherwise.<br />
Alternative pathway distribution techniques such as air-blown fiber should also be<br />
considered to maximize outside plant flexibility. Connectivity to the airport should<br />
be via two diversified routes. Within the New <strong>Terminal</strong> a hybrid Single Mode/Multi<br />
Mode (50 Micron Laser optimized) and 100 pair copper should be provided from<br />
MER to each TR.<br />
DRAFT<br />
3.4.4.3 Horizontal Structured Cabling<br />
Voice, data, and networked video requirements should be supported using<br />
Category 6a Foiled/Unshielded Twisted Pair (F/UTP) cables (or future Category 8<br />
when standard becomes available), extending from each TR to each Work Area<br />
Outlet (WAO). Outlets should be configured with a quantity of cables appropriate<br />
for the location, and should conform to ANSI/TIA-569 recommended densities.<br />
Rooms designated with low density should contain two ports, medium density<br />
should contain six to 14 ports, and high density should contain more than 14 ports.<br />
The cabling should be planned to accommodate future equipment needs, diverse<br />
and increasing user applications, ongoing maintenance, relocation, sustainability,<br />
flexibility, and service changes. In the TRs, all cables should be terminated on<br />
rack-mounted modular terminating patch panels according to American National<br />
Standards Institute / Telecommunications Industry Association (ANSI/TIA) 568-A or<br />
B depending on KCI approved standards.<br />
The maximum horizontal cable length should not exceed 90 meters for Category 6a<br />
cables. The additional length of patch cords should not cause the total channel<br />
length to be more than 100 meters. As a rule, horizontal Work Area Outlet<br />
connections should start and finish on the same floor with no cross-floor<br />
Landrum & Brown Page 88<br />
April 2013
KANSAS CITY NEW TERMINAL STUDY<br />
ADVANCE TERMINAL PLANNING STUDY<br />
PROGRAM CRITERIA DOCUMENT<br />
DRAFT<br />
connections. Occasionally, in areas where no space is available for TRs due to large<br />
open-span environment (e.g. baggage hall or departure hall), cross-floor<br />
connections may be employed. It is important that all security system field devices<br />
be installed completely in secure conduits and boxes (i.e. not utilizing open cable<br />
trays or unprotected data outlets).<br />
Horizontal cabling should be supported within each telecommunications room by<br />
cable ladder rack, wire basket, ladder rack supports, 'waterfalls', and Velcro straps<br />
(not cable ties). With the exception of Fire Alarm panels and Access Control Panels,<br />
no infrastructure attachment should be permitted to attach directly to the TR wall.<br />
All attachments must be placed on fire-retardant painted AC grade plywood.<br />
Cabling should be placed in wall mounted slack-loop supported by D-rings after<br />
entering room and prior to terminating on equipment rack.<br />
3.4.4.4 Telecommunication Spaces<br />
Telecommunication spaces should consist of spaces, cable tray, ladder rack,<br />
conduit, back boxes, and cabinets that carry, house, and transport voice and data<br />
traffic from the point of origin to the point of use. This infrastructure should be<br />
designed to support secure and reliable wired and wireless communications for all<br />
systems throughout the PTB and its supporting facilities, as required. Room size<br />
and systems should be properly sized, taking into account potential for future<br />
expansion and limits on spaces above ceilings and inter-floor service requirements,<br />
where it exists.<br />
Work area outlet components consist of the faceplate or housing, cable<br />
terminations, and patch cords for connecting the end user devices to the horizontal<br />
cable link from the local TR. Outlets should be coordinated with or built-into<br />
furniture, as appropriate.<br />
DRAFT<br />
The structured cabling infrastructure design should be provided with a reference<br />
signal grounding in the MERs and bonding system, designed and installed in<br />
accordance with the Telecommunications Industry Association/Energy Information<br />
Administration (TIA/EIA) 607-A Grounding & Bonding and/or local codes and<br />
standards documents in all TR spaces. The primary purpose of the equipment<br />
grounding system is to ensure personnel safety and reduce the likelihood of a fire<br />
hazard by facilitating the operation of over current within devices.<br />
An effective administration and labeling system is crucial for the efficient operation<br />
and maintenance of the converged network infrastructure and connectivity system<br />
and all its components, particularly within a multiple building, large campus<br />
environment. The existing Airport identification standards should be utilized to<br />
identify each pathway segment, technology space, cabinet or rack, patch panel,<br />
cable, and network device installed within the Airport technology system.<br />
All active and associated equipment should be housed in equipment cabinets within<br />
the MERs, Service Entrances, and TRs. Equipment cabinets should be lockable<br />
approximately 29 inches wide x 36 inches deep x 84 inches high to support at least<br />
45 rack unit 19-inch rack mount width conforming to TIA standards. The cabinets<br />
Landrum & Brown Page 89<br />
April 2013
KANSAS CITY NEW TERMINAL STUDY<br />
ADVANCE TERMINAL PLANNING STUDY<br />
PROGRAM CRITERIA DOCUMENT<br />
DRAFT<br />
should be oriented with front to back perforated ventilation to establish hot aisles<br />
and cold aisles in the rooms, coordinated with cooling equipment. All equipment<br />
cabinets should be equipped with seismic protection relevant to Kansas City seismic<br />
zone designation. Cabinets should also be equipped with vertical and horizontal<br />
cable management and dual power distribution strips.<br />
Two MERs should be located in the New <strong>Terminal</strong> building. They should contain the<br />
primary and backup distribution layer equipment of the LAN topology and should<br />
connect the terminal to the airport-wide LAN core. The MERs should house terminal<br />
specific head-end equipment such as PA system, and LAN/CAN communications<br />
hardware. Each TR within the terminal should connect to both MERs using fiber<br />
optic and copper backbone cables. The building power feed to the MERs should be<br />
backed up by emergency standby power. A central UPS system should be used to<br />
provide standby power to MERs equipment rather than individual rack-mounted<br />
UPS devices. The MERs should interconnect with the new parking garage main<br />
telecommunication rooms for distribution network connectivity.<br />
Two Building Entrance Rooms (BERs) should be provided to serve the New <strong>Terminal</strong><br />
by providing redundancy of services. It is strongly recommended that the New<br />
<strong>Terminal</strong> contain both Building Entrance Rooms on the building lowest level.<br />
These rooms should be located at the perimeter of the building and have direct<br />
access to the telecommunications ductbanks. The BERs should contain transition<br />
wall space for outdoor gel filled cables, splice boxes, fiber splice and terminations,<br />
transition surge protection for outside copper cables, and should provide<br />
connectivity to the New <strong>Terminal</strong> MERs. Each BER should be 20 square meters<br />
minimum, and may be co-located with the MER room if the room size takes into<br />
account requirements for both functions.<br />
DRAFT<br />
A Telecommunications Utility room should be located on the lowest level to house<br />
the termination points for the Telcos and cellular provider service cables and<br />
equipment. The room should adhere to the following requirements:<br />
• The Standard Telephone Company (STC) Room should be 12 feet x 15 feet,<br />
and must be separate from the MER and BERs. The room must be accessible<br />
from the terminal exterior or landside.<br />
• Door should be solid (no glass) that is aluminum or steel and should have<br />
access control.<br />
• A raised floor of at least 12 inches is preferred. The floor should be rated for<br />
at least 400 pounds per square foot. The raised floor should be<br />
accomplished via a depressed slab to avoid access ramps.<br />
• Ceiling height should be a minimum of nine feet.<br />
• At least two four-inch conduits should be provided to exterior communication<br />
manhole<br />
• The room should not be located near electrical distribution equipment or<br />
transformers to prevent Electromagnetic Interference/Radio Frequency<br />
Interference (EMI/RFI).<br />
Landrum & Brown Page 90<br />
April 2013
KANSAS CITY NEW TERMINAL STUDY<br />
ADVANCE TERMINAL PLANNING STUDY<br />
PROGRAM CRITERIA DOCUMENT<br />
DRAFT<br />
The PTB should contain multiple TRs located in a direct riser topology, with at least<br />
one TR per floor, where possible. The quantity of TRs per floor should be<br />
determined by the floor size and geometry, and spaced so that work area outlets<br />
should be within approximately 60 meters of a TR. Maximum Horizontal cable<br />
length should not exceed 90 meters between the telecom outlet and the TR patch<br />
panel port. Horizontal cabling for voice, data, wireless, IPTV, audio/visual (A/V)<br />
elements, security systems, and other low voltage technologies should terminate in<br />
TRs. An equipment room space on the Top level should be designated as the Point<br />
of Presence (POP) for roof-top antenna system services. Communication backbone<br />
cables should connect the TRs to the MERs. Each TR should be approximately 150<br />
to 180 square feet to account for both wall-mounted and rack-mounted equipment.<br />
TRs should be designed and coordinated to accommodate systems and equipment<br />
that include but are not limited to:<br />
• Termination and patching facilities for the horizontal cabling<br />
• Termination and patching facilities for the fiber optic backbone cabling<br />
• Termination and patching facilities for the copper backbone cabling<br />
• Hardware and racking for Network Access devices<br />
• Converged/Common Network Access devices<br />
• A/V equipment<br />
• Wireless LAN networking equipment<br />
• Building Management Systems<br />
• Security Systems<br />
• Fire Alarm panel<br />
• Distributed Antenna System (DAS) provided by a Global System for Mobile<br />
(GSM) and public safety radio provider<br />
• Vertical riser pathways<br />
DRAFT<br />
3.4.5 AIRPORT OPERATION SYSTEMS<br />
3.4.5.1 Common Use Systems<br />
Common Use Systems (CUS) are integrated systems for sharing of passenger<br />
processing systems to maximize Passenger <strong>Terminal</strong> Building (PTB) facility access<br />
and allocation through non-dedicated resources. It is a viable alternative to the<br />
traditional approach, which uses proprietary/exclusive-use models. CUSs are<br />
airport-operator provided hardware and software systems that provide an interface<br />
through which airline-host systems as well as common resources can operate with<br />
increased facility utilization and flexibility.<br />
In the context of KCI, Common Use Passenger Processing System (CUPPS), which<br />
is an overhaul of the former Common Use <strong>Terminal</strong> Equipment (CUTE) standard, is<br />
the generic term applied to standardized system platforms for agent-facing<br />
common-use systems at pre-equipped, designated locations only. CUSs encompass<br />
Landrum & Brown Page 91<br />
April 2013
KANSAS CITY NEW TERMINAL STUDY<br />
ADVANCE TERMINAL PLANNING STUDY<br />
PROGRAM CRITERIA DOCUMENT<br />
DRAFT<br />
CUTE, Common Use Self Service (CUSS), and Resources Management System<br />
(RMS). The system should be based on the latest International Air Transport<br />
Association (IATA) standards.<br />
3.4.5.2 CUPPS Concept of Operation<br />
CUPPS allows airlines to share PTB resources such as gate counters and ticket<br />
counters to provide efficient passenger services. Benefits to utilizing CUPPS<br />
include:<br />
• Efficient use of PTB real estate by allowing airlines to utilize common use<br />
facilities to handle operations as needed.<br />
• Allows the airport to rapidly offer facilities to new entrant airlines as well as<br />
to carriers with small number of flights without having to dedicate gates,<br />
counters, or other facilities on a full time basis. Likewise, airlines gain the<br />
benefit of decreased equipment mobilization costs.<br />
CUPPS utilizes common workstations and peripherals among the various<br />
participating airlines of which, upon authentication, the system connects the airline<br />
agent to requested airline host system. The system provides full access to airline<br />
host applications (or local departure control for non-hosted or charter carriers)<br />
including searching flight information and passenger records, updating travel<br />
information, and printing documents, which includes boarding passes, baggage<br />
tags, and flight manifests.<br />
3.4.5.3 CUSS Concept of Operation<br />
DRAFT<br />
CUSS enables airlines to provide passengers with self check-in services at common<br />
kiosks. There are a number of benefits to utilizing CUSS including:<br />
• Standardized approach for customer interaction with self check-in<br />
applications at a single point of contact.<br />
• Allows the Airport to offer common self check-in space to all carriers, which<br />
enhances efficiencies and minimizes queuing time compared to airlinesupplied<br />
dedicated systems.<br />
CUSS kiosks display a list of airline icons, which upon selection of a specific icon<br />
automatically launches the requested airline's application. The main touch screen<br />
interface usually lists all airlines that participate in the CUSS kiosk. Passengers<br />
may use a credit card, passport, or simply utilize the touch screen keyboard to<br />
input information. Upon completion of the check-in process, passengers receive a<br />
printed boarding pass (based on International Air Transport Association (IATA) 2D<br />
barcode) and, once implemented in the U.S., may print self-adhesive bag tags for<br />
tagging their checked in luggage.<br />
Landrum & Brown Page 92<br />
April 2013
KANSAS CITY NEW TERMINAL STUDY<br />
ADVANCE TERMINAL PLANNING STUDY<br />
PROGRAM CRITERIA DOCUMENT<br />
DRAFT<br />
3.4.5.4 Resource Management System (RMS) Concept of Operation<br />
The basic idea of RMS is a two-step process: resource planning and real-time<br />
resource management. A resource assignment schedule is typically created and<br />
issued in advance in order to facilitate planning by various airport and airline<br />
personnel. Due to various factors (i.e., flight delay, ground handling equipment<br />
failure, etc.) resource assignments may have to be altered. The resource<br />
assignments are then reassigned as required, on a real-time basis, with the goal of<br />
minimizing impact on both passengers and airport personnel.<br />
Various constraints or “rules” come into play in resource allocation, including<br />
physical limitations of a gate (e.g., cannot support widebody aircraft), convenience,<br />
carrier preferred gates, etc. These various rules form a rule-based database for the<br />
system. An expert system with easy-to-define rules is utilized as part of RMS core<br />
functions to facilitate configuration of the airport constraints. The New <strong>Terminal</strong><br />
should include full development of RMS operational rules for all new gates as well<br />
as development of any special operations required during transitioning.<br />
For the system to properly allocate resources in a real-time operating environment,<br />
it needs up-to-date flight information. This requires integration with the Airport<br />
Operational Database (AODB), which provides all necessary operational flight data<br />
for real-time allocation of seasonal schedules, Flight Information Display System<br />
(FIDS) data (e.g., flight arrival time change), and/or FAA or third party aircraft or<br />
flight actual data (e.g. Passur’s real time monitoring of air traffic).<br />
3.4.6 SYSTEM DESIGN CONCEPTS<br />
DRAFT<br />
A new system should be deployed for the designated common use areas within the<br />
new PTB. This will include head-end equipment, hardware for field devices at gates<br />
and counters, as well as participating airline gateways, and local departure control<br />
for airlines with no host-based system.<br />
Equipment should be required at all common-use gates, check-in counters, CUSS<br />
pods, remote gate holdrooms, participating airline/operations back-offices and<br />
baggage service office. The exact locations and quantities as well as coordination<br />
with architectural millwork should be carefully planned during the design of the New<br />
<strong>Terminal</strong>. All head-end hardware, including the associated servers, should be<br />
located in lockable cabinets within the <strong>Terminal</strong> MERs.<br />
Airport structured cable system and the common LAN should be utilized for<br />
communication of the Common Use system between servers and field equipment.<br />
Dedicated VLANs should be used for Common Use system communications.<br />
3.4.6.1 Hardware Configurations<br />
CUPPS workstations to be provided require components as a minimum are listed in<br />
Appendix X, Specialty Systems and New Technology.<br />
Landrum & Brown Page 93<br />
April 2013
KANSAS CITY NEW TERMINAL STUDY<br />
ADVANCE TERMINAL PLANNING STUDY<br />
PROGRAM CRITERIA DOCUMENT<br />
DRAFT<br />
CUSS kiosks to be provided require components as a minimum are listed in<br />
Appendix X, Specialty Systems and New Technology.<br />
RMS stations to be provided require components as a minimum as discussed in<br />
Appendix X, Specialty Systems and New Technology.<br />
3.4.6.2 General Requirements<br />
General rules to be used for the operation of the CUPPS/CUSS system:<br />
• No data should be maintained at public kiosks.<br />
• No data should be retained by the vendor.<br />
• No Application Provider’s (i.e. Airlines) proprietary data should be accessed<br />
by or made available to any other airline unless agreement for such use is in<br />
place.<br />
• All interfaces should be tested and certified as per CUPSS latest standards<br />
and AODB requirements.<br />
3.4.7 FLIGHT INFORMATION SYSTEMS<br />
3.4.7.1 System Overview<br />
Flight Information Systems (FIS) are client-server or web-based applications that<br />
manage and disseminate flight-oriented information such as flight times, gate, and<br />
baggage information to the traveling public, operational personnel, and airport<br />
administration. In the context of this project, FIS encompasses a number of subsystems<br />
including:<br />
DRAFT<br />
• Electronic Visual Information Display Systems (EVIDS)<br />
• Flight Information Display System (FIDS)<br />
• Baggage Information Display System (BIDS) including operational areas<br />
• Gate Information Display System (GIDS)<br />
• Counter Information Display System (CIDS)<br />
• Passport Control Dynamic Signage (PCDS) where applicable<br />
• Airport Information Management System (AIMS)<br />
• Interface to existing Airport Operations Database (AODB)<br />
The system provides a consistent source of information to the public based on data<br />
collected from automated airline interfaces, manual updates, and third-party<br />
sources. Information is typically displayed to passengers and the public throughout<br />
the airport using either banks of FIDS screens or stand-alone displays. Operational<br />
personnel may access flight information in airline offices and ramp operation spaces<br />
using public displays or workstations connected directly to the airport network.<br />
Landrum & Brown Page 94<br />
April 2013
KANSAS CITY NEW TERMINAL STUDY<br />
ADVANCE TERMINAL PLANNING STUDY<br />
PROGRAM CRITERIA DOCUMENT<br />
DRAFT<br />
Personnel typically update flight data when necessary from a few authorized AIMS<br />
workstations. Airport administration personnel should be able to use the<br />
information within the system databases to monitor flight and operational statistics.<br />
The flight information can also be displayed on the airport’s web site and other<br />
remote locations as desired.<br />
General FIDS banks in the ticketing area are used by passengers to obtain initial<br />
flight information and to determine which common-use check-in counters, where<br />
applicable, are associated with their flights. FIDS banks in the concourses are used<br />
by passengers to obtain current flight information and gate assignments as they<br />
proceed to their gate or to visit concession areas. FIDS displays in the baggage<br />
claim area are used by arriving passengers to determine the correct baggage<br />
allocated carousel. No FIDS should be presented in secured arriving corridors as<br />
passengers should be directed by static signs to CPB passport and customs control<br />
area.<br />
BIDS screens at each baggage claim carousel should provide visual indication to<br />
arriving passengers when the first bag and last bag of a flight are unloaded.<br />
Baggage Information Display Systems (BIDS) should also be made available for<br />
operational staff at the unloading belt area. Counter Information Display System<br />
(CIDS) screens above check-in counters should typically display an airline logo or<br />
other image so that the traveling public proceeds to appropriate processing queue.<br />
Gate Information Display System (GIDS) screens at each gate holdroom area and<br />
counter podium back wall are used by the passengers as they approach in the<br />
holdroom to obtain updated flight status information, in a format customizable per<br />
each operating airline. GIDS screens should also be used to display boarding<br />
information if each airline chooses to integrate their boarding status information<br />
with the FIS (e.g. boarding by groups).<br />
DRAFT<br />
The FIS should be utilized by several entities at KCI to display and manage the New<br />
<strong>Terminal</strong> flight information as well as all terminals flights during transitioning<br />
phases. The quantity of displayed flights and display screens required within the<br />
terminal expansion area should be determined during design phases and should be<br />
adequate for displaying flight activity within peak operation hour sorted by flight<br />
time or by City depending on the Airport’s final determination. However, the<br />
system administrator should have the capability of defining maximum flight window<br />
times with scrolling options.<br />
The FIS will require a new AODB for all data entry and as the central storehouse of<br />
flight information and main input platform for all flight updates. The airport<br />
operational database (AODB) should provide a platform for high-level integration of<br />
airport operational systems. Bi-directional interfaces should be established<br />
between the New <strong>Terminal</strong> and the existing AODB during transition phases to<br />
receive updated data from automated airline data feeds, and to send current<br />
database information. Data from external sources should be utilized to provide<br />
updated seasonal schedule and code share information directly to the new<br />
Resources Management System (RMS), which in turn should update FIS via the<br />
AODB.<br />
Landrum & Brown Page 95<br />
April 2013
KANSAS CITY NEW TERMINAL STUDY<br />
ADVANCE TERMINAL PLANNING STUDY<br />
PROGRAM CRITERIA DOCUMENT<br />
DRAFT<br />
FIS hardware should be based on modern highly integrated ad virtualized devices<br />
(e.g. flat screens based on LED technology and integrated digital controllers).<br />
The application software should be scalable and can be easily expanded to meet the<br />
requirements of the new PTB, transitioning phases, and future expansion.<br />
3.4.7.2 Hardware Configurations<br />
In general, screen orientation and quantities should vary by location. The use of<br />
46-inch screens is the typical standard used in modern airports to accommodate<br />
landscape flight listing. Each gate podium back-wall should be provided with a<br />
46-inch LED backlit flat panel screen (GIDS) oriented in a landscape mode. Each<br />
baggage claim carousel should be provided with two back-to-back 46-inch LED<br />
backlit flat panel screens oriented in a landscape mode. All FIDS banks should be<br />
provided with multiple 46-inch LED backlit flat panel screens oriented in portrait<br />
mode to accommodate up to 120 departure/arrival flights during peak hour.<br />
Additional screens can be added if desired to expand the window for listed flights.<br />
Each LED backlit flat panel screen should be controlled by a dedicated video output<br />
from a Display Device Controller (DDC), which is module board built into each<br />
display (i.e. using a single 120V outlet for both screen and DDC). An AODB<br />
interface with CUSs should be implemented to automatically update flight listings<br />
above check-in counters upon agent sign in. Each inbound baggage unloading belt<br />
should contain an input device for use by the tug driver to indicate that bags for the<br />
flight are being unloaded (i.e. first bag and last bag). All baggage belts allocation<br />
should be completed automatically by the RMS without manual intervention by the<br />
tug drivers. Workstations should be provided in selected operational areas for<br />
manual updates of flight information.<br />
DRAFT<br />
3.4.7.3 General Requirements<br />
All FIS hardware and interfaces should be procured and implemented specifically for<br />
the New <strong>Terminal</strong> and eventually for the entire airport operations. Casework design<br />
and associated millwork requirements should be coordinated with the New <strong>Terminal</strong><br />
Architect.<br />
At FIS equipment locations, at least a duplex of 120 volts alternating current (VAC)<br />
receptacles is required to support display devices and any other ancillary<br />
equipment. Rack mounted equipment should utilize equipment rack power.<br />
The FIS system servers should be housed within the Data Center and/or MERs,<br />
which should be equipped with temperature and humidity control. Display devices<br />
should be equipped with integrated cooling systems and should be rated for<br />
continuous operations.<br />
Access to the FIS system should be restricted to authorized users via<br />
login/password authentication. The system should partition access to the flight<br />
information database such that airline personnel should have access to view and<br />
Landrum & Brown Page 96<br />
April 2013
KANSAS CITY NEW TERMINAL STUDY<br />
ADVANCE TERMINAL PLANNING STUDY<br />
PROGRAM CRITERIA DOCUMENT<br />
DRAFT<br />
edit only information associated with their airline. Airport administrators should<br />
establish access rights for all users. Lastly, the FIS system should operate on a<br />
secure partition of the LAN (i.e. VLAN).<br />
The FIS system field equipment and device quantities should be designed and sized<br />
to provide for system expansion to 300 percent of projected flight schedule without<br />
hardware/software upgrade.<br />
Backups of flight record databases should be executed on a regular basis per the<br />
airport maintenance/backup schedule.<br />
3.4.8 SECURITY SYSTEMS<br />
3.4.8.1 Access Control System<br />
An Access Control System (ACS) provides positive electronic control and monitoring<br />
of secure areas throughout the airport. The ACS for this project should be required<br />
to electronically control and monitor access between all restricted areas in addition<br />
to specially designated areas (i.e. communication rooms, utility areas, critical<br />
infrastructure areas, administration spaces, and other spaces identified by the<br />
airport) and vehicle access points to the airside areas. The system should also<br />
provide Guard Tour functionality using card readers and input points located at<br />
various points in PTB. The Access Control System (ACS) should be used in<br />
conjunction with the VSS/CCTV system to provide security control center with the<br />
information needed to monitor safety, enforce airport regulations and security, and<br />
general operations of the airport.<br />
The ACS should be designed to provide positive control of the New <strong>Terminal</strong>.<br />
This should include control of the main facility entrances, loading dock areas, staff<br />
entrances, control of public access into various areas of the facility, and should<br />
include all vertical circulation within the facility including elevators and stairways.<br />
Airport security zones called out within this narrative and other project documents<br />
are based on the following definitions:<br />
<br />
<br />
DRAFT<br />
Airport Operational Area (AOA): The area specified in the Airport Security<br />
<strong>Program</strong> (ASP) in which security measures specified in the ASP are carried<br />
out. This area includes aircraft movement areas, aircraft parking areas,<br />
loading ramps, and safety areas, for use by aircraft regulated under 49 CFR<br />
part 1544 or 1546, and any adjacent areas (such as general aviation areas)<br />
that are not separated by adequate security systems, measures, or<br />
procedures. This area does not include the secured area.<br />
Secured Area: The area of the airport utilized for the loading and unloading<br />
of commercial aviation aircraft within which certain security measures<br />
specified in 49 CFR part 1542 are carried out. This area is where aircraft<br />
operators and foreign air carriers that have a security program under part<br />
1544 or 1546 of this chapter enplane and deplane passengers, sort, load<br />
baggage, and any adjacent areas that are not separated by adequate<br />
security measures. This is the highest security area of the airport.<br />
Landrum & Brown Page 97<br />
April 2013
KANSAS CITY NEW TERMINAL STUDY<br />
ADVANCE TERMINAL PLANNING STUDY<br />
PROGRAM CRITERIA DOCUMENT<br />
DRAFT<br />
<br />
Security Identification Area (SIDA): This area encompasses both the AOA<br />
and Secured Area and is the area in which Identification must be displayed<br />
including the portion of the airport, specified in the ASP, in which security<br />
measures are carried out.<br />
Public area: Any portion of the airport in which the visiting or traveling<br />
public can freely enter without screening of person or property.<br />
Sterile area: A portion of the airport defined in the ASP that provides<br />
passengers access to boarding aircraft and to which the access is generally<br />
controlled through the screening of persons and property<br />
Non-public area: A portion of the airport in which the owner or tenants<br />
conduct business where the traveling public does not require regular access.<br />
Non-public sterile area: A portion of the airport that the public does not<br />
require regular access and the access for employees is controlled through the<br />
screening of persons and property.<br />
<br />
<br />
Customs area: A portion of the airport operated by the CBP including the<br />
CBP Office spaces, CBP Booths, processing area, and secondary screening<br />
area, and the Secure Corridor System (SCS) from the aircraft to the CBP<br />
processing area. This area includes international arrivals.<br />
Transition/Swing: A portion of the airport that transitions between multiple<br />
security zones. International flight Jet-bridges and the associated vestibules<br />
are examples of these areas.<br />
The ACS should use a combination of access media such as smart cards, card<br />
readers, guard tour input points, door hardware, door position monitoring<br />
equipment, and access control components to fully monitor and control access<br />
throughout the facility. The ACS should control access and provide tracking of all<br />
access and attempted access events as well as log and enunciate all alarms on the<br />
system at the alarm monitoring workstation. The ACS should be used to segregate<br />
employees and visitors to specific areas or zones, allowing or denying access based<br />
upon user rights, time schedules, programmed rules, or any combination of the<br />
above.<br />
DRAFT<br />
The New <strong>Terminal</strong> and associated facilities should operate under a new ACS that is<br />
separate from any existing access control systems associated with other existing<br />
airport facilities. However, the rest of the airport should transition to the new<br />
system to minimize duplicative badges and information. A new Identity<br />
Management System and associated smart cards should be provided as part of the<br />
new system. This means that employees that work in both existing and proposed<br />
facilities should require separate and unique identification badges for overall access<br />
during transition phases.<br />
All cards should be contactless Smart cards with 32Kbit of memory. All card<br />
readers should be contactless type readers with keypads and should be equipped<br />
with a Light Emitting Diode (LED) display and an audible device to provide visual<br />
and audible feedback to the user for access granted and denied. All cards should<br />
Landrum & Brown Page 98<br />
April 2013
KANSAS CITY NEW TERMINAL STUDY<br />
ADVANCE TERMINAL PLANNING STUDY<br />
PROGRAM CRITERIA DOCUMENT<br />
DRAFT<br />
be provided with keypads to allow the reader to be able to read contactless smart<br />
cards in addition to requiring the use of a Personal Identification Number (PIN) for<br />
heightened security.<br />
All Card Readers used for access to critical areas such as access to the Customs<br />
area, terminal MER, Sterile or Secure from Public, critical infrastructure areas, and<br />
other sensitive and critical areas of the terminal should be equipped with card<br />
readers with biometric readers and keypads that can provide three factor<br />
authentication of the card holder.<br />
All MERs, TRs, and designated critical infrastructure room doors should be accesscontrolled<br />
with contactless card readers with biometrics and keypads. Electrical<br />
and Mechanical room doors and emergency building exits should be monitored by<br />
door position switches at a minimum to report entries and door status.<br />
The ACS should consist of IP-based, redundant, real-time host processors/servers,<br />
multiple workstations and terminals, and a hierarchy of IP based intelligent field<br />
panels that provide connections for specified readers, portal input devices, portal<br />
output devices, monitor and control devices. The system should be capable of<br />
routing individual alarms to specific workstations.<br />
The ACS will include equipment to enforce rules and regulations at the Airport.<br />
The ACS hardware should include devices at specific portals to prevent<br />
unauthorized tailgating/piggybacking or unauthorized escorting through the portal.<br />
The ACS should include equipment to detect possible wrong-way entry through exit<br />
Lane corridors and provide alarms upon these events to prevent a breach condition<br />
from occurring.<br />
DRAFT<br />
The ACS should incorporate the monitoring of other alarms types such as duress<br />
alarms, Automatic External Defibrillator (AED) cabinet opening, and Intrusion<br />
Detection. Upon activation of duress buttons, additional actions or responses<br />
should be provided such as disallowing extended hold functions on Passenger<br />
Boarding Bridges, the activation of audible/visual devices within the sterile area,<br />
and the pre-positioning and call-up of cameras within the affected area. Detection<br />
of an AED cabinet being opened should allow for the activation of audible/visual<br />
devices adjacent to the cabinet and the call-up and pre-position of cameras in the<br />
area of the cabinet. An Intrusion Detection alarm should allow for the activation of<br />
audible/visual devices in the area of the alarm and the call-up and pre-position of<br />
cameras in the area.<br />
The ACS should be interfaced with the Video Surveillance System (VSS) to provide<br />
camera call-up and Dome fixed and Pan-Tilt Zoom (PTZ) pre-position upon ACS<br />
alarm. The ACS should be interfaced with the Fire Alarm System to provide release<br />
of doors in the path of egress as required by the Authority Having Jurisdiction and<br />
as required to meet Code.<br />
The ACS should include a separate Identity Management sub-system, which allows<br />
for the enrollment of personnel, storage of information, capture of biometric<br />
templates, and the production of Identification Badges for use by the staff for<br />
Landrum & Brown Page 99<br />
April 2013
KANSAS CITY NEW TERMINAL STUDY<br />
ADVANCE TERMINAL PLANNING STUDY<br />
PROGRAM CRITERIA DOCUMENT<br />
DRAFT<br />
access to and within the facility. The ACS should provide high security printing<br />
capabilities including security overlays and holograms. The system should include a<br />
minimum of four Identity Management Workstations with full data entry, photo<br />
capture capability, and card printing. The card printers should be capable of<br />
printing cards on both sides and should be able to produce a double sided, full color<br />
encoded card in less than 60 seconds.<br />
The ACS should include a minimum of 10,000 smart cards along with sufficient<br />
printer supplies such as printing ribbons and holographic overlays to print all of the<br />
cards in a double-sided printing configuration. Location of Identity Management<br />
Workstations and access to the public should be determined during subsequent<br />
design.<br />
The ACS should utilize numerous technologies including card readers, door position<br />
sensors, audible/visual devices, locking equipment, and other devices to control<br />
and monitor the portal operation throughout the facility. The access control is<br />
capable of utilizing card readers, card readers with PIN pads, and card readers with<br />
PIN pads and biometrics. Project door hardware should be concealed/flushmounted<br />
where possible and should be coordinated with the architect. Door<br />
functionality should be defined based on the usage requirement for each door type.<br />
Typical Airport ACS control points include:<br />
<br />
<br />
<br />
<br />
<br />
<br />
<br />
<br />
<br />
<br />
<br />
<br />
<br />
<br />
<br />
<br />
<br />
Telecommunication room doors<br />
Utility Room doors (mechanical, electrical, etc)<br />
Man-trap doors<br />
Overhead doors<br />
Baggage claim chop doors<br />
Oversized baggage claim doors<br />
Check-in counters baggage doors<br />
Oversized check-in baggage doors<br />
Access hatch openings<br />
Operational doors<br />
Egress doors<br />
Elevator Cab Floor control/Elevator call control<br />
Emergency exit only doors<br />
Ground Boarding doors<br />
Passenger Boarding Bridge doors (Extended Hold Functions)<br />
Security equipment/screening checkpoint shut down gate control<br />
Airfield Gates<br />
DRAFT<br />
Landrum & Brown Page 100<br />
April 2013
KANSAS CITY NEW TERMINAL STUDY<br />
ADVANCE TERMINAL PLANNING STUDY<br />
PROGRAM CRITERIA DOCUMENT<br />
DRAFT<br />
<br />
<br />
Guard Tour input points. The ACS should support guard tour management<br />
allowing the configuration of card readers and inputs to be used as guard<br />
tour points. The system should generate alarms and reports to indicate the<br />
status of each tour.<br />
Silent alarm/Duress Button locations (security checkpoints, information<br />
counters, CBP Booths, CBP Interview Rooms, and CBP Coordination Center,<br />
KCAD Airport Police Division publicly accessible counter locations)<br />
General Requirements<br />
<br />
<br />
<br />
<br />
<br />
Software: licenses for equipment added as part of the PTB Project should be<br />
provided including all servers, workstations, and reader ports.<br />
Space and Mounting Requirements: All controllers should be mounted within<br />
secured, monitored, wall-mounted panels inside the communication rooms.<br />
ACS servers should be housed in lockable cabinets inside the terminal MER.<br />
Spares: At least five percent of all field components should be provided.<br />
Power: Servers/Workstations – 120 VAC plug in inside cabinets fed by UPS.<br />
Servers should also have generator back-up in addition to UPS. Controllers,<br />
modules, and door devices should be fed from a wall mounted 120 VAC to<br />
12/24 volts direct current (VDC) power supply with a minimum of 4-hour<br />
battery or UPS back up unit that is hardwired to a generator backed-up<br />
emergency circuit.<br />
Environmental: All servers should be housed within the terminal MERs which<br />
should be equipped with temperature and humidity control.<br />
Typical system integration/interface requirements for this system are indicated<br />
below.<br />
VSS System: To provide automatic alarm call up and pre-positioning of<br />
camera views associated with ACS alarms to provide live viewing of areas<br />
surrounding the ACS alarm. To provide alarm ‘flagging’ of associated video<br />
for quick recall and ease of incident review. This interface should be<br />
accomplished using manufacturer’s standard IP/Ethernet software<br />
communication.<br />
<br />
<br />
DRAFT<br />
Fire Alarm System (FAS): To provide fire alarm release of any ”means of<br />
egress” doors that are located within the fire alarm zone that is in alarm for<br />
evacuation purposes. This interface should be accomplished using dry<br />
contacts from Fire Alarm system within the Communications Rooms to drop<br />
power to the magnetic lock power supplies or provide a fail-safe signal to<br />
mortise type locks for portals that are required for emergency egress.<br />
Elevator Interface: To provide elevator control to restrict secure floor access<br />
to authorized personnel only. This interface should be accomplished using<br />
dry contacts from the ACS system into the elevator controller to control the<br />
appropriate floor selection buttons.<br />
Landrum & Brown Page 101<br />
April 2013
KANSAS CITY NEW TERMINAL STUDY<br />
ADVANCE TERMINAL PLANNING STUDY<br />
PROGRAM CRITERIA DOCUMENT<br />
DRAFT<br />
<br />
<br />
Baggage Handling System (BHS): To provide control of the baggage chop<br />
doors and bag belt activation that occur on the public to secure security lines<br />
for authorized personnel only. This interface should be accomplished using<br />
dry contacts from the ACS system into the baggage system control panel to<br />
control baggage activation only after a valid card read and monitor baggage<br />
run and parallel chop door contacts.<br />
Building Management System: The ACS should interface with the Building<br />
Management System to provide any required system operation status for<br />
overall maintenance and automatic work order dispatch.<br />
3.4.8.2 Video Surveillance System (VSS)<br />
The VSS (aka Closed Circuit TV or CCTV) should be designed to provide general<br />
video surveillance of the terminal, adjacent airfield, outbuildings, and vehicle gates<br />
associated with this project. Coverage should include public entrances and exits,<br />
staff entry and exits, exterior perimeter areas, loading dock areas, passenger<br />
screening areas and checkpoints, elevator lobbies, elevators and public areas on<br />
the various terminal floors. The intent is to provide identification and recognition<br />
level video in these areas to allow for the tracking of people within the facility.<br />
In addition, the VSS should support the ACS system by providing coverage of all<br />
Access Controlled portals to allow for assessment of alarms from a central<br />
monitoring point.<br />
The proposed VSS should not be based on reusing the existing security camera<br />
monitoring systems currently in operation at the existing airport facilities. Instead,<br />
it should be a new and separate head-end server system provided along with<br />
separate video storage components as part of new PTB.<br />
The VSS should be comprised of IP type cameras, the transport of digital video<br />
signals over the LAN to the digital video management system, the display of live<br />
camera video, and the archiving of all camera video onto long term enterprise-class<br />
storage facilities.<br />
The VSS should be required to monitor and record activities throughout the New<br />
<strong>Terminal</strong>. All cameras should be recorded on a continuous basis. Increased<br />
recording frame rate or resolution should be either manually triggered by the<br />
operators or automatically triggered by access control alarms and/or motion<br />
detection technology. The following areas should, but are not limited to, require<br />
cameras:<br />
<br />
<br />
<br />
<br />
<br />
<br />
DRAFT<br />
Portals between public and sterile areas of the airport<br />
Portals between public and secure areas of the airport<br />
Portals between sterile and secure areas of the airport<br />
General ramp and roadway areas<br />
General Sterile Area coverage<br />
General Public Area coverage<br />
Landrum & Brown Page 102<br />
April 2013
KANSAS CITY NEW TERMINAL STUDY<br />
ADVANCE TERMINAL PLANNING STUDY<br />
PROGRAM CRITERIA DOCUMENT<br />
DRAFT<br />
<br />
<br />
<br />
<br />
<br />
Security Screening Checkpoints<br />
Customs and Passport Control areas<br />
Hold Baggage screening areas<br />
Bag Claim Areas<br />
Curbsides<br />
The VSS should be based on IT standards to allow for the use of open architecture<br />
equipment and other standards such as Open Network Video Interface Format<br />
(ONVIF) for video transport, processing, and storage. The VSS should be a<br />
software-based system that should allow for the simultaneous viewing, recording,<br />
and review of recorded video. The Graphical User Interface (GUI) should include a<br />
map-based interface to allow for the selection of a camera based on location.<br />
The system should also include a video surround feature that should allow for the<br />
cameras that are adjacent to the current camera being viewed to be viewed and<br />
selected to allow for the following of a person. Upon selecting a new camera as the<br />
primary view, that camera should move to the center panel and the adjacent<br />
cameras should be repopulated around the primary camera automatically.<br />
The VSS should be fully redundant such that the loss of any individual system<br />
component (excluding actual camera loss) should not degrade video performance or<br />
prevent recording to or retrieval of video from the Storage Area Network (SAN).<br />
All video should be stored on the SAN provided as part of this project. The SAN<br />
capacity should be provided to allow all cameras to be stored at their native<br />
resolution, full color, at 15 fps during motion in the camera field of view or based<br />
upon alarms and at 7.5 fps during periods of inactivity. All video should be stored<br />
for a minimum of thirty days. It is anticipated that cameras should view motion for<br />
50 percent of the time in a typical 24-hour period. A smaller capacity (i.e. seven<br />
days storage) should be provided in the Secondary MER to maintain operations in<br />
case of loss of the Primary MER.<br />
DRAFT<br />
The system should also include video analytics as required to provide perimeter<br />
detection of the facility and in remote areas of the facility.<br />
The VSS system should be utilized for security surveillance, operational monitoring,<br />
and forensic analysis of events or alarms via recorded video. The system should be<br />
used by all security and law enforcement agencies including the KCAD Airport Police<br />
Division, TSA, CBP, and other Government authorized agencies. Monitoring<br />
workstation locations should be coordinated with stakeholders during the design<br />
phase. Hardware for the VSS system is discussed in Appendix X, Specialty Systems<br />
and New Technology.<br />
Landrum & Brown Page 103<br />
April 2013
KANSAS CITY NEW TERMINAL STUDY<br />
ADVANCE TERMINAL PLANNING STUDY<br />
PROGRAM CRITERIA DOCUMENT<br />
DRAFT<br />
3.4.8.3 Security Checkpoint Screening Systems<br />
The main function of security screening at airports is to screen people and goods to<br />
ensure that weapons, contraband, or dangerous items are prevented from being<br />
introduced onto an aircraft or entering the country. Security screening functions in<br />
the U.S. are currently performed by the TSA, and all equipment at the SSCP is<br />
provided by the TSA. The typical screening locations include the following<br />
locations.<br />
Passenger Security Screening Checkpoint: Per TSA regulations, all passengers,<br />
people, and goods/baggage entering the Sterile Area must be screened. This will<br />
typically include a mixture of Walk Through Metal Detectors (WTMD), <strong>Advance</strong>d<br />
Imaging Technology (AIT) scanners, Hand-held metal detectors, Explosive Trace<br />
Detection (ETD) equipment, and Hand Baggage X-Ray Equipment.<br />
Employee/goods Security Screening Checkpoint: The provision of a dedicated<br />
Employee or Goods Screening checkpoint varies from airport to airport. Some<br />
facilities allow employees to use Access Control as the primary control, while other<br />
facilities require screening of all personnel. At some facilities, all personnel are<br />
required to go through the public SSCP, while other facilities provide separate<br />
facilities. Likewise, the screening of goods varies from facility to facility. Some<br />
facilities use a separate goods screening area, while others use the public SSCP but<br />
prohibit goods screening during busy or peak times. For this facility, we<br />
recommend the implementation of a separate goods/employee screening area.<br />
This will facilitate a more efficient flow and prevent the mixing of the two separate<br />
populations.<br />
Security Check Point Configuration Considerations<br />
<br />
<br />
<br />
<br />
<br />
<br />
<br />
<br />
<br />
<br />
<br />
DRAFT<br />
Queuing Space: The queue is where passengers stand in line at the front of<br />
the checkpoint on the public side. Depending on the architectural layout, the<br />
queue should be bounded by double strap stanchions along the perimeter<br />
with single strap stanchions defining the various lanes from the queue<br />
entrance including separated men from women lanes.<br />
Baggage X-Ray Machine (by TSA)<br />
Trays holder (Manual tray return) (by TSA)<br />
Loading Table/Entrance Roller Conveyor (by TSA)<br />
In-feed Tunnel (by TSA)<br />
Scanning Belt (continuous from In-feed to Out-feed Tunnel) (by TSA)<br />
X-ray Dome (dual axis / multi view x-ray) (by TSA)<br />
Built in Liquid Scanner (as per latest standards) (by TSA)<br />
Out-feed Tunnel including alarm bag cut-out (by TSA)<br />
High Speed Conveyor & Tunnel (by TSA)<br />
Extension Rollers and/or Exit Roller (by TSA)<br />
Landrum & Brown Page 104<br />
April 2013
KANSAS CITY NEW TERMINAL STUDY<br />
ADVANCE TERMINAL PLANNING STUDY<br />
PROGRAM CRITERIA DOCUMENT<br />
DRAFT<br />
<br />
<br />
<br />
<br />
Walk Through Metal Detector (WTMD): The WTMD is an electronic archway<br />
used to detect metallic weapons and/or metal contraband concealed on a<br />
person. (by TSA)<br />
Barriers & Wheelchair Gates (by TSA)<br />
In order to prevent passengers and/or items from passing into the sterile<br />
area from the non-sterile area without being screened, barriers and/or<br />
wheelchair gates should be installed to close all gaps exceeding 300mm<br />
across the front width or façade of the checkpoint. (by TSA)<br />
<strong>Advance</strong>d Imaging Technology (AIT) (by TSA)<br />
Holding Stations: A holding station holds passengers temporarily until<br />
screeners are available to escort them to the proper area to conduct<br />
secondary screening using hand held metal detection wands. The holding<br />
station should be positioned so passengers can be diverted directly into the<br />
area without obstructing the path of non-alarming passengers, and should<br />
prevent the passing of prohibited items to sterile passengers. (by TSA)<br />
• Explosives Trace Detection (ETD): Secondary baggage screening areas are<br />
required for clearing passenger carry-on items when the primary screening at<br />
the X-ray indicates suspect items. Secondary baggage screening areas<br />
should include Explosives Trace Detection (ETD) device. (by TSA)<br />
<br />
<br />
<br />
Private Search Area: Private screening rooms should be located at the back<br />
end of the checkpoint in the sterile area. The area should be available to<br />
accommodate passengers who request private screening instead of being out<br />
in the open. The private screening room should be opaque. (by TSA)<br />
Egress Seating Area: Egress seating at the sterile side of the checkpoint is<br />
used for passengers to sit down and compose themselves with their personal<br />
belongings after completing the screening process. This area is usually out<br />
of the main passenger flow.<br />
Supervisory Podium: A podium should be located on the sterile side near the<br />
checkpoint exit to provide the screening supervisor with adequate viewing of<br />
the overall operation. This podium will typically be provided with an<br />
ACS/VSS workstation to allow for duress alarm reporting and viewing of<br />
CCTV images from the SSCP.<br />
Adjacent Walls & Boundaries: All walls adjacent to the non-sterile side<br />
should be at least ten feet high to prevent the passage of prohibited items<br />
from the non-sterile area to the sterile area.<br />
General Requirements<br />
DRAFT<br />
<br />
Space and Mounting Requirements: Space allocation requirements for SSCP<br />
equipment should be closely coordinated with the Architect for appropriate<br />
passenger flow. Quantities of SSCP equipment at each specific screening<br />
location should be dependent upon overall operational requirements and<br />
should be closely coordinated with the Architect for appropriate passenger<br />
flow.<br />
Landrum & Brown Page 105<br />
April 2013
KANSAS CITY NEW TERMINAL STUDY<br />
ADVANCE TERMINAL PLANNING STUDY<br />
PROGRAM CRITERIA DOCUMENT<br />
DRAFT<br />
<br />
Power: Servers/Workstations – 120 VAC plug in inside cabinets fed by UPS.<br />
Servers should also have generator back-up in addition to UPS. Equipment<br />
should be fed from 120 VAC receptacles that may have UPS back up unit that<br />
is hardwired to a generator backed-up emergency circuit. Design of SSCP<br />
equipment floor power locations should be closely coordinated with the<br />
electrical designer.<br />
Data: The WTMD, X-Ray, AIT, and ETD equipment have data connection<br />
requirements. Provide data outlets for this equipment. Coordinate<br />
requirements with TSA.<br />
Environmental: All servers (as required) should be housed within the<br />
terminal MER, which should be equipped with temperature and humidity<br />
control.<br />
3.4.8.4 CHECKED BAGGAGE SCREENING<br />
The Hold Baggage Screening System (HBS) provides screening of all checked bags<br />
prior to the baggage being loaded onto aircraft. Per the scope of work, the Hold<br />
Baggage Screening is required to meet all TSA standards. Currently, there are no<br />
in-line TSA certified Explosive Detection System (EDS) machines available for Outof-Gauge<br />
(OOG) baggage due to tunnel dimension limitations; as such, TSA<br />
requires manual processing of all OOG baggage through Explosive Trace Detection<br />
(ETD) machines.<br />
Hold Baggage Screening: Hold Baggage Screening is required for all baggage that<br />
is checked and will be transported on commercial passenger aircraft. There are<br />
typically three stages to this screening which includes the use of Explosive<br />
Detection System (EDS) equipment, a Stage 2 screening involving on-screen<br />
resolution, and finally a Stage 3 that involves manual search and ETD verification.<br />
Bags that pass at any stage will be routed for loading onto the aircraft; bags that<br />
fail will be sent for disposal. Ultimate disposal of suspect bags would be via bomb<br />
disposal equipment.<br />
DRAFT<br />
3.4.9 TELECOMMUNICATION SYSTEMS<br />
3.4.9.1 Voice Communication Systems – Telephone<br />
Telephone service should be provided based on Voice over Internet Protocol (VoIP)<br />
solution. Telephone service to the desktop work areas should be provided by<br />
common data network infrastructure enabling a data information sharing platform<br />
over the telephone. A call processor unit with backup unit should be located in<br />
MERs.<br />
The system should interface with various audio video conference systems. Subject<br />
to final calculations for the New <strong>Terminal</strong> and other new facilities, the system<br />
should be provided to serve approximately 1,500 to 3,000 endpoints initially and<br />
should be capable of serving ultimately 5,000 endpoints. The system should allow<br />
initial endpoints installed with Direct Dial Inwards (DDI) telephone numbers as<br />
needed.<br />
Landrum & Brown Page 106<br />
April 2013
KANSAS CITY NEW TERMINAL STUDY<br />
ADVANCE TERMINAL PLANNING STUDY<br />
PROGRAM CRITERIA DOCUMENT<br />
DRAFT<br />
Gateways should be provided to serve a trunk line capacity of 300 trunk lines<br />
initially using PRI digital trunk technology and SIP protocol as coordinated with the<br />
new terminal and Telcos. The external lines should be distributed between the<br />
primary and secondary service providers’ entrances.<br />
As a minimum, but not limited to, the VoIP devices/server, software and handsets<br />
should be required to support industry based, standard protocols, and specifications<br />
as discussed in Appendix X, Specialty Systems and New Technology.<br />
Interactive Voice Response (IVR) with speech recognition capabilities should be<br />
provided to provide callers the ability to navigate to destinations after being<br />
presented audible menu options. Voice Mail & Unified Messaging should be part of<br />
the system. All lines, subject to activation of service, should be provided with Voice<br />
Mail capability.<br />
3.4.9.2 Wireless Data/Voice<br />
A building wireless LAN system should be provided; it is recommended that the<br />
system use discrete access points. Access points should be considered "light<br />
weight” and should be controlled via a backend engine. Wireless networks should<br />
be designed to carry wireless traffic for voice and data systems. The General data<br />
network should be used for all public WiFi services including billing and charging<br />
modules for pay per use service, if desired. Standards, certifications, and<br />
requirements for the WLAN are listed in Appendix X, Specialty Systems and New<br />
Technology.<br />
3.4.9.3 Distributed Antenna System<br />
Like all large steel and glass buildings, the New <strong>Terminal</strong> building structure should<br />
significantly weaken the propagation of externally-generated wireless signals inside<br />
the terminal building. Due to this, a wireless distribution system should be installed<br />
to provide uniform radio coverage throughout the new terminal. The main function<br />
of the system, which should be referred to as the Distributed Antenna System<br />
(DAS), is to receive, amplify, and distribute public safety radio and cellular phone<br />
signals as-is. The DAS should be state-of-the art in design and function, and<br />
should provide excellent coverage to commercial and non-commercial portable<br />
radio devices used within the new terminal. The DAS should provide ubiquitous<br />
coverage for all trunked radio, public safety frequencies, ground to air radio and<br />
VHF/UHF radio systems. The system should be comprised of the following<br />
components:<br />
<br />
<br />
<br />
Antennas<br />
DRAFT<br />
Digital signal distribution system<br />
RF signal radiating elements<br />
Landrum & Brown Page 107<br />
April 2013
KANSAS CITY NEW TERMINAL STUDY<br />
ADVANCE TERMINAL PLANNING STUDY<br />
PROGRAM CRITERIA DOCUMENT<br />
DRAFT<br />
All antennas used by the airport, airlines, and tenants for wide-area radio<br />
communications should be located at the antenna farm, a high and visually discrete<br />
rooftop area on the New <strong>Terminal</strong>. All DAS equipment including transceivers and<br />
amplifiers required by the airport or service providers should be located in the<br />
MERs, which should have direct pathways to the antenna farm.<br />
The active components of the DAS should convert radio frequency signals from the<br />
transmitters and amplifiers to loss-free signals for distribution throughout the<br />
terminal interiors and back to the wide-area radio network. The distribution system<br />
should be comprised of a mixture of fiber, CAT-6a, solid coaxial cabling and interior<br />
antennas.<br />
Dedicated Radio Dispatch Consoles for radio communications and radio paging<br />
should be provided in all Airport Security, Operations, and Emergency Centers.<br />
However, the type and configuration of the console should be dependent on<br />
used/planned frequencies (e.g. 700/800MHz, UHF, VHF, paging tones, etc.).<br />
3.4.9.4 Intercom<br />
Intercom systems are fixed point-to-point communications devices that allow for<br />
ease of communication between geographically separated locations. However,<br />
recently, intercom systems have been usurped in favor of using existing telephone<br />
lines and VoIP wireless telephones. This type of system should not be provided in<br />
any of the proposed facilities and instead its functionality should be provided by the<br />
proposed VOIP telephone system using call boxes that mimic intercom functions.<br />
3.4.9.5 Audio/Visual & Teleconferencing<br />
The PTB should contain spaces dedicated for conferences and training; these areas<br />
should be used for general meetings or presentations. A/V requirements should be<br />
customized to the spaces that house them, depending on use, room size, and<br />
ancillary requirements. Design consideration for each space should be defined<br />
based on best practices to provide users with needed features and flexibility.<br />
Typical small conference rooms could consist of a wall mounted flat panel display<br />
screen. More complex systems found in large conference rooms and board rooms<br />
could include large flat screens, motorized projectors, and speakers, sound<br />
reinforcement, discrete microphone placement, and smart boards with integrated<br />
video conference capabilities. A list of A/V systems and devices that should be<br />
included is in Appendix X, Specialty Systems and New Technology.<br />
Preliminary Room types and examples of A/V equipment in each room type is as<br />
follows:<br />
<br />
DRAFT<br />
Large Conference Rooms should support Executive meetings at the PTB. It is<br />
expected that these spaces should vary in architectural fit and finish but<br />
should incorporate similar technologies. A/V equipment should include front<br />
projection display, integrated supplemental flat panel displays in custom<br />
furniture, video teleconferencing, DVD, IPTV, robotic cameras, low profile<br />
table microphones, integrated control touch screen, etc.<br />
Landrum & Brown Page 108<br />
April 2013
KANSAS CITY NEW TERMINAL STUDY<br />
ADVANCE TERMINAL PLANNING STUDY<br />
PROGRAM CRITERIA DOCUMENT<br />
DRAFT<br />
<br />
<br />
Multipurpose rooms are typically large spaces that can be subdivided into<br />
smaller rooms for different uses. Due to the nature of these environments,<br />
the audio systems and front projection systems are typically the only<br />
components permanently installed into the space. When divided, the<br />
segments' audiovisual systems are fully self-contained and function<br />
independently. When combined, the segments' audiovisual systems combine<br />
to function as a single entity. Laptop, video, audio, power and network<br />
connections should be provided in floor boxes throughout. Furniture should<br />
be furnished with table-top flip-up panels containing power, network, laptop,<br />
and A/V connections. Control over the rooms should be via wall-mounted<br />
control in each segment and a wireless touch screen for use either at the<br />
lectern or table top. The control system programming should feature<br />
automated setup macros for different room configurations via single button<br />
presses.<br />
Staff meeting rooms and small conference rooms should have technologies<br />
present to allow for presentations and curriculum development. Typically,<br />
they should have a wall mounted flat panel display and a resident personal<br />
computer (PC) along with a laptop plug-in point at the table. <strong>Program</strong> audio<br />
should come from the flat panel’s internal speakers and a conference phone<br />
is typically available on the table. Control is handled via the flat panel<br />
infrared handheld remote. In addition to audiovisual equipment supporting<br />
computer display, staff’s meeting rooms are typically outfitted with<br />
whiteboards and tack surfaces.<br />
The Central Systems Management and Software system should be wired<br />
digital system or a client/server network based system to provide network<br />
based remote room control, resource management, monitoring, and<br />
scheduling capabilities in support of audiovisual systems that have integrated<br />
networked control systems across the campus. It should also serve as the<br />
core system for audio visual help desk support across the campus. Touch<br />
screen controllers should be provided outside of each audiovisual enabled<br />
space where room schedule information can be displayed and edited.<br />
3.4.9.6 Master Cable / IPTV System<br />
<br />
<br />
DRAFT<br />
A master Cable or Internet Protocol TV (IPTV) system should be provided in<br />
the new terminal. The system should allow TV signal distribution, digital<br />
signage, dynamic advertisement, and auxiliary visual paging. Either a<br />
traditional fiber/coaxial based Cable TV distribution or a separate IPTV TV<br />
signal modulators, streaming servers, and middleware servers should be<br />
provided to distribute signals throughout the PTB.<br />
If IPTV is utilized, the data network should be configured for QoS parameters<br />
to achieve video streaming without disruption the user experience. Exact<br />
values should be set the Final Specifications. Likewise, IP Set-Top Box<br />
(STB), which is a digital system designed and built to receive interaction with<br />
the unlimited world of IP services including TV Channels, Audio programs,<br />
Music, Widgets, Games and much more. With applications in the broadband<br />
environment, the HD IP Set-Top Box has multicast or Internet Group<br />
Management Protocol (IPTV) support (IGMP), Video-On-Demand, Audio-On-<br />
Landrum & Brown Page 109<br />
April 2013
KANSAS CITY NEW TERMINAL STUDY<br />
ADVANCE TERMINAL PLANNING STUDY<br />
PROGRAM CRITERIA DOCUMENT<br />
DRAFT<br />
<br />
<br />
<br />
<br />
<br />
<br />
<br />
<br />
Demand, EPG, CA support (if required), and digital stereo audio support. All<br />
provided through the HD IP Set-Top Box’s powerful hardware platform,<br />
strong multi-audio/video H.264, MPEG-2, MPEG-4 decoding support. STBs<br />
should be employed for each TV location to receive IPTV signals. Standard<br />
data outlets should be utilized for horizontal cabling connectivity.<br />
TV signals should be distributed in the following areas:<br />
Departure Lounges<br />
VIP waiting areas<br />
Meeting and greeting areas<br />
Pay-per-use for tenants and concessionaires<br />
Digital Advertisement: Provisioned areas for advertisement video walls are<br />
as follows:<br />
Departure and Arrival Corridors<br />
Dedicated screens should be used for digital signage, electronic way finding<br />
guidance, and people flow to direct passengers to various services and<br />
events within the terminal.<br />
The overall system should be specified for Day 1 provision with additional<br />
100 percent without the need for Expansion hardware and software license.<br />
3.4.9.7 Public Address System (Overhead Paging)<br />
The Public Address (PA) System should provide the ability to distribute intelligible,<br />
loud, and uniform audio signals to set groups of speakers or zones in corridors and<br />
waiting rooms. The PA system should include field equipment including speakers,<br />
cabling, and paging microphones as well as the head-end equipment including the<br />
overall paging control system, digital signal processor, and amplifiers.<br />
DRAFT<br />
The PA system should be an IP based system that utilizes the network for<br />
distribution of audio programming from the head-end to the distributed PA<br />
amplifiers and field equipment. The ability to page from individual<br />
microphones/paging stations or the delivery of automated messages to specific<br />
zones should be fully programmable. The system should provide for the ability to<br />
page from the phone system by authorized users as required.<br />
The system should provide “zoned” and “all call” paging as required. Amplifiers<br />
should be distributed throughout the TRs. This system should allow for preprogrammed<br />
messages, integration into the Building Automation System, Fire<br />
Alarm System, and Building Security System. The system should have the<br />
capability of playing Azan for prayer times and other type of messages as needed in<br />
selected areas.<br />
The Public Address system should be zoned and programmable to distribute specific<br />
messages to specific zones while excluding other specific areas.<br />
Landrum & Brown Page 110<br />
April 2013
KANSAS CITY NEW TERMINAL STUDY<br />
ADVANCE TERMINAL PLANNING STUDY<br />
PROGRAM CRITERIA DOCUMENT<br />
DRAFT<br />
PA Zoning should be defined according to functional space. Zones should be<br />
organized so that a terminal area is contained in a zone and zones should not<br />
generally cover more than one area. All locations should be equipped with at least<br />
one general announcement zone that may be comprised of smaller sub-zones as<br />
required by the functional operation of the <strong>Terminal</strong>.<br />
IP based Paging stations should be provided in all Operations/Security Centers, and<br />
main public paging information desks.<br />
In large voids that have acoustically challenging environment, such as building<br />
entrances and baggage hall, line array type speakers should be utilized to achieve<br />
the required level of intelligibility and loudness. The contractor should be required<br />
to validate the speakers’ layout design with appropriate electro acoustical study.<br />
3.4.9.8 Data Storage<br />
A new Storage Area Network (SAN) should be provided within the campus wide<br />
data centers as part of this project. The SAN should utilize Fiber Channel or Fiber<br />
Channel over Ethernet (FCOE). FCOE is the preferred option due to elimination of<br />
dedicated fiber channel components and direct utilization of a unified fabric based<br />
network. The Storage Area Network (SAN) should provide storage for, but not<br />
limited to, digital video storage for the VSS, storage to multimedia systems,<br />
storage for Audio/Visual, backup of operating system, and support for servers and<br />
desktop virtualization as needed. The SAN should be comprised of modular storage<br />
arrays, should be expandable, and should have sufficient size and speed to assure<br />
consistent storage.<br />
DRAFT<br />
The SAN can be expanded to serve all personal storage, server storage, databases<br />
to support the airport operation systems, general storage, and special systems<br />
storage. The SAN should be fully redundant and the storage arrays should be<br />
configured in a redundant array of independent disks (RAID) 6 configuration with<br />
redundant striping of data and error codes hot standby drives ready in case of a<br />
failure. The SAN should be of sufficient speed to be able to rebuild the failed disk<br />
while still providing full operation without degradation in the overall performance of<br />
the SAN. The SAN should also be capable of performing all diagnostics and utilities<br />
required for Preventative Maintenance without degrading performance of the<br />
system.<br />
The size of the primary SAN should not be less than 500 Terabytes (TB) with the<br />
capability to expand up to a total size of no less than 1 Petabyte. Final capacity<br />
should be determined during design phases. All SAN controllers provided should be<br />
fully redundant and capable of accepting the expansion noted above without<br />
requiring any changes or upgrades. SAN on-line storage (i.e. Tier 1 high speed<br />
Fiber Channel or serial attached small computer system interface (SAS) drives)<br />
should be at least 50 percent of total capacity to support low latency transactional<br />
applications. Near-line storage (i.e. Lower speed serial advanced technology<br />
attachment (SATA) II drives) should be used for higher latency applications such as<br />
reference applications, archival and backup data. The SAN should provide<br />
automatic backup by taking periodic snapshots of active data in order to provide a<br />
Landrum & Brown Page 111<br />
April 2013
KANSAS CITY NEW TERMINAL STUDY<br />
ADVANCE TERMINAL PLANNING STUDY<br />
PROGRAM CRITERIA DOCUMENT<br />
DRAFT<br />
method of recovering records that have been deleted or destroyed. It is assumed<br />
that off-site data archival should be provided by others as part of existing Operation<br />
and Maintenance procedures of the Airport.<br />
3.4.10 OPERATION CENTERS<br />
3.4.10.1 Existing Communication Center and Emergency<br />
Operations Center<br />
The current Communications Center and Emergency Operations Center (EOC) are<br />
located on the third floor of the Airport Police Building. It has not yet been fully<br />
determined if the Police Building will remain as part of the PTB project. However,<br />
regardless of whether the building is maintained, the current available space is not<br />
sufficient to allow growth of the Communications Center or the EOC.<br />
The Communications Center functions as the Security Operations Center for the<br />
existing airport facilities. All Access Control alarms are monitored and dispatch<br />
occurs from this location. The CCTV cameras are also displayed on a video wall<br />
within the Communications Center, and the Communication Center operators<br />
monitor the CCTV cameras throughout the facility when not responding to other<br />
alarms or events. Directly across the hall from the Communications Center is the<br />
EOC. The existing EOC is conference room with Audio/Visual capability. Overall,<br />
these two spaces and the functions performed should be reconsidered in the<br />
context of the new PTB project, and the functions expanded to meet the operational<br />
needs of the new facility.<br />
DRAFT<br />
The trend in airports is to combine more functions into a single operations center,<br />
referred to as an Airport Operations Center (AOC). Depending upon the Airport<br />
business model, it is becoming more common that the AOC perform overall Airport<br />
Operations as well as Security Operations. One of the main business drivers for<br />
this model is to leverage the work force required for Operations Centers, as well as<br />
providing a single point of contact and dispatch for the overall facility.<br />
This improves the overall Airport Situational Awareness, improving function, safety,<br />
and security by allowing more concise response to incidents and events that is<br />
possible with split Operations and Security Centers.<br />
3.4.10.2 Airport Operations Center<br />
The Airport Operations Center (AOC) is the focal point for command and control of<br />
KCI operations; communications; security monitoring and operations; specialized<br />
technologies; and information collections, assessment, analysis, and dissemination<br />
for all resources under non-emergency and emergency conditions to support a<br />
common operating picture. It is assumed that an AOC should be developed to<br />
support the new <strong>Terminal</strong> expanded operational requirements.<br />
The primary responsibility of an AOC is the safe, efficient, and secure movement of<br />
passengers, employees, aircraft, and vehicles within the new terminal and, if<br />
desired, for the entire airport complex. The AOC should monitor the entire PTB<br />
operations and respond to issues to resolve situations affecting security, life safety,<br />
Landrum & Brown Page 112<br />
April 2013
KANSAS CITY NEW TERMINAL STUDY<br />
ADVANCE TERMINAL PLANNING STUDY<br />
PROGRAM CRITERIA DOCUMENT<br />
DRAFT<br />
as well as passenger, aircraft and vehicular flows. This responsibility includes<br />
coordination across different agencies and departments. The AOC should have<br />
overall responsibility of ensuring smooth functioning and availability of all PTB<br />
facilities and services.<br />
Functions that could be housed under the AOC include Resources Allocation, PA<br />
paging, FIDS update, CCTV monitoring and control, and all access control and<br />
security monitoring, control, and dispatch. The AOC should include or be adjacent<br />
to an Emergency Operations Center (EOC), which should be staffed on as<br />
as-needed basis to allow decision makers to respond to emergencies affecting the<br />
<strong>Terminal</strong> in specific or the Airport campus in general.<br />
There are a number of operational concepts for a typical AOC that assist in refining<br />
systems that are overseen from this location and the type of personnel that are<br />
utilized for staffing positions. These concepts have been taken into consideration<br />
for the general layout of the operations center:<br />
<br />
<br />
<br />
<br />
<br />
<br />
<br />
<br />
The AOC should require feeds from all major systems. Particularly in the<br />
event of emergency or incident, the adjacent EOC should rely on the AOC to<br />
be the central receiving, processing and dissemination point for all Airport-<br />
Wide related information.<br />
The AOC require feeds from all security and life safety systems. The AOC<br />
should be responsible for dispatch of personnel for all security related alarms<br />
and issues.<br />
Airport-Wide passenger/customer service-related calls should be maintained<br />
by current operations located elsewhere on the site.<br />
DRAFT<br />
The AOC should not be utilized for fixing or servicing field equipment. Airport<br />
janitorial functions should not be managed out of the AOC. Likewise, all<br />
tenant operations is considered an administrative function and as such be<br />
managed elsewhere.<br />
The AOC should assist with fielding emergencies and directing overall<br />
security and emergency response teams.<br />
The Air Traffic Control Tower should maintain responsibility for all functions<br />
pertaining to the runways and taxiways; therefore, the AOC should not<br />
require positions for areas such as Airfield Lighting, Runway and Taxiway<br />
inspections, etc.<br />
All rescue efforts should be managed by the Airport Fire & Rescue<br />
department and should not require a standalone position within the AOC.<br />
In the event of emergencies, existing staff within the AOC may have<br />
emergency response duties but should utilize their existing<br />
consoles/workstations.<br />
The programmatic detail of each of these key operation centers such as key<br />
function, headcount, and schematic layout should be developed during<br />
design phases.<br />
Landrum & Brown Page 113<br />
April 2013
KANSAS CITY NEW TERMINAL STUDY<br />
ADVANCE TERMINAL PLANNING STUDY<br />
PROGRAM CRITERIA DOCUMENT<br />
DRAFT<br />
Potential functions of the AOC include:<br />
PTB Security:<br />
<br />
<br />
<br />
<br />
<br />
<br />
<br />
<br />
<br />
<br />
<br />
Responsible for monitoring PTB security systems including Access Control<br />
and Video Surveillance<br />
Airport Security:<br />
Responsible for monitoring Airport-wide, Roadways, Tenant and perimeter<br />
security.<br />
Life Safety:<br />
Responsible for monitoring Fire Alarm and Life Safety Systems<br />
Special Security:<br />
Responsible for coordination and arrangement of VIP and special events<br />
security<br />
Flight Operations:<br />
Flight Data Operations: Responsible for flight data handling on the<br />
operational day.<br />
Flight Data Monitoring: Responsible for monitoring flight data and<br />
operation systems.<br />
Resources Management:<br />
Stands Allocation: Responsible for aircraft stands allocation and adjustments.<br />
Gates & Check-in Allocation: Responsible for gates and check-in allocation<br />
and adjustments.<br />
Baggage Belts Allocation: Responsible for allocating flights to Inbound and<br />
outbound baggage chutes/reclaim belts.<br />
Performance Management:<br />
<strong>Terminal</strong> Operations: Responsible for managing and coordinating terminal<br />
operations.<br />
Minimum Connection Time and Online Performance: Responsible for<br />
maintaining operation performance and minimizing disruption to<br />
schedules.<br />
<strong>Planning</strong>:<br />
Allocation <strong>Planning</strong>: Manages resources planning and leveling<br />
Capacity <strong>Planning</strong>: Manages capacity planning and simulation<br />
Statistical Analysis: Manages historical data, trends and analysis<br />
Call Center:<br />
DRAFT<br />
Telecommunications: Responsible for handling normal and emergency<br />
voice and data communications with the public, staff, and systems.<br />
Public Announcement: Responsible for handling all flight and courtesy<br />
announcements.<br />
Landrum & Brown Page 114<br />
April 2013
KANSAS CITY NEW TERMINAL STUDY<br />
ADVANCE TERMINAL PLANNING STUDY<br />
PROGRAM CRITERIA DOCUMENT<br />
DRAFT<br />
<br />
<br />
Airport-wide Operations<br />
Landside/Airside Operations<br />
Landside: Responsible for handling landside and Construction coordination<br />
operations<br />
Airside: Responsible for handling Airside and NOTAMS Operations<br />
3.4.10.3 Emergency Operations Center<br />
The EOC should support the incident management team responsible for handling a<br />
crisis or emergency in PTB or at the airport at large. The EOC should include the<br />
following functions:<br />
<br />
<br />
<br />
<br />
Main Crisis Management Room for the Incident Management Team who is<br />
responsible for managing the crisis and coordinating activities among the<br />
various operation sections.<br />
Break out room for small group meetings, caucusing<br />
Policy Room for executive level and VIP decision meetings.<br />
Technical Resource for preparing and managing the EOC facility and<br />
controlling technical communication and Audio-visual equipment during<br />
crises.<br />
3.5 Utilities, Infrastructure and MEP Requirements<br />
3.5.1 PROJECTED NEW TERMINAL UTILITY REQUIREMENTS:<br />
Peak estimated demands of Mechanical Electrical & Plumbing (MEP) systems are<br />
listed below for the New <strong>Terminal</strong>. Exception, <strong>Terminal</strong> C peak cooling will be<br />
added to the Central Plant capacity. Refer to Appendix X for new <strong>Terminal</strong> Utilities<br />
demands estimate calculations.<br />
<br />
Peak Cooling:<br />
DRAFT<br />
o New <strong>Terminal</strong> 3,293 Tons<br />
o Existing <strong>Terminal</strong> B 1,500 Tons<br />
(Initially <strong>Terminal</strong> B will be served until such time as it is demolished.)<br />
o Existing <strong>Terminal</strong> C 1,500 Tons<br />
Subtotal<br />
6,293 Tons<br />
Peak Heating:<br />
o New <strong>Terminal</strong> 32,050 mbh<br />
o <strong>Terminal</strong> C NA (Use existing Boilers in Term C)<br />
Domestic Water: 500 gpm<br />
Fire Protection: 2,000 gpm<br />
Domestic Hot Water: 150 gpm<br />
Landrum & Brown Page 115<br />
April 2013
KANSAS CITY NEW TERMINAL STUDY<br />
ADVANCE TERMINAL PLANNING STUDY<br />
PROGRAM CRITERIA DOCUMENT<br />
DRAFT<br />
Sanitary Sewer: 1,840 Sewer Fixture Units<br />
Peak Natural Gas: 109,840 CFH<br />
Roof Storm Water: 16,360 gpm<br />
Electrical Connected Load: 21.5MW<br />
Exhibit M-8, New <strong>Terminal</strong> Estimated Peak Utilities Demand in Appendix X, outlines<br />
the peak demand of the building utilities and the equipment and piping required to<br />
serve the needs.<br />
3.5.2 NEW TERMINAL MECHANICAL AND ELECTRICAL SYSTEM<br />
DESCRIPTIONS<br />
3.5.2.1 Heating Equipment<br />
KCI has an existing Central Utility Plant (CUP) in a building with the airport Data<br />
Center and Police Facility. The site layout is shown in Exhibit M-1, Existing<br />
Conditions (in Appendix X). The CUP used to include steam boilers, distributing<br />
steam to hot water heat exchangers located in <strong>Terminal</strong>s A, B, and C. Due to high<br />
operating and maintenance costs the steam boilers were removed from the CUP<br />
and hot water boilers were installed in each terminal building. KCI’s preference is<br />
to maintain this approach with the New <strong>Terminal</strong>, i.e., provide mechanical space in<br />
the New <strong>Terminal</strong> to install hot water heating equipment.<br />
3.5.2.2 COOLING EQUIPMENT<br />
The existing CUP is located landside, adjacent to airport surface parking, and near<br />
the ATCT. It includes three York Millennium centrifugal chillers rated at 1,500 tons<br />
apiece. An induced draft cooling tower is located to the east of the CUP, and chilled<br />
water distribution piping runs from the CUP to <strong>Terminal</strong>s A, B, and C.<br />
See Exhibit M-9, CUP Enlarged Plan – Existing Chiller Plant in Appendix X, for<br />
existing equipment layout and Exhibit M-2, <strong>Terminal</strong> B and C Chilled Water<br />
Distribution Phasing Plan in Appendix X, for routing of piping during construction of<br />
New <strong>Terminal</strong>. KCI used a trenchless, underground pipe lining (In-situ Pipe Repair)<br />
method to rehabilitate the below grade segments of the distribution piping when<br />
leaks developed. For future buried chilled water distribution piping, a utility tunnel<br />
or a prefabricated, pre-insulated piping system should be included if leaks develop.<br />
3.5.2.3 Mechanical Plant<br />
DRAFT<br />
The Mechanical Equipment serving the New <strong>Terminal</strong> will consist of a Boiler Plant<br />
located in the New <strong>Terminal</strong> and a Chilled Water Plant located in the existing CUP or<br />
a new CUP. The existing boiler plant, in <strong>Terminal</strong> C, will be maintained.<br />
Landrum & Brown Page 116<br />
April 2013
KANSAS CITY NEW TERMINAL STUDY<br />
ADVANCE TERMINAL PLANNING STUDY<br />
PROGRAM CRITERIA DOCUMENT<br />
DRAFT<br />
3.5.2.4 HVAC Systems<br />
Table 3.5-1, New <strong>Terminal</strong> HVAC Requirements, shows the HVAC loads (space<br />
cooling and heating) that are estimated for the New <strong>Terminal</strong> based on a break out<br />
of terminal square footage per function.<br />
Table 3.5-1<br />
NEW TERMINAL HVAC REQUIREMENTS<br />
Area Schedule Area Airflow Supply Total Heating Total<br />
Per<br />
area Airflow<br />
Clg<br />
Load Per Area<br />
Htg<br />
Load<br />
‘by function<br />
SF<br />
cfm/S<br />
F cfm mbh Btuh/SF mbh<br />
Aircraft Gates 85,772 1.0 85,770 3,512 35 3,000<br />
Airline Clubs 4,251 1.0 4,250 174 35 150<br />
Airline Operations 95,922 1.0 95,920 3,928 35 3,360<br />
Airline Ticket Office 9,886 1.0 9,890 405 35 350<br />
Baggage Handling 96,957 0.53 51,720 2,729 19.7 1,810<br />
Circulation 242,871 1.00 242,870 9,946 35 8,500<br />
Concession Support 17,987 1.00 1,7990 737 35 630<br />
Domestic Baggage<br />
Claim 59,280 1.0 59,280 2,428 35 2,070<br />
Domestic Ticket<br />
Counter 17,676 1.0 17,680 724 35 620<br />
International<br />
Ticketing 2,867 1.0 2,870 118 35 100<br />
Miscellaneous<br />
Tenants 5,883 1.0 5,880 241 35 200<br />
Non-Airline Tenants 11,699 1.0 11,700 479 35 410<br />
Other Space 57,986 1.0 57,990 2,375 35 2,030<br />
Public Restrooms 18,154 1.0 18,160 1,414 35 630<br />
Retail 85,280 1.0 85,280 3,492 35 2,990<br />
Security 40,483 1.0 40,480 1,658 35 1,420<br />
<strong>Terminal</strong> Function 129,324 0.58 74,910 3,802 20.3 2,620<br />
US Customs 33,182 1.0 33,180 1,359 35 1,160<br />
<strong>Terminal</strong> C 300,000 NA NA 12,000 NA NA<br />
New Term Sub-<br />
Total<br />
DRAFT<br />
1,015,46<br />
0<br />
Term C Sub-Total 462,500 18,000<br />
New + Term C Total<br />
1,477,96<br />
0 57,518<br />
4,793<br />
Tons<br />
915,82<br />
0 39,518 32,050<br />
Source:<br />
HNTB Corporation Analysis based on ASHRAE Pocket Guide for Air-Conditioning, Heating, Ventilation<br />
and Refrigeration, 7 th Ed.<br />
Landrum & Brown Page 117<br />
April 2013
KANSAS CITY NEW TERMINAL STUDY<br />
ADVANCE TERMINAL PLANNING STUDY<br />
PROGRAM CRITERIA DOCUMENT<br />
DRAFT<br />
Existing <strong>Terminal</strong> A, B, and C HVAC Systems<br />
<strong>Terminal</strong>s A, B, and C are currently served by a mix of HVAC systems including<br />
some dual duct, multi-zone, and single duct Variable Air Volume (VAV) air<br />
distribution systems. Air Handling Units (AHUs) are located in Mechanical Rooms<br />
that are spaced throughout the all three terminals. Perimeter spaces are<br />
conditioned by forced air type systems and perimeter finned tube radiation.<br />
All restroom spaces are exhausted.<br />
The Chiller Plant is not run year round and chilled water is not available to provide<br />
cooling for computer equipment. Separate Direct Expansion (DX) Air Conditioning<br />
split systems cool these spaces.<br />
Bag makeup and tug area and truck receiving dock areas are exhausted with a<br />
ducted system. Hot water (HW) unit heaters provide heating. Concession Food<br />
Prep areas are limited in <strong>Terminal</strong>s A, B, and C.<br />
3.5.2.5 Aircraft Specialty Equipment<br />
Currently <strong>Terminal</strong>s A, B, and C use point-of-use preconditioned air and 400 hertz<br />
motor generator units at each gate. These systems are preferred by KCI and the<br />
Airlines. If a single unit fails it does not impact the rest of the gates. Point of Use<br />
(POU) technology also makes it easier to assign costs given that each loading<br />
bridge is self-sufficient. Ground Support Equipment (GSE) Quick Charging Stations<br />
are not used.<br />
3.5.2.6 Plumbing Items<br />
DRAFT<br />
Water Service is currently provided to <strong>Terminal</strong>s A, B, and C from a KCMO Water<br />
Service 12-inch diameter water main located landside. Water enters the buildings<br />
in the mechanical rooms through a backflow preventer and a pipe splits it into cold<br />
water (CW) and HW mains. The HW main is heated by the HW boilers (described<br />
previously). Water softeners for the HW system are provided in the boiler room.<br />
The three existing terminals are protected with a fire sprinkler system and<br />
standpipes per National Fire Prevention Administration (NFPA) 13, Installation of<br />
Sprinkler Systems. Only one airside fire hydrant exists near the terminals and is<br />
located near on the southeast side of <strong>Terminal</strong> C. See Exhibit FP-1, Fire Protection<br />
Existing Conditions (in Appendix X). <strong>Terminal</strong> sanitary sewers drain by gravity to<br />
the sewer mains. Individual grease traps are used in food preparation areas for<br />
grease waste from the concessions, where needed.<br />
Natural Gas serves the HW boilers, domestic hot water boilers, and concessions in<br />
each terminal. The gas is piped to the Boiler Room from a 10-inch diameter main<br />
from Missouri Gas & Energy. The gas pressure in the main is 25 pound-force per<br />
square inch psig.<br />
Landrum & Brown Page 118<br />
April 2013
KANSAS CITY NEW TERMINAL STUDY<br />
ADVANCE TERMINAL PLANNING STUDY<br />
PROGRAM CRITERIA DOCUMENT<br />
DRAFT<br />
Roof drains and emergency overflow roof drains are spaced as needed on the<br />
terminal roofs for stormwater. Stormwater leaders are sized per the plumbing code<br />
and run down the interior of a building to the stormwater system.<br />
3.5.2.7 Electrical Items<br />
A total connected load of 15.76MW will be required to service the New 1.015M SF<br />
<strong>Terminal</strong> based on a break out of the New <strong>Terminal</strong> square footage per function as<br />
shown in Table 3.5-2, New <strong>Terminal</strong> Power Requirements.<br />
Table 3.5-2<br />
NEW TERMINAL POWER REQUIREMENTS<br />
Area<br />
Schedule<br />
SF<br />
Lighting<br />
W/SF<br />
Power<br />
W/SF<br />
HVAC<br />
W/SF<br />
IT/COMM<br />
W/SF<br />
Security<br />
W/SF<br />
Total<br />
Aircraft Gates 85,772 3.50 4.00 6.50 4.00 4.00 1,886,984.00<br />
Airline Clubs 4,251 2.00 1.00 6.50 1.00 2.00 53,137.50<br />
Airline<br />
Operations<br />
Airline Ticket<br />
Office<br />
Baggage<br />
Handling<br />
95,922 3.50 1.00 6.50 2.00 2.00 1,438,830.00<br />
9,886 3.50 1.00 6.50 2.00 2.00 148,290.00<br />
96,957 2.00 8.00 6.50 1.00 2.00 1,890,661.50<br />
Circulation 242,871 1.00 0.50 6.50 0.25 0.50 2,125,121.25<br />
Concession<br />
Support<br />
Domestic<br />
Baggage<br />
Claim<br />
Domestic<br />
Ticket<br />
Counter<br />
International<br />
Ticketing<br />
Miscellaneous<br />
Tenants<br />
Non-Airline<br />
Tenants<br />
17,987 1.00 1.00 6.50 1.00 0.50 179,870.00<br />
59,280 3.00 8.00 6.50 1.00 1.00 1,155,960.00<br />
17,676 3.50 1.00 6.50 2.00 1.00 247,464.00<br />
2,867 3.50 1.00 6.50 2.00 1.00 40,138.00<br />
5,883 3.50 1.00 6.50 2.00 1.00 82,362.00<br />
11,699 3.50 1.00 6.50 2.00 1.00 163,786.00<br />
Other Space 57,986 3.50 1.00 6.50 1.00 1.00 753,818.00<br />
Public<br />
Restrooms<br />
18,154 2.00 0.50 6.50 0.25 0.50 177,001.50<br />
Retail 85,280 3.00 1.00 6.50 2.00 1.00 1,151,280.00<br />
Security 40,483 3.50 4.00 6.50 4.00 4.00 890,626.00<br />
<strong>Terminal</strong><br />
Function<br />
DRAFT<br />
129,324 2.00 8.00 6.50 2.00 2.00 2,651,142.00<br />
US Customs 33,182 3.50 4.00 6.50 4.00 4.00 730,004.00<br />
<strong>Terminal</strong><br />
Sub-Total 1,015,460 15,766,475.75<br />
Source:<br />
HNTB Corporation Analysis based on 2012 RS MEANS DIVISION 26 and historical data.<br />
Landrum & Brown Page 119<br />
April 2013
KANSAS CITY NEW TERMINAL STUDY<br />
ADVANCE TERMINAL PLANNING STUDY<br />
PROGRAM CRITERIA DOCUMENT<br />
DRAFT<br />
Per KCP&L meter readings, the existing Peak kW demand between the months of<br />
June and August 2012, for the three terminals are:<br />
<br />
<br />
<br />
<strong>Terminal</strong> A - 1240.2kW<br />
<strong>Terminal</strong> B - 2138.9kW<br />
<strong>Terminal</strong> C - 1359kW<br />
The 2138.9kW peak at <strong>Terminal</strong> B is due to higher levels of passenger traffic at<br />
<strong>Terminal</strong> B. However, it is assumed that during construction, once <strong>Terminal</strong> A has<br />
been demolished and the passenger traffic has been diverted to <strong>Terminal</strong>s C and B,<br />
both terminals will see an increase in load. See below for estimated loads on<br />
<strong>Terminal</strong>s B and C during construction, assuming an even distribution of passenger<br />
traffic: <strong>Terminal</strong> B, 2400kW and <strong>Terminal</strong> C, 2400kW.<br />
3.5.2.8 Gate Power Requirements<br />
Using a function per gate approach to calculate the load at the gates, a total<br />
connected load of 8.4MW will be required to service the proposed 41 gates. Power<br />
to these gates will be fed via adjacent gate sub-electrical rooms. This calculation<br />
includes Rapid Recharge Stations at 75 percent of the gates, as well as point of use<br />
400Hz service and pre-conditioned air, as shown on Table 3.5-3, Gate<br />
Requirements.<br />
Table 3.5-3<br />
GATE REQUIREMENTS<br />
Gate Requirements<br />
DRAFT<br />
Watts per Gate<br />
400Hz Power 100,000<br />
AHU 50,000<br />
Rapid Recharge 40,000<br />
Lighting 10,000<br />
PWC 5,000<br />
41 Gates Sub-Total 8,405,000<br />
Source:<br />
HNTB Corporation<br />
Despite the fact that only 37 gates will be installed under the Phase 1 build out of<br />
<strong>Terminal</strong> A, the infrastructure for the additional four gates will need to be<br />
considered in the planning process.<br />
3.5.2.9 CUP Power Requirements<br />
In addition to providing Chilled Water to the existing terminals, the existing CUP is<br />
currently the KCP&L central hub for electrical distribution to the existing terminals<br />
and ancillary buildings, including the Airfield Lighting Vault, ATCT, and Data Center.<br />
This type of consolidated power distribution leaves the Airport vulnerable to<br />
Landrum & Brown Page 120<br />
April 2013
KANSAS CITY NEW TERMINAL STUDY<br />
ADVANCE TERMINAL PLANNING STUDY<br />
PROGRAM CRITERIA DOCUMENT<br />
DRAFT<br />
campus-wide outages due to a single point of failure. In addition, demolition and<br />
relocation of the existing CUP would require a cut-over of electrical power for the<br />
entire Airport.<br />
The Base Case approach to the New <strong>Terminal</strong> allows the existing CUP to remain in<br />
place and provides for two new feeders from KCP&L directly to a distribution point<br />
within the New <strong>Terminal</strong>, bypassing the existing CUP. The Preferred Alternative,<br />
discussed later in the PCD, will require the relocation of the existing CUP but<br />
isolates the new Data Center and COP shop on independent feeders.<br />
Despite the independent feeders to the New <strong>Terminal</strong> and the Data Center, this is<br />
not a redundant installation since, for all scenarios power comes from an existing<br />
KCP&L Substation – KCI. In order to provide a truly redundant power system,<br />
additional feeders would have to be picked up from one of the other two adjacent<br />
KCP&L substations: Tiffany Springs Substation and Overhaul Base Substation.<br />
This is discussed later in this document.<br />
The new CUP, providing chilled water only to the terminals and ancillary buildings<br />
will require a total connected load of 5.5MW, and the renovated CUP will require a<br />
total connected load of 3.6MW as shown in Table 3.5-4, CUP Requirements.<br />
Table 3.5-4<br />
CUP REQUIREMENTS<br />
New CUP<br />
Qty.<br />
Unit<br />
Amps Volts Unit Watts<br />
Total<br />
Watts<br />
1500Ton Chillers 3.00 176.95 4160.00 1275000.00 3825000.00<br />
DRAFT<br />
150HP Primary Pumps 3.00 180.00 480.00 149649.19 448947.57<br />
150HP Secondary Pumps 3.00 180.00 480.00 149649.19 448947.57<br />
1500Ton Cooling Towers 3.00 20.82 4160.00 150000.00 450000.00<br />
100HP Condenser Water Pumps 3.00 125.00 480.00 103923.05 311769.15<br />
Power 24000.00 2.50 60000.00<br />
Lighting 24000.00 1.50 36000.00<br />
IT/Security/COMM 24000.00 0.50 12000.00<br />
Total CUP Mechanical<br />
Load 5,592,664<br />
CUP Renovation Qty. Unit A V Unit W Total W<br />
1500Ton Chillers 2.00 176.95 4160.00 1275000.00 2550000.00<br />
150HP Primary Pumps 2.00 180.00 480.00 149649.19 299298.38<br />
150HP Secondary Pumps 2.00 180.00 480.00 149649.19 299298.38<br />
1500Ton Cooling Towers 2.00 20.82 4160.00 150000.00 300000.00<br />
100HP Condenser Water Pumps 2.00 125.00 480.00 103923.05 207846.10<br />
Total CUP Mechanical<br />
Load 3,656,443<br />
Source:<br />
HNTB Corporation<br />
Landrum & Brown Page 121<br />
April 2013
KANSAS CITY NEW TERMINAL STUDY<br />
ADVANCE TERMINAL PLANNING STUDY<br />
PROGRAM CRITERIA DOCUMENT<br />
DRAFT<br />
3.5.2.10 Total Power Requirements<br />
The total connected power at the New <strong>Terminal</strong> including gates and a new CUP will<br />
be 29.6MW. The total connected power at the New <strong>Terminal</strong> including gates and a<br />
renovated CUP will be 27.7MW. With a demand of 40 percent on the terminal<br />
based on historical comparisons, the New <strong>Terminal</strong> and gates will have a total<br />
demand load of 11.84MW, and the new CUP, 2.5MW.<br />
3.5.2.11 Emergency and Stand-by Power Requirements<br />
Basic code required Emergency Egress and Fire Life Safety requirements include:<br />
smoke control, elevator return, egress lighting requirements, and terminal<br />
evacuation to dedicated evacuation sites. This can be facilitated by local individual<br />
battery units, at each light fixture and smoke control unit, or as central power unit<br />
that can consist of emergency generators or battery backed-up UPS systems.<br />
Additional stand-by, non-code required back-up power can be provided for freeze<br />
protection, additional elevator functionality, additional lighting, emergency powered<br />
gate systems that allow for the controlled egress from aircraft at designated gates,<br />
and other systems that allow for a more coordinated, public friendly terminal<br />
evacuation.<br />
3.5.2.12 Fire Alarm System Requirements<br />
A new fully addressable Fire Alarm System will need to be incorporated into the<br />
New <strong>Terminal</strong>. This system will have to be tied back into a main Fire Alarm control<br />
panel room, in accordance with the local Fire Department, within the <strong>Terminal</strong> as<br />
well as back to the main emergency response center at the Airport Rescue and<br />
Firefighting facility (ARFF) and/or Police shop. These new systems will have to be<br />
capable of interfacing with the existing Fire Alarm systems within existing <strong>Terminal</strong>s<br />
B and C, as well as other existing ancillary buildings to remain. Additional<br />
migrating hardware and or software may be required in order to fully integrate the<br />
different systems.<br />
DRAFT<br />
3.5.2.13 Fire Alarm System Requirements<br />
A new fully addressable Fire Alarm System will need to be incorporated into the<br />
New <strong>Terminal</strong>. This system will have to be tied back into a main Fire Alarm control<br />
panel room, in accordance with the local Fire Department, within the <strong>Terminal</strong> as<br />
well as back to the main emergency response center at the Airport Rescue and<br />
Firefighting facility (ARFF) and/or Police shop. These new systems will have to be<br />
capable of interfacing with the existing Fire Alarm systems within existing <strong>Terminal</strong>s<br />
B and C, as well as other existing ancillary buildings to remain. Additional<br />
migrating hardware and or software may be required in order to fully integrate the<br />
different systems.<br />
Landrum & Brown Page 122<br />
April 2013
KANSAS CITY NEW TERMINAL STUDY<br />
ADVANCE TERMINAL PLANNING STUDY<br />
PROGRAM CRITERIA DOCUMENT<br />
DRAFT<br />
3.5.2.14 IT Requirements<br />
A portion of the existing Fiber Optic Loop System will have to be re-routed in order<br />
to maintain the double ended feed to existing <strong>Terminal</strong>s B and C through the ACC in<br />
the existing CUP, during the demolition and construction of <strong>Terminal</strong> A. In addition,<br />
final connections will have to be made from the Central Communications Hub, the<br />
<strong>Terminal</strong>, and the existing Fiber Optic Loop system. These cut-overs will have to be<br />
strategically coordinated in order to avoid shutdowns of any secure or mission<br />
critical systems.<br />
The Fiber Optic Loop System will need to be extended into the New <strong>Terminal</strong><br />
through a Main Point of Entrance (MPOE) room or Main Distribution Frame (MDF)<br />
Room. The MPOE/MDF room will also be a central connection point for all telephone<br />
and cable TV connections, including Fiber Optic Converters, Cisco type routers and<br />
switches, centralized telephone and Fire Alarm interface for the PA system, head<br />
units for Electronic Visual Information Display System (eVIDS), Common Use<br />
<strong>Terminal</strong>s, as well as Automated Critical Asset Management System (ACAMS) and<br />
Closed Circuit TV (CCTV).<br />
Intermediate Distribution Frame (IDF) rooms will be required on the apron level to<br />
house routers for connections to local airline Gate Information Display System<br />
(GIDS); connections to airline and passenger WIFI routers; local eVIDS systems;<br />
amplifiers, noise sensors and network switches for local Public Address (PA)<br />
systems; ACAMS security panels for local doors; CCTV network hubs for signal<br />
consolidation and local viewing if required by individual airlines; local Fire Alarm<br />
sub-panels and UPS units to maintain system power during brown outs or during<br />
generator start-up. In addition each IDF and MPOE/MDF will be required to have a<br />
dedicated UPS powered air-conditioning unit separate from the <strong>Terminal</strong> cooling<br />
system.<br />
DRAFT<br />
The existing Data Center and the Airport Communications Center (ACC) in the<br />
existing CUP were renovated in 2011. Although both of these centers are in likenew<br />
condition with upgraded IT systems, modifications will have to be made in<br />
order to support the New <strong>Terminal</strong>.<br />
Landrum & Brown Page 123<br />
April 2013
KANSAS CITY NEW TERMINAL STUDY<br />
ADVANCE TERMINAL PLANNING STUDY<br />
PROGRAM CRITERIA DOCUMENT<br />
DRAFT<br />
4. LANDSIDE REQUIREMENTS<br />
The 2008 MP identified a new terminal south of Runway 9/27, and a new terminal<br />
curb-front and loop roadway system. The new roadway system was to consist of a<br />
new south access roadway from Missouri Route 152 (M-152), and an upgrade of<br />
I-435 and I-29 ramps connecting to M-152. These changes would affect regional<br />
transportation patterns, which are traditionally considered within a 20-year time<br />
frame. Because new airport access would have a permanent impact on regional<br />
transportation in the Northland as well as the entire metropolitan area, a Regional<br />
Travel <strong>Study</strong> was conducted as an early part of the <strong>Advance</strong> <strong>Terminal</strong> <strong>Planning</strong><br />
<strong>Study</strong> in order to provide an evaluation of providing access to a new airport<br />
terminal on M-152 instead of the existing Cookingham Drive access. Following a<br />
capital cost assessment of a new terminal south of Runway 9/27, it was determined<br />
that this southern terminal was beyond the financial affordability threshold so more<br />
economical sites near the existing terminals were subsequently explored.<br />
The requirements in this section focus on the new terminal in the selected<br />
<strong>Terminal</strong> A site.<br />
DRAFT<br />
Landrum & Brown Page 124<br />
April 2013
KANSAS CITY NEW TERMINAL STUDY<br />
ADVANCE TERMINAL PLANNING STUDY<br />
PROGRAM CRITERIA DOCUMENT<br />
DRAFT<br />
4.1 Regional Access<br />
KCI is located directly adjacent to the regional highways I-29 and I-435, and<br />
approximately 15 miles northwest of downtown Kansas City, located in Platte<br />
County. Figure 4.1-1, Regional <strong>Study</strong> Area, shows the location of the Airport<br />
from a regional perspective.<br />
Figure 4.1-1<br />
REGIONAL STUDY AREA<br />
DRAFT<br />
Source:<br />
HNTB Corporation<br />
Landrum & Brown Page 125<br />
April 2013
KANSAS CITY NEW TERMINAL STUDY<br />
ADVANCE TERMINAL PLANNING STUDY<br />
PROGRAM CRITERIA DOCUMENT<br />
DRAFT<br />
As shown in Figure 4.1-2, Airport Access, the Airport is surrounded by I-435 on<br />
the west, I-29/US 71 on the north and east, and M-152 on the south. Both local<br />
service interchanges and regional system interchanges are shown with a blue dot.<br />
It is assumed that since the new terminal will be located in the existing <strong>Terminal</strong> A<br />
site, access would remain from the existing Cookingham interchange. Analysis took<br />
into account the 2020 and 2040 future land development as presented in the<br />
Mid-America Regional Council (MARC) regional Long-Range Transportation Plan.<br />
Figure 4.1-2<br />
AIRPORT ACCESS<br />
DRAFT<br />
Source:<br />
HNTB Corporation<br />
Landrum & Brown Page 126<br />
April 2013
KANSAS CITY NEW TERMINAL STUDY<br />
ADVANCE TERMINAL PLANNING STUDY<br />
PROGRAM CRITERIA DOCUMENT<br />
DRAFT<br />
4.1.1 AIRPORT TRAVEL MARKET<br />
Understanding where airport users (passengers and employees) are traveling to<br />
and from in the Kansas City metropolitan area helps to identify target any issues<br />
with the regional network and necessary transportation improvements. The MARC<br />
regional travel demand model was used to analyze existing and future travel<br />
markets to and from KCI (as shaded in Figure 4.1-2) for trips originating or<br />
terminating in the metropolitan area. The regional travel market assessment used<br />
a six step process, as listed below.<br />
1. Airport zone land use assumptions were reviewed.<br />
2. Regional model traffic analysis zones (TAZs), or travel markets, were<br />
aggregated into super TAZs, as shown in Figure 4.1-3, Travel Demand<br />
Model Traffic Analysis Zones (TAZs).<br />
3. Auto and transit trip origins and destinations were reviewed between travel<br />
markets.<br />
4. Vehicle trips were analyzed for Existing (2010) conditions based on MARC’s<br />
travel demand model.<br />
5. Vehicle trips were analyzed for the MP (2020 and 2040). KCI vehicle trips<br />
were coded in the MARC model as special generator trips. The MARC travel<br />
demand model typically utilizes a gravity model which gives priority to trips<br />
that are close in proximity to other zones. However, special generators, such<br />
as the Airport, assign vehicle trips based on other factors such as household<br />
income. The KCI passenger trips were not assigned based on any passenger<br />
surveys performed at the airport.<br />
DRAFT<br />
6. The Airport Passenger Survey data was used to compare to the regional<br />
model.<br />
Landrum & Brown Page 127<br />
April 2013
KANSAS CITY NEW TERMINAL STUDY<br />
ADVANCE TERMINAL PLANNING STUDY<br />
PROGRAM CRITERIA DOCUMENT<br />
DRAFT<br />
Figure 4.1-3<br />
TRAVEL DEMAND MODEL TRAFFIC ANALYSIS ZONES (TAZS)<br />
DRAFT<br />
Source:<br />
MARC Regional Model<br />
Landrum & Brown Page 128<br />
April 2013
KANSAS CITY NEW TERMINAL STUDY<br />
ADVANCE TERMINAL PLANNING STUDY<br />
PROGRAM CRITERIA DOCUMENT<br />
DRAFT<br />
4.1.2 TRAVEL MARKET PASSENGER SURVEY<br />
In March 2012 a KCI passenger intercept survey was conducted in the gate<br />
holdrooms prior to flight departure. Twenty-one hundred surveys were properly<br />
completed and data summarized for use in this analysis.. Details and conclusions<br />
of the Passenger Survey are discussed in Section 1.2, Passenger Surveys, of this<br />
document. The passenger survey results regarding travel mode choice and regional<br />
access are presented in Table 4.1-1, Passenger Survey Mode Choice and<br />
Regional Access. These survey results only include airport passengers and do not<br />
represent airport employees.<br />
Table 4.1-1<br />
PASSENGER SURVEY MODE CHOICE AND REGIONAL ACCESS<br />
KCI Passenger Survey Response<br />
62 percent are local metro area residents<br />
38 percent are visitors<br />
85 percent come in a privately-owned car.<br />
85 percent come in a privately-owned car<br />
and 67 percent park at the airport<br />
Most passengers use I-29 and I-435 to<br />
access the Airport<br />
Privately-owned cars (68 percent) and<br />
rental cars (18 percent) are the primary<br />
modes of transportation<br />
Passenger travel times<br />
Effect on Regional Travel<br />
Visitors are more likely to arrive at the<br />
Airport via a mode different than a<br />
privately-owned vehicle such as rental car,<br />
transit, or drop-off.<br />
This could be a privately-owned car or rental<br />
car. This increases the number of trips<br />
attracted to the airport.<br />
The difference represents the curbside<br />
drop-offs.<br />
This does not include other users such as<br />
employees.<br />
Transit was not included in the mode share<br />
data. There is currently transit service to<br />
<strong>Terminal</strong> C.<br />
DRAFT<br />
Some peak airport times are off-peak of<br />
background regional roadway traffic.<br />
A detailed regional traffic study looks at the<br />
peak of the total regional roadway traffic<br />
which includes the background traffic and<br />
airport traffic.<br />
Source:<br />
Kansas City International Airport New <strong>Terminal</strong> <strong>Advance</strong> <strong>Planning</strong>, Passenger Survey<br />
Landrum & Brown Page 129<br />
April 2013
KANSAS CITY NEW TERMINAL STUDY<br />
ADVANCE TERMINAL PLANNING STUDY<br />
PROGRAM CRITERIA DOCUMENT<br />
DRAFT<br />
4.1.3 MARC MODEL ASSESSMENT<br />
To plan for the transportation infrastructure needs, it is important to understand<br />
the travel markets served by the Airport. These markets are served by a regional<br />
transportation network that serves both “trips to work” and passengers or airport<br />
travelers.<br />
KCI serves workers and passengers from all over the metropolitan area and outside<br />
the metropolitan area. Table 4.1-2, Summary of Total User Markets Served<br />
To and From the KCI Airport – By Zone, lists the local markets served in the<br />
metropolitan area both today and in the future based on MARC’s regional travel<br />
model. Figure 4.1-3 in Section 4.1.1 shows all the traffic analysis zones (TAZs).<br />
Table 4.1-2<br />
SUMMARY OF TOTAL USER MARKETS SERVED TO AND FROM THE KCI<br />
AIRPORT – BY ZONE<br />
Zone<br />
Description<br />
2010 2020 2040<br />
A Local KCI Area 11% 10% 8%<br />
B North I-29 6% 10% 16%<br />
C North I-435 10% 8% 6%<br />
D South I-435 From Northwest 3% 3% 2%<br />
E South I-435 From I-70 1% 1% 1%<br />
F South I-435 From Southwest 13% 13% 13%<br />
DRAFT<br />
G South I-29 From I-635 4% 4% 3%<br />
H South I-29 13% 12% 10%<br />
I South I-29 From I-70 9% 8% 7%<br />
J South I-29 From Southeast 8% 7% 7%<br />
K East M-152 From Northeast 22% 24% 27%<br />
Total 100% 100% 100%<br />
Note:<br />
Source:<br />
Largest travel markets by zone are shaded.<br />
MARC Regional Model<br />
Landrum & Brown Page 130<br />
April 2013
KANSAS CITY NEW TERMINAL STUDY<br />
ADVANCE TERMINAL PLANNING STUDY<br />
PROGRAM CRITERIA DOCUMENT<br />
DRAFT<br />
As shown in Table 4.1-3, the largest travel markets by zone today and in the future<br />
are zones F, H, and K, respectively. These markets provide the largest interaction<br />
with the Airport because of proximity and number of trips to and from the Airport.<br />
Table 4.1-3, Summary of Total User Markets Served To and From KCI – By<br />
District, shows the markets served in the metropolitan area both today and in the<br />
future based on MARC’s regional travel model by aggregated district. Figure 4.1-6<br />
in Section 4.1.1 shows the zones. Today, an estimated 16 percent of the total<br />
vehicle trips (passengers and employees) to and from the Airport are from the<br />
North, 21 percent are from the Southwest (Kansas), and 63 percent are from the<br />
southeast (Missouri).<br />
Table 4.1-3<br />
SUMMARY OF TOTAL USER MARKETS SERVED TO AND FROM KCI - BY<br />
DISTRICT<br />
District<br />
North<br />
S.W.<br />
S.E.<br />
Note:<br />
Source:<br />
1<br />
Description<br />
North of KCI<br />
(Missouri)<br />
Johnson and<br />
Wyandotte Counties<br />
(Kansas)<br />
2010 2020 2040<br />
Passengers<br />
Only<br />
Existing<br />
Total 1<br />
3% 16% 18% 22%<br />
35% 21% 20% 19%<br />
Jackson, Clay,<br />
Platte and Cass<br />
south and east of<br />
62% 63% 62% 59%<br />
KCI. (Missouri)<br />
Total 100% 100% 100% 100%<br />
DRAFT<br />
Passengers and employees<br />
MARC Regional Model<br />
Previous data has indicated a travel market share to and from the Airport as much<br />
as 45 percent from Johnson County. However, this number was based on a license<br />
plate survey of the long-term parking lot and does not reflect all trips to the Airport<br />
including transit trips, drop-offs, and employees.<br />
Historically, one to three percent of the region’s travel trips to and from KCI are by<br />
Kansas City Area Transportation Authority (KCATA) transit bus service. This<br />
percentage is higher if other high-occupant modes, such as shared-ride vans, are<br />
included. KCATA currently operates the 129 and 129X routes to the Airport which<br />
carry 543 people per day on over 21 round trips as shown in Figure 4.1-4, KCI<br />
Transit Service.<br />
Landrum & Brown Page 131<br />
April 2013
KANSAS CITY NEW TERMINAL STUDY<br />
ADVANCE TERMINAL PLANNING STUDY<br />
PROGRAM CRITERIA DOCUMENT<br />
DRAFT<br />
Figure 4.1-3<br />
KCI TRANSIT SERVICE<br />
DRAFT<br />
Source:<br />
KCATA<br />
Landrum & Brown Page 132<br />
April 2013
KANSAS CITY NEW TERMINAL STUDY<br />
ADVANCE TERMINAL PLANNING STUDY<br />
PROGRAM CRITERIA DOCUMENT<br />
DRAFT<br />
The MARC regional model was used to determine what roadways KCI users take to<br />
and from the Airport today and in the future. Figure 4.1-5, Existing (2010)<br />
Daily Travel Patterns To/From KCI – Example, shows what routes KCI users<br />
travel today. Figures future travel patterns are provided in the <strong>Terminal</strong> Area<br />
Master Plan.<br />
Figure 4.1-5<br />
EXISTING (2010) DAILY TRAVEL PATTERNS TO/FROM KCI – EXAMPLE<br />
DRAFT<br />
Source:<br />
MARC Regional Model<br />
Landrum & Brown Page 133<br />
April 2013
KANSAS CITY NEW TERMINAL STUDY<br />
ADVANCE TERMINAL PLANNING STUDY<br />
PROGRAM CRITERIA DOCUMENT<br />
DRAFT<br />
The Existing and Future Access average daily traffic (ADT) volumes, as reported by<br />
MoDOT in 2010 and projected for 20040 by MARC are shown in Figure 4.1-6,<br />
Existing and Future Two-Way Daily Traffic Volumes. Traffic volumes are<br />
depicted are the total for both directions.<br />
Figure 4.1-6<br />
EXISTING AND FUTURE TWO-WAY DAILY TRAFFIC VOLUMES<br />
DRAFT<br />
Source:<br />
MoDOT Count Map and MARC Regional Model<br />
Landrum & Brown Page 134<br />
April 2013
KANSAS CITY NEW TERMINAL STUDY<br />
ADVANCE TERMINAL PLANNING STUDY<br />
PROGRAM CRITERIA DOCUMENT<br />
DRAFT<br />
4.1.4 REGIONAL ACCESS<br />
Table 4.1-4, Regional Transportation Airport Access Routes, summarizes the<br />
percentage of airport trips using the each access route in 2010 and 2040.<br />
Table 4.1-5, Future Regional Access Route Traffic Volumes shows the total<br />
volume of traffic along these routes in 2020 and 2040. The number of KCI trips<br />
increased 1.2 percent from 2010 to 2020 and 4.4 percent from 2010 to 2040.<br />
However, route distribution to and from KCI does not change significantly from<br />
existing access to future existing access conditions. Primarily due to increased<br />
development east and north of KCI and freeway congestion affecting route choice.<br />
Table 4.1-4<br />
REGIONAL TRANSPORTATION AIRPORT ACCESS ROUTES<br />
Roadway 2010 2040<br />
I-29 north of KCI 9% 11%<br />
I-29 south to/from KCMO 23% 16%<br />
I-635 south to/from Kansas 17% 14%<br />
I-435 south to/from Kansas 5% 7%<br />
I-435 east of KCI 19% 26%<br />
M-152 east of KCI 5% 8%<br />
all other routes 22% 18%<br />
Source:<br />
MARC Regional Model<br />
DRAFT<br />
Table 4.1-5<br />
FUTURE REGIONAL ACCESS ROUTE TRAFFIC VOLUMES<br />
Roadway 2020 2040<br />
I-29 north of I-435/I-29 Split 55,473 73,807<br />
I-29 south of M-152 96,110 121,751<br />
I-29 south of Cookingham 70,875 85,755<br />
I-435 east of I-29 30,849 43,712<br />
M-152 west of Hampton Rd. 17,094 28,057<br />
M-152 west of Congress Ave. 19,045 58,121<br />
M-152 connection to KCI N/A N/A<br />
I-435 south of I-29 (west of KCI) 8,284 12,884<br />
Note:<br />
Source:<br />
These values are directly from the MARC model and may not compare well to the adjusted<br />
volumes.<br />
HNTB Corporation<br />
Landrum & Brown Page 135<br />
April 2013
KANSAS CITY NEW TERMINAL STUDY<br />
ADVANCE TERMINAL PLANNING STUDY<br />
PROGRAM CRITERIA DOCUMENT<br />
DRAFT<br />
Today, the Kansas City metropolitan area freeway network is relatively free of<br />
congestion with only 8.6 percent of the regional freeways and expressways<br />
currently operating above their capacity. However, by 2040 the region is expected<br />
to have 18.2 percent of its freeways and expressways operate over capacity, as<br />
shown in Table 4.1-6, Percent of Regional Freeway Congested.<br />
Table 4.1-6<br />
PERCENT OF REGIONAL FREEWAYS CONGESTED<br />
Scenario<br />
Percent Congested<br />
Freeways<br />
Existing Access (2010) 8.6%<br />
Existing Access (2040) 18.2%<br />
M-152 Access (2040) 18.2%<br />
Note:<br />
Source:<br />
Congested freeways are defined as interstates and state highways that have volume to<br />
capacity ratio greater than 1.0. The MARC 2040 Model includes all of the fiscally constrained<br />
Long-Range Transportation Plan Projects identified for the region.<br />
MARC Regional Model.<br />
In 2010, there were several existing freeway bottlenecks that played affected<br />
access to/from KCI. According to the MARC travel demand model, I-29, north of<br />
downtown, was one of the worst bottlenecks in the region (as shown in Appendix X,<br />
Figure X-6). However, this location was improved in 2011 when MoDOT widened<br />
the corridor from four lanes to six lanes, plus auxiliary lanes from the northeast<br />
corner of the downtown loop to the I-29/I-35 split. Other congested corridors<br />
according to the MARC travel demand model include:<br />
<br />
<br />
<br />
<br />
I-35 in Johnson County<br />
I-435 in southern Johnson and Jackson counties<br />
I-70 east of downtown Kansas City, Missouri<br />
US-71 south of downtown Kansas City, Missouri<br />
The corridors that are congested in 2010 also are congested in 2040 (as shown in<br />
Appendix X, Figure X-7). Additional bottlenecks that will cause airport travelers<br />
delays in 2040 include:<br />
<br />
<br />
<br />
U.S. 169 north of downtown<br />
I-29 north of the I-29 central business district<br />
I-635 over the Missouri River<br />
M-152 east of I-29<br />
DRAFT<br />
Table 4.1-7, Existing and Forecast Cookingham Drive Traffic Generation,<br />
shows existing and forecast passenger enplanements, average daily vehicle trips<br />
(ADT), and peak hour roadway capacity. In order to validate the model output<br />
showing adequate operations of Cookingham Drive in the future, a non-model<br />
technique was utilized. It was assumed that all of the daily traffic using<br />
Cookingham Drive today is tied to Airport demand. Therefore, the current ADT<br />
Landrum & Brown Page 136<br />
April 2013
KANSAS CITY NEW TERMINAL STUDY<br />
ADVANCE TERMINAL PLANNING STUDY<br />
PROGRAM CRITERIA DOCUMENT<br />
DRAFT<br />
divided by enplaned passengers was used as the existing and future traffic<br />
generation rate. Airport employee growth is also tied to passenger growth and the<br />
projected increase in passengers would account for the associated increase in<br />
employee trips along Cookingham Drive. To show the future ADT on Cookingham<br />
Drive in Table 4.1-7, a volume to capacity ratio was developed using the 2010 HCM<br />
threshold of 58,000 vehicles per day, which is projected to be 0.75 in 2030.<br />
This means that through the design year, the two lane ramps to and from I-29 are<br />
expected to be sufficient to meet the traffic demand. However, as peak hour<br />
volume to capacity increase approaches 0.85, planning for transportation<br />
enhancements to accommodate increased demand should be considered.<br />
Table 4.1-7<br />
EXISTING AND FORECAST COOKINGHAM DRIVE TRAFFIC GENERATION<br />
Time<br />
Frame<br />
Daily<br />
Passenger<br />
Enplanemets<br />
ADT<br />
Daily<br />
Trips/Passenger<br />
Enplanement<br />
Peak Hour<br />
Volume/Capacity<br />
Existing 17,100 30,709 1.80 0.53<br />
Future<br />
(2030)<br />
24,100 43,380 1.80 0.75<br />
Note: Existing ADT, directional split and PHF from KCMO 2011/12 count. Capacity based on 2010<br />
LOS D/E capacity threshold.<br />
Source: HNTB Corporation<br />
4.1.5 AIRPORT TRAVEL TIMES<br />
Motorists’ travel time to and from the Airport is an excellent measure for evaluating<br />
regional transportation quality of service for Airport passengers and employees.<br />
To analyze current and historical airport travel time, two data sets from MARC were<br />
used.<br />
<br />
<br />
DRAFT<br />
2005/06 Travel Time Data - 2005/06 travel time data was collected by<br />
MARC staff on more than 1,600 miles of roadway in the metropolitan area.<br />
The study logged 70 routes throughout Kansas City metro area, including a<br />
cross-section of road types.<br />
2010 INRIX Travel Time Data – MARC recently purchased 2010 INRIX<br />
data. INRIX is a private provider of traffic information, directions, and driver<br />
services.<br />
Travel times to the Airport are shown in Figure 4.1-7, 2010 AM Peak Period<br />
Travel Time Intervals To KCI Airport, and regional activity centers are<br />
summarized in Table 4.1-8, 2010 AM Peak Period Travel Times To KCI<br />
Airport. Travel times from the Airport are shown in Figure 4.1-8, 2010 PM Peak<br />
Period Travel Time Intervals to KCI Airport, and regional activity centers are<br />
summarized in Table 4.1-9, 2010 PM Peak Period Travel Times To KCI<br />
Airport.<br />
Landrum & Brown Page 137<br />
April 2013
KANSAS CITY NEW TERMINAL STUDY<br />
ADVANCE TERMINAL PLANNING STUDY<br />
PROGRAM CRITERIA DOCUMENT<br />
DRAFT<br />
Figure 4.1-7<br />
2010 AM PEAK PERIOD TRAVEL TIME INTERVALS TO KCI AIRPORT<br />
Source:<br />
MARC, 2010 INRIX Data<br />
DRAFT<br />
Table 4.1-8<br />
2010 AM PEAK PERIOD TRAVEL TIMES TO KCI AIRPORT<br />
Activity Center<br />
Downtown<br />
Lee’s Summit (I-470/US 50)<br />
Johnson County (I-435/US 69)<br />
Travel Time<br />
19 minutes<br />
41 minutes<br />
33 minutes<br />
Source:<br />
INRIX 2010 Data<br />
Landrum & Brown Page 138<br />
April 2013
KANSAS CITY NEW TERMINAL STUDY<br />
ADVANCE TERMINAL PLANNING STUDY<br />
PROGRAM CRITERIA DOCUMENT<br />
DRAFT<br />
Figure 4.1-8<br />
2010 PM PEAK PERIOD TRAVEL TIMES INTERVALS FROM KCI AIRPORT<br />
DRAFT<br />
Source:<br />
MARC, 2010 INRIX Data<br />
Table 4.1-9<br />
2010 PM PEAK PERIOD TRAVEL TIMES FROM KCI AIRPORT<br />
Activity Center<br />
Downtown<br />
Lee’s Summit (I-470/US 50)<br />
Johnson County (I-435/US 69)<br />
Travel Time<br />
19 minutes<br />
38 minutes<br />
35 minutes<br />
Source:<br />
INRIX 2010 Data<br />
Landrum & Brown Page 139<br />
April 2013
KANSAS CITY NEW TERMINAL STUDY<br />
ADVANCE TERMINAL PLANNING STUDY<br />
PROGRAM CRITERIA DOCUMENT<br />
DRAFT<br />
When you compare 2010 travel time data to 2005/06 travel time data, trends can<br />
be identified. Figure 4.1-9, AM Peak Period Travel Times to KCI Airport<br />
(Change from 2005 to 2010), shows the changes in travel time to the Airport.<br />
As shown in the figures, AM peak hour travel times between the Airport and<br />
downtown slightly increased, AM peak hour travel times between the Airport and<br />
Lee’s Summit decreased, and AM peak hour travel times between the Airport and<br />
Johnson County decreased.<br />
Figure 4.1-9<br />
AM PEAK PERIOD TRAVEL TIMES TO KCI AIRPORT<br />
(Change from 2005 to 2010)<br />
DRAFT<br />
Source:<br />
INRIX 2010 Data<br />
Landrum & Brown Page 140<br />
April 2013
KANSAS CITY NEW TERMINAL STUDY<br />
ADVANCE TERMINAL PLANNING STUDY<br />
PROGRAM CRITERIA DOCUMENT<br />
DRAFT<br />
As shown in Figure 4.1-10, PM Peak Period Travel Times from KCI Airport<br />
(Change from 2005 to 2010), the PM peak hour travel times between the Airport<br />
and downtown increased, PM peak hour travel times between the Airport and Lee’s<br />
Summit decreased, and PM peak hour travel times between the Airport and Johnson<br />
County decreased.<br />
Figure 4.1-10<br />
PM PEAK PERIOD TRAVEL TIMES FROM KCI AIRPORT<br />
(Change from 2005 to 2010)<br />
DRAFT<br />
Source:<br />
INRIX 2010 Data<br />
Landrum & Brown Page 141<br />
April 2013
KANSAS CITY NEW TERMINAL STUDY<br />
ADVANCE TERMINAL PLANNING STUDY<br />
PROGRAM CRITERIA DOCUMENT<br />
DRAFT<br />
4.1.6 SUMMARY<br />
The regional transportation infrastructure is anticipated to be sufficient to serve the<br />
airport’s needs through the planning period. Regional congestion identified by<br />
MARC will continue to exist until but will not prohibit access and the interchange at<br />
Cookingham Drive is sufficient to accommodate airport traffic through 2030. In the<br />
future, traffic along Cookingham Drive should be monitored and when the volume<br />
to capacity ratio beyond 2030 begins to approach 0.85 enhancements to the<br />
interchange should be considered to facilitate traffic access.<br />
4.2 <strong>Terminal</strong> Area Landside Requirements<br />
In this section, the methodology and summary of landside requirements are<br />
presented. Requirements are based on data presented in the 2008 Master Plan and<br />
additional data collected 2012 at the onset of this study. A comprehensive data<br />
collection effort was initiated in March 2012 corresponding to the passenger surveys<br />
and traffic counts, vehicle classification, dwell time observations and pedestrian<br />
crosswalk counts were collected and used to develop requirements for:<br />
<br />
<br />
<br />
<br />
<strong>Terminal</strong> Roadways<br />
Curbside Areas<br />
Vehicular Parking<br />
Commercial Vehicle Staging Area<br />
4.2.1 TERMINAL ROADWAYS<br />
DRAFT<br />
The peak hour traffic volumes collected on the International Circle entrance<br />
roadways were adjusted to account for the difference between a peak day in March<br />
and an average peak day in July (the design day). Volumes for courtesy shuttles<br />
were not increased as these shuttles would typically operate on similar schedules<br />
while carrying more passengers; however, all volumes attributable to demand<br />
driven vehicle modes (e.g. private vehicles [curbside and parking], taxicabs and<br />
limousines). A five percent adjustment was applied based on historic passenger<br />
volumes and characteristics of the peak day of March versus an average peak day<br />
in July. The volumes were projected to future years based on the forecast increase<br />
in O&D passengers and are presented in Table 4.2-1, Forecast Peak Hour<br />
Traffic Volumes. The capacity of the inbound and outbound roadways is assumed<br />
to be 900 vehicles per hour per lane, reflecting slowing speeds as vehicles approach<br />
the terminal area. <strong>Terminal</strong> arrivals and departures curbside roadway capacity is<br />
based on the decreasing capacity of each lane toward the terminal with the lane<br />
adjacent to the curbside drop-off / pick-up areas not accommodating any vehicle<br />
throughput. Associated lane requirements are shown in Table 4.2-2, Lane<br />
Requirements. As shown, the inbound and outbound roadways will require a<br />
minimum of two lanes in each direction this accommodates all traffic associated<br />
with the future terminal development plan.<br />
Landrum & Brown Page 142<br />
April 2013
KANSAS CITY NEW TERMINAL STUDY<br />
ADVANCE TERMINAL PLANNING STUDY<br />
PROGRAM CRITERIA DOCUMENT<br />
DRAFT<br />
The forecast traffic volumes and lane requirements for the terminal curbsides are<br />
also shown in Tables 4.2-1 and 4.2-2, respectively. Arrivals and Departures<br />
roadway volumes were increased as described above to account for the design day<br />
in July and then adjusted based on the combined traffic volumes at the existing<br />
terminals to reflect a single terminal with separate arrivals and departures levels.<br />
Vehicle trips associated with the inter-terminal Red Bus were removed and volumes<br />
were adjusted to account for commercial vehicles stopping only once at the new<br />
single terminal. The volumes and associated lane requirements shown in Tables<br />
4.2-1 and 4.2-2 assume a separate commercial vehicle curb serving both arriving<br />
and departing passengers. As a result, the departures curb requirement only<br />
reflects private vehicle, taxicab, and limousine drop-off, while the arrivals curb only<br />
reflects private vehicle pick-up. All other activity is assumed to be accommodated<br />
on the commercial vehicle curb.<br />
Table 4.2-1<br />
FORECAST PEAK HOUR TRAFFIC VOLUMES<br />
Location Existing 2015 2020 2025 2030<br />
Entrance International Circle 1 1,200 1,300 1,420 1,555 1,700<br />
Exit International Circle 1 1,200 1,300 1,420 1,555 1,700<br />
<strong>Terminal</strong> Arrivals Roadway 835 905 985 1,080 1,180<br />
<strong>Terminal</strong> Departures Roadway 730 790 865 945 1,035<br />
<strong>Terminal</strong> Commercial Vehicles<br />
Roadway<br />
185 190 205 225 245<br />
Note: 1 Volume will vary based on number of parking spaces and other uses provided within<br />
the terminal area. Specific requirement will be defined during concept development<br />
and refinement.<br />
Source: March 2012 Traffic Surveys and HNTB analysis based on forecast passenger growth.<br />
Table 4.2-2<br />
LANE REQUIREMENTS<br />
DRAFT<br />
Location Existing 2015 2020 2025 2030<br />
Entrance International Circle 1 2 2 2 2 2<br />
Exit International Circle 1 2 2 2 2 2<br />
<strong>Terminal</strong> Arrivals 3 3 4 4 4<br />
<strong>Terminal</strong> Departures 3 3 3 4 4<br />
<strong>Terminal</strong> Commercial Vehicles N/A N/A N/A N/A N/A<br />
Note: 1 Volume will vary based on number of parking spaces and other uses provided within<br />
the terminal area. Specific requirement will be defined during concept development<br />
and refinement.<br />
Source: HNTB analysis based on forecast peak hour traffic volumes.<br />
Landrum & Brown Page 143<br />
April 2013
KANSAS CITY NEW TERMINAL STUDY<br />
ADVANCE TERMINAL PLANNING STUDY<br />
PROGRAM CRITERIA DOCUMENT<br />
DRAFT<br />
4.2.2 CURBSIDES<br />
Curbside length requirements were calculated for private vehicle arrivals, private<br />
vehicle departures, and commercial vehicles, assuming a consolidated multi-level<br />
terminal building. The specific layout of the terminal building and curbsides may<br />
result in adjustments to the curbside requirements.<br />
Traffic volumes presented in Table 4.2-1 in the previous section were used to<br />
calculate curbside length requirements. The future overall airport peak hour<br />
arrivals, departures, and curbside volumes were developed by applying the vehicle<br />
classification percentages collected during the survey. Then future private vehicle,<br />
taxicab, and limousine volumes, which are demand driven; and single party vehicle<br />
modes, were estimated assuming that that the volumes would increase in direct<br />
proportion to the forecast increases in O&D airline passenger activity.<br />
This assumes no significant change in the proportion of connecting passengers,<br />
travel mode choice patterns, or the use of public parking (versus curbside pick-up<br />
or drop-off). Commercial courtesy vehicles serving multiple parties, such as<br />
parking, rental car, and hotel shuttles, were assumed to grow at half the rate of<br />
O&D passengers since these vehicles will typically increase passenger occupancy<br />
prior to adding shuttles during peak periods. Some growth will still occur as a<br />
result of new entrants serving the Airport, such as new off-airport hotels, and this<br />
growth is accounted for in the reduced growth rate.<br />
Curbside requirements were developed for each vehicle type by calculating the<br />
linear length required to accommodate vehicle loading and unloading activity using<br />
vehicle volumes, vehicle parking stall lengths, and proposed dwell time data<br />
presented in Table 4.2-4. Vehicle parking lengths are based on actual vehicle<br />
lengths plus an additional length to allow for space to maneuver in and out of<br />
curbside parking spaces. A Poisson distribution, a discrete probability distribution<br />
that identifies the probability of a given number of events occurring in a fixed<br />
interval of time, was applied to account for the randomness of vehicles arriving at<br />
the curbside and associated peaking within the peak hour. The curbside length<br />
requirement presented in Table 4.2-3, Required Departures Los C Curb Length<br />
(Feet), for the departures curb assumes only private vehicle, taxicab, and<br />
limousine activity will occur on the departures curbside. The arrivals curbside<br />
length requirement presented in Table 4.2-4, Required Private Vehicles Los C<br />
Arrivals Curb Length (Feet), assumes only private vehicles will use the curbside<br />
and the requirements for all other commercial vehicle activity is shown in<br />
Table 4.2-5, Required Commercial Vehicles Curb Length (Feet), and is<br />
assumed to occur on a commercial curbside.<br />
DRAFT<br />
Landrum & Brown Page 144<br />
April 2013
KANSAS CITY NEW TERMINAL STUDY<br />
ADVANCE TERMINAL PLANNING STUDY<br />
PROGRAM CRITERIA DOCUMENT<br />
DRAFT<br />
Table 4.2-3<br />
REQUIRED DEPARTURES LOS C CURB LENGTH (FEET)<br />
Private vehicle<br />
Taxicab<br />
Limousine<br />
Classification Existing 2015 2020 2025 2030<br />
500 545 580 630 690<br />
Source:<br />
HNTB analysis based on forecast peak hour traffic volumes and March 2012 survey data.<br />
Table 4.2-4<br />
REQUIRED PRIVATE VEHICLES LOS C ARRIVALS CURB LENGTH (FEET)<br />
Classification Existing 2015 2020 2025 2030<br />
Private vehicle 660 695 770 820 890<br />
Source:<br />
HNTB analysis based on forecast peak hour traffic volumes and March 2012 survey data.<br />
Table 4.2-5<br />
REQUIRED COMMERCIAL VEHICLES CURB LENGTH (FEET)<br />
Classification Existing 2015 2020 2025 2030<br />
Taxicab 100 100 125 125 125<br />
Limousine 120 120 120 120 150<br />
DRAFT<br />
For-hire shuttle 70 70 70 105 105<br />
Rental car shuttle 110 110 110 110 110<br />
Hotel shuttle 70 105 105 105 105<br />
Blue bus (economy parking) 55 55 110 110 110<br />
Park-Air Express 35 70 70 70 70<br />
Off-Airport parking shuttle 80 120 120 120 120<br />
Charter bus 60 60 60 60 60<br />
Metro (public bus) 60 60 60 60 60<br />
Other 25 25 25 25 25<br />
Total 785 895 975 1,010 1,040<br />
Source:<br />
HNTB analysis based on forecast peak hour traffic volumes and March 2012 survey data.<br />
Landrum & Brown Page 145<br />
April 2013
KANSAS CITY NEW TERMINAL STUDY<br />
ADVANCE TERMINAL PLANNING STUDY<br />
PROGRAM CRITERIA DOCUMENT<br />
DRAFT<br />
Departures and arrivals curb requirements are adjusted to reflect double parking up<br />
to 40 percent of the curb during the peak period, representing LOS C operations.<br />
The commercial curb requirements do not assume double parking due to<br />
operational and safety considerations for commercial vehicle shuttles.<br />
Commercial curbside requirements assume combined drop-off and pick-up activity<br />
for courtesy shuttles (e.g. hotel, parking, and rental car shuttles). If separate<br />
pick-up / drop-off areas are designated the requirements should be adjusted<br />
accordingly using the observed dwell times collected in the March survey. Curbside<br />
allocation plans and associated requirements for both scenarios are depicted in the<br />
recommended transit plaza plans.<br />
Scheduled services, such as the public buses, were assumed to maintain their<br />
current level of service in the future and not increase frequency, however, space for<br />
a dedicated stop was assumed for the public bus. A dedicated four-space taxicab<br />
queue, increasing to five in 2020, was assumed for pick-up activity on the<br />
commercial curb.<br />
4.3 Vehicular Parking<br />
4.3.1 PUBLIC PARKING<br />
Public parking requirements were determined by analyzing the capacity,<br />
transactions, and occupancies of all the Airport-operated public parking facilities.<br />
Overnight facility occupancies, and entry and exit volumes (transactions) were<br />
provided by KCAD staff for March 2012 to coincide with the month originating<br />
passenger surveys were conducted. Transactions were estimated by duration<br />
category (e.g. 30 minutes, 30 minutes – 1 hour, etc.) and the number of spaces<br />
required for each duration category was calculated by applying a turn factor<br />
(an estimate of the number of times a parking space is “turned over” or utilized<br />
each day in the respective duration category). The number of turns per day was<br />
estimated based on industry observations and calibrated to overnight counts and an<br />
estimate of peak hour occupancy. March transactions were then adjusted based on<br />
the actual increase in 2011 monthly transactions during the peak parking month<br />
(July for the terminal garages and October for the Circle and Economy Lots)<br />
compared to March, and a peak month, average day parking demand was<br />
calculated.<br />
DRAFT<br />
Table 4.3-1, Public Parking Requirements, presents terminal area and remote<br />
economy parking with the terminal area divided into two categories (close-in and<br />
long-term), based on the division of usage in the current close-in garages and circle<br />
lot. The circle lot patrons represent both overflow from the <strong>Terminal</strong> B garage,<br />
which is constrained at peak times and parkers who are generally more price<br />
sensitive and may be less inclined to pay an increased rate at the terminal garages.<br />
As selected concepts are refined, this requirement will be reviewed to determine<br />
how the number of spaces available within the terminal area garages and surface<br />
lot affect the breakdown of close-in and long-term parking and the potential pricing<br />
structure.<br />
Landrum & Brown Page 146<br />
April 2013
KANSAS CITY NEW TERMINAL STUDY<br />
ADVANCE TERMINAL PLANNING STUDY<br />
PROGRAM CRITERIA DOCUMENT<br />
DRAFT<br />
Requirements include a search factor, as is typical in the industry, to account for<br />
the required surplus that will allow vehicles entering the facility to find an open<br />
parking space within a reasonable amount of time. A search factor of ten percent<br />
was applied to garage spaces and five percent to long-term terminal area and<br />
economy parking. Future year requirements were developed based on the growth<br />
in daily originating passengers as presented in the aviation forecasts.<br />
Table 4.3-1<br />
PUBLIC PARKING REQUIREMENTS<br />
Facility Existing 2015 2020 2025 2030<br />
Annual Originating<br />
Passengers<br />
4,646,770 5,040,400 5,501,400 6,017,300 6,590,700<br />
Close-in (Garage) 4,720 5,090 5,520 6,085 6,615<br />
Long-term (Surface) 1,655 1,720 1,935 2,150 2,335<br />
Total <strong>Terminal</strong> Area 6,375 6,810 7,455 8,235 8,950<br />
Remote Economy 11,300 12,300 13,400 14,700 16,000<br />
Total 17,675 19,110 20,855 22,935 24,950<br />
Source:<br />
HNTB analysis based on existing parking data provided by KCAD and forecast growth in passengers.<br />
Parking Design Considerations<br />
Current terminal parking facilities are configured with 63-foot bays and 8.5-foot<br />
wide stalls. Future parking facilities should maintain a minimum of 63-foot parking<br />
bays and 8.5-foot stalls with a preference toward 9-foot wide parking stalls.<br />
4.3.2 EMPLOYEE PARKING<br />
DRAFT<br />
Employee parking is provided primarily in a 1,500-space remote parking area on<br />
Mexico Avenue. Employee parking requirements were determined based on peak<br />
85-percent occupancy reported in the MP and adjusted to existing conditions based<br />
on actual passenger growth. The future requirements shown in Table 4.3-2,<br />
Employee Parking Requirements, were based on the forecast growth in overall<br />
airport passengers.<br />
Table 4.3-2<br />
EMPLOYEE PARKING REQUIREMENTS<br />
Facility Existing 2015 2020 2025 2030<br />
Employee 11,800 12,800 14,000 15,300 16,800<br />
Source:<br />
HNTB analysis based on existing parking data provided by KCAD and forecast growth in passengers.<br />
Landrum & Brown Page 147<br />
April 2013
KANSAS CITY NEW TERMINAL STUDY<br />
ADVANCE TERMINAL PLANNING STUDY<br />
PROGRAM CRITERIA DOCUMENT<br />
DRAFT<br />
4.3.3 COMMERCIAL VEHICLE STAGING AREA<br />
Currently, staging for taxicabs, limousines, and for-hire shuttles is provided in two<br />
lots within International Circle while they wait to pick-up arriving passengers.<br />
The first is a 3.5-acre multi-purpose lot south of the ATCT which is used for for-hire<br />
shuttles, charter bus, and some limousine staging. The second is a 0.5-acre taxi<br />
hold lot located east of the ATCT. Estimated requirements for for-hire shuttles,<br />
limousines, and taxicabs staging were developed based on an estimate of peak<br />
hour volumes for each vehicle type gathered during the traffic surveys and curbside<br />
observations. For the purpose of sizing a staging area, it was assumed that<br />
sufficient space be provided to accommodate a two-hour supply of for-hire shuttles<br />
and limousines, and a three-hour supply of taxicabs. This would provide sufficient<br />
space for vehicles arriving to pick up passengers during the peak periods to remain<br />
in the staging areas for up to two and three hours, which is common for taxi<br />
drivers. The rolling peak periods were determined by analyzing the adjusted<br />
terminal area arrivals traffic volumes with the applied vehicle classification<br />
breakdown. The peak periods were determined to be Fridays from 5:00 PM to<br />
8:00 PM for for-hire shuttles and 7:00 PM to 10:00 PM for taxicabs and limousines.<br />
A 10-percent surplus was applied to account for vehicle surges during the time<br />
period and delayed flights that would result in vehicles remaining in the hold lot<br />
longer than anticipated.<br />
Table 4.3-3, Commercial Vehicle Staging Requirement, lists the requirements<br />
for each vehicle. In addition, equivalent area requirements were calculated<br />
assuming 380 square feet per space for shuttles, 330 square feet per space for<br />
limousines, and 200 square feet per space for taxicabs (assuming a nose-to-tail<br />
parking configuration, with taxicabs being dispatched to the terminal in the order<br />
they arrive). The area requirements are also summarized in Table 4.3-3.<br />
Table 4.3-3<br />
COMMERCIAL VEHICLE STAGING REQUIREMENT<br />
Staging Space Requirement<br />
Vehicle Existing 2015 2020 2025 2030<br />
For-hire shuttles 22 24 26 29 31<br />
Limousines 61 66 72 78 86<br />
Taxicabs 50 54 58 64 70<br />
Total 133 144 156 171 187<br />
Staging Area Requirement (acres)<br />
DRAFT<br />
For-hire shuttles 0.19 0.20 0.22 0.25 0.26<br />
Limousines 0.46 0.50 0.55 0.59 0.65<br />
Taxicabs 0.23 0.25 0.27 0.29 0.32<br />
Total 0.88 0.95 1.03 1.13 1.24<br />
Source:<br />
HNTB analysis based on 2012 Traffic Survey data.<br />
Landrum & Brown Page 148<br />
April 2013
KANSAS CITY NEW TERMINAL STUDY<br />
ADVANCE TERMINAL PLANNING STUDY<br />
PROGRAM CRITERIA DOCUMENT<br />
DRAFT<br />
5. TERMINAL SUPPORT REQUIREMENTS<br />
The 2008 MP presented requirements for airport and airline support facilities based<br />
on the forecast developed at that time. Since this past MP was completed aircraft<br />
operations and passenger volumes have declined and an updated operations and<br />
passenger forecasts have been developed as part of the New <strong>Terminal</strong> <strong>Advance</strong><br />
<strong>Planning</strong> <strong>Study</strong>. With this decrease in demand the terminal support facilities were<br />
re-evaluated in this <strong>Study</strong> to determine if the future requirements prepared in 2008<br />
would change based on the updated forecast.<br />
It was determined that the airport administration building, Aircraft Rescue and<br />
Firefighting (ARFF) facility, field maintenance facilities, aircraft maintenance<br />
facilities, the service station, the Federal Aviation Administration (FAA) Air Traffic<br />
Control Tower (ATCT), and the FAA <strong>Terminal</strong> Radar Approach Control Facility<br />
(TRACON) do not require expansion (beyond any expansion plans that are already<br />
in place). Because the updated forecast has lower demand than the MP forecast,<br />
the MP conclusions for these facilities will not change and therefore, revised facility<br />
requirements were not developed.<br />
The 2008 MP identified a need to expand the following facilities based on forecast<br />
demand: fleet maintenance facilities; fuel/wash facility; aviation facilities<br />
maintenance; airport police department; flight kitchens; and airport hotel.<br />
The requirements for these facilities were re-calculated based on the updated<br />
forecast in order to determine the appropriate size of these facilities. In addition,<br />
while the MP did not evaluate ground service equipment (GSE) maintenance and<br />
storage area requirements, these areas were also evaluated as part of this analysis.<br />
The KCI support facilities are shown on Figure 5-1, Support Facilities.<br />
DRAFT<br />
Landrum & Brown Page 149<br />
April 2013
KANSAS CITY NEW TERMINAL STUDY<br />
ADVANCE TERMINAL PLANNING STUDY<br />
PROGRAM CRITERIA DOCUMENT<br />
DRAFT<br />
Figure 5-1<br />
SUPPORT FACILITIES<br />
Source:<br />
Airport Layout Plan; Landrum & Brown<br />
DRAFT<br />
5.1 FLEET MAINTENANCE<br />
The fleet maintenance facility is located at the west end of Paris Street along<br />
Taxiway B. According to the MP, the fleet maintenance building encompasses<br />
34,345 square feet and is located on a 202,337-square foot parcel. The MP<br />
identified a need for an additional 85,363 square feet of land area for fleet<br />
maintenance by 2025. This requirement was based on a 2007 ratio of building area<br />
per commercial operation of 0.23 and a 2007 land to building ratio of 5.9.<br />
These ratios were applied to the updated forecast to determine the revised<br />
requirement. Based on the MP ratios and the updated forecast, an additional<br />
17,063 square feet of land area will be needed by 2030 (see Table 5.1-1, Fleet<br />
Maintenance Requirements).<br />
Landrum & Brown Page 150<br />
April 2013
KANSAS CITY NEW TERMINAL STUDY<br />
ADVANCE TERMINAL PLANNING STUDY<br />
PROGRAM CRITERIA DOCUMENT<br />
DRAFT<br />
Table 5.1-1<br />
FLEET MAINTENANCE REQUIREMENTS (IN SQUARE FEET)<br />
YEAR<br />
2007<br />
COMMERCIAL BLDG 2007 LAND<br />
LAND/<br />
REQUIREMENT<br />
SURPLUS/<br />
BLDG<br />
(DEFICIT)<br />
OPERATIONS 1 SF/OP. AREA<br />
BLDG<br />
SIZE<br />
RATIO BLDG LAND BLDG LAND<br />
Actual<br />
2007 34,435 149,770 0.23 202,337 5.9 34,435 202,337 - -<br />
Forecast<br />
2015 34,435 133,247 0.23 202,337 5.9 30,636 180,000 3,799 22,337<br />
2020 34,435 142,028 0.23 202,337 5.9 32,655 191,900 1,780 10,437<br />
2025 34,435 151,644 0.23 202,337 5.9 34,866 204,900 (431) (2,563)<br />
2030 34,435 162,367 0.23 202,337 5.9 37,331 219,400 (2,896) (17,063)<br />
Note: 1 Commercial operations do not include non-commercial air taxi, general aviation or<br />
military operations. SF=square feet<br />
Sources: 2008 Kansas City International Airport Master Plan; New <strong>Terminal</strong> <strong>Advance</strong> <strong>Planning</strong> forecast; Landrum<br />
& Brown<br />
5.2 FUEL/WASH FACILITY<br />
The KCI fuel/wash area is located at 194 Bogota Street and is approximately<br />
43,655 square feet. It serves as the fuel/wash facility for airport parking buses,<br />
police vehicles, and airport maintenance vehicles. According to the MP,<br />
maintenance personnel have expressed a need for replacement of the wash area<br />
facilities. The MP analysis showed a need for an additional 29,600 square feet of<br />
fuel/wash facilities by 2025 based on a 2006 ratio of 0.008 square feet of land area<br />
per enplaned passenger. This ratio was applied to the revised forecast to<br />
determine an updated fuel/wash facility requirement (see Table 5.2-1,<br />
Fuel/Wash Facility Requirement). Based on the MP ratios and the updated<br />
forecast, there is a need to provide an additional 14,100 square feet of fuel/wash<br />
land area by 2030.<br />
Table 5.2-1<br />
FUEL/WASH FACILITY REQUIREMENTS (IN SQUARE FEET)<br />
YEAR<br />
2006 LAND<br />
DRAFT<br />
ENPLANED<br />
PASSENGER<br />
SF PER<br />
ENPL.<br />
AREA<br />
REQ'D<br />
SURPLUS/<br />
(DEFICIT)<br />
AREA<br />
Actual<br />
2006 43,655 5,471,339 0.008 43,655 -<br />
Forecast<br />
2015 43,655 5,536,000 0.008 44,200 (500)<br />
2020 43,655 6,042,000 0.008 48,200 (4,500)<br />
2025 43,655 6,608,500 0.008 52,700 (9,000)<br />
2030 43,655 7,237,900 0.008 57,800 (14,100)<br />
Note:<br />
Sources:<br />
SF=square feet<br />
2008 Kansas City International Airport Master Plan; New <strong>Terminal</strong> <strong>Advance</strong> <strong>Planning</strong> forecast; Landrum<br />
& Brown<br />
Landrum & Brown Page 151<br />
April 2013
KANSAS CITY NEW TERMINAL STUDY<br />
ADVANCE TERMINAL PLANNING STUDY<br />
PROGRAM CRITERIA DOCUMENT<br />
DRAFT<br />
5.3 AVIATION FACILITIES MAINTENANCE<br />
The aviation maintenance facilities are located at 711 Mexico City Avenue.<br />
The building is 10,000 square feet and is located on a 40,091-square foot parcel.<br />
The MP facility requirements were calculated based on a 2006 ratio of building<br />
square feet per commercial operation of 0.07 and a land to building ratio of 4.0.<br />
The MP determined there was a need for an additional 24,209 square feet of land<br />
area for aviation facilities maintenance by 2025. Based on the MP ratios and the<br />
updated forecast, there is a need for an additional 3,409 square feet of land area by<br />
2030 (see Table 5.3-1, Aviation Facilities Maintenance).<br />
Table 5.3-1<br />
AVIATION FACILITIES MAINTENANCE REQUIREMENTS (IN SQUARE FEET)<br />
YEAR<br />
2006<br />
BLDG COMMERCIAL 2006 LAND<br />
LAND/<br />
REQUIREMENT<br />
SURPLUS/<br />
BLDG<br />
SF/OP.<br />
(DEFICIT)<br />
OPERATIONS 1 AREA<br />
BUILDING<br />
AREA<br />
RATIO BLDG LAND BLDG LAND<br />
Actual<br />
2006 10,000 0.07 149,770 40,091 4.0 10,000 40,091 - -<br />
Forecast<br />
2015 10,000 0.07 133,247 40,091 4.0 8,897 35,700 1,103 4,391<br />
2020 10,000 0.07 142,028 40,091 4.0 9,483 38,000 517 2,091<br />
2025 10,000 0.07 151,644 40,091 4.0 10,125 40,600 (125) (509)<br />
2030 10,000 0.07 162,367 40,091 4.0 10,841 43,500 (841) (3,409)<br />
Note:<br />
Sources:<br />
SF=square feet<br />
1 Commercial operations do not include non-commercial air taxi, general aviation or<br />
military operations.<br />
2008 Kansas City International Airport Master Plan; New <strong>Terminal</strong> <strong>Advance</strong> <strong>Planning</strong> forecast; Landrum<br />
& Brown analysis.<br />
DRAFT<br />
5.4 AIRPORT POLICE DEPARTMENT<br />
The KCI police department is located in the center of the terminal area. It is a<br />
44,381-square foot building on a 115,000-square foot parcel that supports the<br />
police and security functions at the Airport and the communications center and<br />
Sprint telecommunications. The MP identified a need for 78,100 square feet of<br />
additional land area by 2025, based on a 2006 ratio of building square feet per<br />
enplaned passenger of 0.008 and a 2006 land area per enplaned passenger ratio of<br />
0.021. These ratios were applied to the updated forecast to determine revised<br />
police department requirements (see Table 5.4-1, Police Department<br />
Requirements). The updated forecast yields a requirement for 37,100 additional<br />
square feet of land area by 2030 for the police department.<br />
Landrum & Brown Page 152<br />
April 2013
KANSAS CITY NEW TERMINAL STUDY<br />
ADVANCE TERMINAL PLANNING STUDY<br />
PROGRAM CRITERIA DOCUMENT<br />
DRAFT<br />
Table 5.4-1<br />
POLICE DEPARTMENT REQUIREMENTS (IN SQUARE FEET)<br />
YEAR<br />
2006<br />
BLDG. SF<br />
LAND<br />
SURPLUS/<br />
ENPLANED<br />
LAND<br />
REQUIREMENT<br />
BLDG<br />
PER<br />
AREA/<br />
(DEFICIT)<br />
PASSENGERS<br />
AREA<br />
AREA<br />
ENPL.<br />
ENPL. BLDG LAND BLDG LAND<br />
Actual<br />
2006 44,381 5,471,339 0.008 115,000 0.021 44,381 115,000 - -<br />
Forecast<br />
2015 44,381 5,536,000 0.008 115,000 0.021 44,900 116,400 (519) (1,400)<br />
2020 44,381 6,042,000 0.008 115,000 0.021 49,000 127,000 (4,619) (12,000)<br />
2025 44,381 6,608,500 0.008 115,000 0.021 53,600 138,900 (9,219) (23,900)<br />
2030 44,381 7,237,900 0.008 115,000 0.021 58,700 152,100 (14,319) (37,100)<br />
Note:<br />
Sources:<br />
SF=square feet<br />
2008 Kansas City International Airport Master Plan; New <strong>Terminal</strong> <strong>Advance</strong> <strong>Planning</strong> forecast; Landrum<br />
& Brown<br />
5.5 FLIGHT KITCHENS<br />
There are two flight kitchen facilities at KCI: LSG Sky Chefs and Midwest Airlines<br />
Commissary. LSG Sky Chefs has a 42,000-square foot facility located at<br />
566 Brasilia Avenue. Midwest Airlines Commissary is a 20,808-square foot building<br />
located at 241 Paris Street. Combined, the two facilities are located on<br />
181,713 square feet of land area.<br />
According to the MP, the Sky Chefs facility size is sufficient but the Midwest Airlines<br />
Commissary facility will need an additional 12,487 square feet of land area by<br />
2025. The MP requirement was calculated based on a 2006 meals-per-passenger<br />
ratio of 0.06, 2006 meals-per-total square feet ratio of 0.03, and a 2006 ratio of<br />
land area per commercial operation of 0.8. The 2006 ratios were calculated based<br />
on actual building usage information provided by Sky Chefs and Midwest Airlines<br />
commissary personnel. Based on these ratios and the updated forecast, no<br />
expansion of the flight kitchen facilities is required during the planning period<br />
(see Table 5.5-1, Flight Kitchen Requirements).<br />
DRAFT<br />
Table 5.5-1<br />
FLIGHT KITCHEN REQUIREMENTS (IN SQUARE FEET)<br />
YEAR<br />
2006 2006<br />
DAILY<br />
SURPLUS/<br />
PMAD<br />
COMMERCIAL REQUIREMENT<br />
BLDG LAND<br />
MEALS<br />
(DEFICIT)<br />
PASS.<br />
OPERATIONS 1<br />
AREA AREA<br />
REQ'D<br />
BLDG LAND BLDG LAND<br />
Actual<br />
2006 57,140 181,713 15,857 1,026 149,770 36,140 121,077 21,000 60,636<br />
Forecast<br />
2015 57,140 181,713 18,600 1,203 133,247 42,391 107,719 14,749 73,994<br />
2020 57,140 181,713 20,300 1,313 142,028 46,266 114,818 10,874 66,895<br />
2025 57,140 181,713 22,200 1,436 151,644 50,596 122,592 6,544 59,121<br />
2025 57,140 181,713 24,100 1,559 162,367 54,926 131,261 2,214 50,452<br />
Notes: 1 SF=square feet<br />
Commercial operations do not include non-commercial air taxi, general aviation or<br />
military operations.<br />
Sources: 2008 Kansas City International Airport Master Plan; New <strong>Terminal</strong> <strong>Advance</strong> <strong>Planning</strong> forecast; Landrum<br />
& Brown<br />
Landrum & Brown Page 153<br />
April 2013
KANSAS CITY NEW TERMINAL STUDY<br />
ADVANCE TERMINAL PLANNING STUDY<br />
PROGRAM CRITERIA DOCUMENT<br />
DRAFT<br />
5.6 AIRPORT HOTEL<br />
Currently there is a single hotel located on Airport property which is the Marriott<br />
Hotel at 775 Brasilia Avenue. This existing hotel has 382 rooms and a<br />
conference/banquet center. According to the MP, the occupancy rate in 2006 was<br />
82 percent, resulting in a 2006 ratio of 17,467 enplanements per room. Based on<br />
this ratio by 2025 there is only a need for 378 rooms and the existing Marriot has<br />
382 rooms which is a surplus of 4 rooms. In 2030 however the revised forecast<br />
based on this historic ratio of passenger enplanements to rooms shows the need for<br />
32 additional rooms over the current capacity of the Marriott Hotel.<br />
(See Table 5.6-1, Airport Hotel Requirements)<br />
Table 5.6-1<br />
AIRPORT HOTEL REQUIREMENTS<br />
YEAR<br />
2006 ANNUAL ENPL/ ROOMS SURPLUS/<br />
ROOMS ENPL. ROOM REQUIRED (DEFICIT)<br />
Actual<br />
2006 382 5,471,339 17,467 313 69<br />
Forecast<br />
2015 382 5,536,000 17,467 317 65<br />
2020 382 6,042,000 17,467 346 36<br />
2025 382 6,608,500 17,467 378 4<br />
2030 382 7,237,900 17,467 414 (32)<br />
Sources:<br />
2008 Kansas City International Airport Master Plan; New <strong>Terminal</strong> <strong>Advance</strong> <strong>Planning</strong> forecast; Landrum<br />
& Brown<br />
DRAFT<br />
5.7 GROUND SERVICE EQUIPMENT (GSE) FACILITIES<br />
The GSE are stationed at and around the terminal gates for the servicing of<br />
passenger aircraft and are stored in the vicinity of the aircraft gates at the<br />
terminals when in regular use. GSE fuel facilities are located between the terminals<br />
on the aircraft ramp so that equipment can be fueled near the gates via hydrant<br />
system, similar to the aircraft hydrant fueling system. There are three fueling<br />
facilities for GSE equipment on the terminal ramp: one between <strong>Terminal</strong>s A and B,<br />
one between <strong>Terminal</strong>s B and C, and one to the north of <strong>Terminal</strong> C. There is<br />
sufficient area around the gates to accommodate the GSE that is in regular use.<br />
According to Airport officials, GSE is stored in the buildings along Cargo Row<br />
(both on the ramp and in the buildings) when not in use. The airlines perform light<br />
maintenance on their GSE in their leased terminal areas. Heavy mechanical<br />
maintenance is performed along Cargo Row. The MP did not evaluate sizing<br />
requirements for GSE maintenance and storage areas. Airport officials have<br />
advised that GSE maintenance/storage is not a critical issue and that additional<br />
space will not be needed. As a result, no additional land should be set aside for<br />
additional GSE maintenance and storage facilities.<br />
Landrum & Brown Page 154<br />
April 2013
KANSAS CITY NEW TERMINAL STUDY<br />
ADVANCE TERMINAL PLANNING STUDY<br />
PROGRAM CRITERIA DOCUMENT<br />
DRAFT<br />
5.8 AIRSIDE SNOW STORAGE AND MELTING AREAS<br />
KCI’s Snow and Ice Control Plan 2 was reviewed and Airport personnel were<br />
interviewed to determine current snow clearing procedures for the airfield.<br />
KCI’s Priority 1 3 areas include primary runways with their respective entry and exit<br />
taxiway connectors, two high-speed taxiways on primary arrival runways, an<br />
associated parallel taxiway, and access taxiways to the terminal ramps.<br />
The remaining taxiways and terminal aprons are cleared as conditions allow.<br />
There are no formal designated “snow dump” areas for the terminals.<br />
Snow removal procedures for the terminal apron include plowing out from the<br />
terminal to the taxiways while working around parked aircraft, and setting up rows<br />
of plowed snow (referred to as “windrows”) at the apron’s edge to blow snow into<br />
the grass infields. The snow is ultimately stored in the field surrounding the ARFF<br />
building (see Figure 5.8-1, <strong>Terminal</strong> Area). The snow that builds in the alleys<br />
between <strong>Terminal</strong>s A and B and between <strong>Terminal</strong>s B and C is usually plowed<br />
straight out toward the infield and blown into the grass infields at Taxiway M1 and<br />
Taxiways C6/C7/C8. KCI has looked into the possibility of closing Taxiway C7<br />
during the winter to expedite the removal of snow from the <strong>Terminal</strong> B and C alley.<br />
According to Airport personnel, the addition of the Remain Overnight (RON) parking<br />
pad, located off the <strong>Terminal</strong> B apron, has resulted in crews plowing almost double<br />
the volume of snow on several occasions. This results in large piles of snow<br />
accumulating until enough equipment is committed to plow and blow the<br />
accumulated snow into the field surrounding the ARFF facility. There have been<br />
instances years ago when snow accumulations were so great that the operation<br />
could not be set up properly and snow was plowed into the alleys to be removed by<br />
loader and dump truck at the first opportunity. Elimination of the grass infields as<br />
part of the terminal program will cause KCI to have to move snow even further<br />
across live pavement (as in the case of the RON apron) and possibly cause the<br />
apron to become impassable during a snow event.<br />
DRAFT<br />
With the expansion of the terminal, the need for snow storage and melting areas<br />
must be taken into consideration. Four potential areas for snow storage and<br />
melting were identified: (1) the first is to the Northeast of existing Taxiway G;<br />
(2) the second is located Northeast of the existing ARFF; (3) the third is East of<br />
<strong>Terminal</strong> C; and (4) the fourth is between the proposed deicing pads East of<br />
Taxiway B. (See Figure 5.8-2, Potential Future Areas for Snow<br />
Storage/Melting In <strong>Terminal</strong> Area)<br />
2<br />
3<br />
Snow and Ice Control Plan , Kansas City International Airport, May 12, 2012<br />
According to FAA Advisory Circular 150/5200-30C, Airport Winter Safety and Operations, airport<br />
operators can limit interruption of service as much as possible during snow events by classifying<br />
the most critical portions of the aircraft movement area and supporting facilities as Priority 1 and<br />
then taking care of other areas in their order of importance. KCI must clear one inch of snow from<br />
its Priority 1 areas within a one-half hour.<br />
Landrum & Brown Page 155<br />
April 2013
KANSAS CITY NEW TERMINAL STUDY<br />
ADVANCE TERMINAL PLANNING STUDY<br />
PROGRAM CRITERIA DOCUMENT<br />
DRAFT<br />
Figure 5.8-1<br />
TERMINAL AREA<br />
Sources:<br />
Airport Layout Plan; airport personnel; Snow and Ice Control Plan, Kansas City International Airport,<br />
dated May 12, 2012; and Landrum & Brown<br />
DRAFT<br />
Landrum & Brown Page 156<br />
April 2013
KANSAS CITY NEW TERMINAL STUDY<br />
ADVANCE TERMINAL PLANNING STUDY<br />
PROGRAM CRITERIA DOCUMENT<br />
DRAFT<br />
Figure 5.8-2<br />
POTENTIAL FUTURE AREAS FOR SNOW STORAGE/MELTING IN TERMINAL<br />
AREA<br />
Sources:<br />
DRAFT<br />
Airport Layout Plan and Landrum & Brown<br />
5.9 RAMP CONTROL TOWER<br />
Currently, there is not a ramp control tower at the KCI terminal. Aircraft that push<br />
back from the gates onto movement areas are under the control of the ATCT.<br />
The ATCT acts in an advisory capacity only for aircraft that do not push back onto<br />
movement areas.<br />
If a ramp control tower is needed with the proposed terminal expansion, it would<br />
likely be located on top of the terminal building. The maximum elevations of the<br />
terminal building/ramp tower were determined based on an ATCT line-of-sight<br />
analysis and FAA Federal Aviation Regulation (FAR) Part 77, Objects Affecting<br />
Navigable Airspace. These maximum elevations are shown on Figure 5.9-1,<br />
Maximum <strong>Terminal</strong> Building Elevations.<br />
Landrum & Brown Page 157<br />
April 2013
KANSAS CITY NEW TERMINAL STUDY<br />
ADVANCE TERMINAL PLANNING STUDY<br />
PROGRAM CRITERIA DOCUMENT<br />
DRAFT<br />
Figure 5.9-1<br />
MAXIMUM TERMINAL BUILDING ELEVATIONS<br />
Notes: NAVD-88 = North American Vertical Datum of 1988<br />
AGL = Above Ground Level<br />
Sources: FAA Federal Aviation Regulation (FAR) Part 77, Objects Affecting Navigable Airspace; Landrum & Brown<br />
analysis<br />
The size of a ramp tower at KCI would be based on who controls the tower<br />
(the airport, a single airline, or multiple airlines), the number of work stations, and<br />
how many gates would be under the control of the ramp tower. To give an idea of<br />
possible facility size at KCI, ramp control towers at several airports were surveyed:<br />
<br />
<br />
DRAFT<br />
McCarran International Airport (LAS): The D-Gates ramp control tower<br />
at LAS was built in 2005. The facility handles 45 gates and its observation<br />
area is 50 feet in diameter. 4<br />
Philadelphia International Airport (PHL): PHL, which has 130 gates,<br />
has coordinated ramp control towers at the eastern and western ends of the<br />
terminal area. The newest tower, which was constructed in 2002 as part of<br />
the new International <strong>Terminal</strong>, has a 60-foot diameter cab and was<br />
designed to accommodate 25 staffed ramp and operations agent positions.<br />
This tower is run by US Airways which represents just less than half of the<br />
operations at PHL. The second tower cab has a 45-foot diameter. It is run<br />
by the airport and is near <strong>Terminal</strong> F. 5<br />
4<br />
5<br />
http://www.emporis.com/building/mccarraninternationalairportdgatesrampcontroltower-lasvegasnv-usa<br />
Google Earth; www.phl.org gate layout and February 1, 2002 press release; www.pgal.com<br />
Landrum & Brown Page 158<br />
April 2013
KANSAS CITY NEW TERMINAL STUDY<br />
ADVANCE TERMINAL PLANNING STUDY<br />
PROGRAM CRITERIA DOCUMENT<br />
DRAFT<br />
Orlando International Airport (MCO): Wings 10, 11, and 12<br />
(Gates 60-99) at MCO’s <strong>Terminal</strong> B consist of 32 gates. Its ramp control<br />
tower has a cab radius of 45 feet. 6<br />
Hartsfield-Jackson Atlanta International Airport (ATL): Concourse C<br />
at ATL has 48 gates. It has a ramp control tower with a cab that is 60 feet<br />
by 30 feet. 7<br />
<br />
<br />
Dallas/Fort Worth International Airport (DFW): DFW’s <strong>Terminal</strong> E has<br />
28 gates. Its ramp control tower has a 30-foot by 30-foot cab. 8<br />
Chicago O’Hare International Airport (ORD): ORD has a ramp control<br />
tower that serves Concourses B and C. Its cab is 40 feet by 30 feet.<br />
The average ratio of cab area per gate for all of these airports is 38 square feet per<br />
gate (see Table 5.9-1, Ramp Control Tower Ratios).<br />
Table 5.9-1<br />
RAMP CONTROL TOWER RATIOS<br />
AIRPORT<br />
TERMINAL<br />
CAB<br />
DIMENSIONS<br />
CAB<br />
AREA<br />
(SF)<br />
NO. OF<br />
GATES<br />
CAB<br />
AREA/<br />
GATE<br />
LAS D-Gates 50' diameter 1,963 45 44<br />
PHL 1 Eastern End of <strong>Terminal</strong> Area 60' diameter 2,826 65 43<br />
Western End of <strong>Terminal</strong> Area 45' diameter 1,590 65 24<br />
MCO <strong>Terminal</strong> B, Wings 10-12 45' diameter 1,590 32 50<br />
ATL Concourse C 60x30' 1,800 48 38<br />
DFW <strong>Terminal</strong> E 30x30' 900 28 32<br />
ORD Concourses B and C 40'x30' 1,200 32 38<br />
Average: 1,778 45 38<br />
DRAFT<br />
Note: 1 Number of gates for PHL assumes ramp tower controls half the airport's gates.<br />
Sources: Google Earth; airport websites; www.pgal.com;<br />
http://www.emporis.com/building/mccarraninternational airportdgatesrampcontroltower-lasvegas-nvusa<br />
The proposed terminal for KCI has 41 gates. The application of the 38 square feet<br />
per gate ratio to the KCI terminal results is the need for a cab area of 1,600 square<br />
feet (see Table 5.9-2, Ramp Tower Requirements). A circular ramp control<br />
tower cab at KCI would need to have a diameter of 45 feet. A square shaped tower<br />
would need to be 40 feet by 40 feet in size.<br />
6<br />
7<br />
8<br />
Google Earth and www.orlandoairports.net<br />
Google Earth and www.atlanta-airport.com<br />
Google Earth and www.dfwairport.com<br />
Landrum & Brown Page 159<br />
April 2013
KANSAS CITY NEW TERMINAL STUDY<br />
ADVANCE TERMINAL PLANNING STUDY<br />
PROGRAM CRITERIA DOCUMENT<br />
DRAFT<br />
Table 5.9-2<br />
RAMP TOWER REQUIREMENTS<br />
Average Cab Area/Gate (square feet) 38<br />
No. of Gates 41<br />
Required Cab Area (in square feet) 1,600<br />
Circular Cab Diameter 45'<br />
Square Cab Dimensions<br />
40'x40'<br />
Source:<br />
Landrum & Brown analysis<br />
5.10 REMAIN OVERNIGHT (RON) PARKING<br />
The 2008 MP identified five current hardstand positions for RON aircraft during the<br />
base year (2007) and a need for one additional hardstand position by 2025.<br />
This requirement was based on the peak month average day (PMAD) departures<br />
per gate method that accounts for current and anticipated airline utilizations and<br />
fleet mix parameters.<br />
An alternate methodology was applied to the updated forecast to determine the<br />
revised RON parking requirements through 2030 using the updated forecast.<br />
Existing 2012 and future 2030 RON parking requirements were derived from the<br />
2012 and 2030 design day flight schedules developed as part of the terminal<br />
analysis. The 2025 requirement was interpolated.<br />
There are 53 aircraft that RON at KCI in the 2012 schedule and 69 in the<br />
2030 schedule. Subtracting the number of gates from the number of RON aircraft<br />
yields the hardstand requirement for each year (see Table 5.10-1,<br />
Recommended Additional RON Parking Positions). Based on this<br />
methodology, an expansion to the existing terminal apron will be needed to<br />
accommodate 27 hardstand positions by 2025 and 28 hardstand positions by 2030.<br />
The RON parking positions need to be sized to accommodate ADG-III aircraft in<br />
both 2025 and 2030.<br />
DRAFT<br />
Table 5.10-1<br />
RECOMMENDED ADDITIONAL RON PARKING POSITIONS<br />
2012<br />
EXISTING<br />
2025<br />
REQUIREMENT<br />
2030<br />
REQUIREMENT<br />
Total RON Aircraft 53 64 69<br />
Contact Gates 50 37 41<br />
Hardstand Positions 3 27 28<br />
Sources:<br />
2012 and 2030 design day flight schedules; Landrum & Brown analysis<br />
Landrum & Brown Page 160<br />
April 2013
KANSAS CITY NEW TERMINAL STUDY<br />
ADVANCE TERMINAL PLANNING STUDY<br />
PROGRAM CRITERIA DOCUMENT<br />
DRAFT<br />
6. REFINE CONCEPTUAL TERMINAL COMPLEX SITE PLAN<br />
6.1 Airside Site Plan<br />
As discussed previously, the proposed New <strong>Terminal</strong> at KCI is to be constructed at<br />
the existing <strong>Terminal</strong> A location. Three airfield pavement configurations were<br />
evaluated to support the initial 37-gate terminal construction. Each alternative had<br />
to meet the requirements for the New <strong>Terminal</strong> apron and supporting<br />
infrastructure, summarized below and detailed in prior sections of this document.<br />
<br />
<br />
<br />
<br />
<br />
<br />
<br />
<br />
<br />
<br />
<br />
<br />
Maintain constant apron elevation around the perimeter of the New <strong>Terminal</strong><br />
building<br />
Meet minimum 1 percent pavement grade adjacent to the New <strong>Terminal</strong> to<br />
satisfy NFPA codes<br />
Do not exceed maximum 1 percent pavement grades on airfield pavements<br />
to meet FAA criteria<br />
Meet ADG III design criteria for taxilanes on the apron, yet allow a single<br />
ADG V operation when necessary<br />
Provide dual taxilanes around the perimeter of the New <strong>Terminal</strong> to allow<br />
simultaneous aircraft operations in opposite directions to all terminal gates<br />
Implement triple taxilanes in areas between parallel concourses to allow push<br />
back from a gate while maintaining dual aircraft taxiing operations<br />
Meet ADG V design criteria for taxiway improvements adjacent to the<br />
terminal apron<br />
DRAFT<br />
Construct centralized deicing pads to meet the projected aircraft fleet mix<br />
Provide a centralized deicing operations administration and maintenance<br />
complex<br />
Provide 28 RON aircraft parking positions<br />
Provide a dedicated collection system of centralized deicing pads to separate<br />
glycol-contaminated runoff from stormwater runoff<br />
Meet MDNR requirements of discharges from the Airport<br />
Landrum & Brown Page 161<br />
April 2013
KANSAS CITY NEW TERMINAL STUDY<br />
ADVANCE TERMINAL PLANNING STUDY<br />
PROGRAM CRITERIA DOCUMENT<br />
DRAFT<br />
Figure 6.1-1, Apron Configuration-Alternative 1, depicts the first apron<br />
configuration alternative. Alternative 1 assumes that <strong>Terminal</strong> B will remain in<br />
place after completion of the New <strong>Terminal</strong>. Two dedicated taxilanes will be<br />
developed east of the southern deicing pads to connect Taxiway D to the proposed<br />
terminal complex.<br />
A condensed triple taxilane configuration can be developed in the southern gate<br />
area, but the proximity of the New <strong>Terminal</strong> to <strong>Terminal</strong> B will only provide a single<br />
taxilane from the southern gate areas.<br />
Figure 6.1-1<br />
APRON CONFIGURATION-ALTERNATIVE 1<br />
Source: HNTB<br />
DRAFT<br />
Landrum & Brown Page 162<br />
April 2013
KANSAS CITY NEW TERMINAL STUDY<br />
ADVANCE TERMINAL PLANNING STUDY<br />
PROGRAM CRITERIA DOCUMENT<br />
DRAFT<br />
Figure 6.1-2, Apron Configuration-Alternative 2, depicts the second apron<br />
configuration alternative. Alternative 2, similar to Alternative 1, assumes that<br />
<strong>Terminal</strong> B will remain in place after completion of the New <strong>Terminal</strong>, but only a<br />
single access taxilane east of the southern deicing pads to connect Taxiway D and<br />
the proposed terminal will be provided.<br />
A condensed triple taxilane configuration can be developed in the southern gate<br />
area, but the proximity of the New <strong>Terminal</strong> to <strong>Terminal</strong> B will only provide a single<br />
taxilane from the southern gate areas.<br />
Figure 6.1-2<br />
APRON CONFIGURATION-ALTERNATIVE 2<br />
Source: HNTB<br />
DRAFT<br />
Landrum & Brown Page 163<br />
April 2013
KANSAS CITY NEW TERMINAL STUDY<br />
ADVANCE TERMINAL PLANNING STUDY<br />
PROGRAM CRITERIA DOCUMENT<br />
DRAFT<br />
The third alternative is depicted in Figure 6.1-3, Apron Configuration-<br />
Alternative 3. Alternative 3 assumes that <strong>Terminal</strong> B will be demolished after<br />
completion of the New <strong>Terminal</strong>. It provides triple access taxilanes east of the<br />
southern deicing pads to connect Taxiway D and the New <strong>Terminal</strong>.<br />
Figure 6.1-3<br />
APRON CONFIGURATION-ALTERNATIVE 3<br />
Source:<br />
HNTB<br />
DRAFT<br />
Alternative three was chosen as the Preferred Alternative, which requires the<br />
removal of <strong>Terminal</strong> B to provide the optimum apron transition from the southeast<br />
gates of the New <strong>Terminal</strong>.<br />
The following sections detail recommended airside configuration.<br />
6.1.1 APRON AND TAXILANES<br />
The apron in the Preferred Alternative will interface with the New <strong>Terminal</strong> building<br />
to meet aircraft parking and ground servicing needs. Fueling, maintenance, and<br />
baggage handling are typical services that will be provided at each gate and require<br />
direct access from the terminal building. The apron will be sized to provide proper<br />
wingtip clearance between aircraft parking positions and additional area for ground<br />
service operations at the aircraft parking positions.<br />
Landrum & Brown Page 164<br />
April 2013
KANSAS CITY NEW TERMINAL STUDY<br />
ADVANCE TERMINAL PLANNING STUDY<br />
PROGRAM CRITERIA DOCUMENT<br />
DRAFT<br />
Push-back zones are areas that must remain clear to push aircraft from a parking<br />
position at a terminal gate for taxi exit to the movement area. A dedicated taxilane<br />
will be located behind each terminal gate to allow aircraft to be pushed back.<br />
A parallel taxilane will also be provided to allow aircraft movements to be<br />
maintained without interruption during push-back operations. In the areas between<br />
two parallel concourses, triple taxilanes will be necessary to allow simultaneous<br />
push-back from each concourse and allow aircraft operations within the concourses.<br />
Figure 6.1-4, Apron Configuration-Alternative 3, depicts the dual and triple<br />
taxilane layouts that will provide push-back zones and maintain aircraft ground<br />
movements.<br />
Figure 6.1-4<br />
APRON CONFIGURATION-ALTERNATIVE 3<br />
DRAFT<br />
Source:<br />
HNTB<br />
The centerline of taxilanes closest to the aircraft parking positions will be located<br />
81 feet from the outer edge of the service road to meet ADG III standards for the<br />
distance from taxilane centerline to a fixed or movable object. Associated parallel<br />
taxilanes will be offset 140 feet to meet ADG III separation standards for parallel<br />
taxilanes.<br />
Landrum & Brown Page 165<br />
April 2013
KANSAS CITY NEW TERMINAL STUDY<br />
ADVANCE TERMINAL PLANNING STUDY<br />
PROGRAM CRITERIA DOCUMENT<br />
DRAFT<br />
The edge of outboard taxilanes is located 25 feet from the taxilane centerline to<br />
provide the 50-foot taxilane width for ADG III design standards.<br />
ADG V aircraft movements will utilize the center taxilane in areas with triple<br />
taxilanes. No other aircraft operations will be permitted to/from the gates during a<br />
ADG V aircraft ground movement. In areas with only dual taxilanes, the ADG V<br />
aircraft will taxi parallel, and in the middle of the two parallel ADG III taxilanes.<br />
Paved shoulders will be constructed to be 25 feet wide.<br />
6.1.2 TAXIWAYS<br />
The delineation between movement and non-movement areas will be located at the<br />
east edge of the Taxiway B OFA and at the north edge of the Taxiway D OFA as<br />
shown in Figure 6.1-5, TAXIWAY RECONSTRUCTION LIMITS. Therefore,<br />
aircraft movements on the apron area and associated taxilanes will be controlled by<br />
the terminal apron control tower. Aircraft movements onto Taxiways B and D will<br />
be controlled by the FAA ATCT. A non-movement area marking will be located<br />
along the OFA of the adjacent taxiways at a distance of 160 feet from the centerline<br />
of Taxiways B and D.<br />
The elevation of the east edge of Taxiway B drops 8 feet from the south edge of the<br />
New <strong>Terminal</strong> apron to the north edge. With the objective to maintain a constant<br />
elevation at the interface of the apron and meet FAA-grading criteria, it is<br />
necessary to raise the elevation of Taxiway B to allow for a constant apron<br />
elevation at the New <strong>Terminal</strong> apron/building interface.<br />
DRAFT<br />
The reconstruction of Taxiway B adjacent to the proposed apron will impact<br />
Taxiway A and the connecting taxiways to meet the grade criteria. To meet the<br />
required pavement elevations on Taxiway B and construct transitions to meet<br />
FAA-grading criteria, Taxiways A and B will be reconstructed from the ARFF access<br />
road on the south to Taxiway B4 on the north.<br />
Figure 6.1-5<br />
TAXIWAY RECONSTRUCTION LIMITS<br />
Source:<br />
HNTB<br />
Landrum & Brown Page 166<br />
April 2013
KANSAS CITY NEW TERMINAL STUDY<br />
ADVANCE TERMINAL PLANNING STUDY<br />
PROGRAM CRITERIA DOCUMENT<br />
DRAFT<br />
Connecting Taxiways A9 and G will remain in their existing location to match<br />
proposed taxilane centerlines from the apron. Taxiway M will be reconstructed in a<br />
new location directly east of Taxiway A10. A new connecting taxiway will be<br />
constructed by extending the southern-most taxilane on the apron to Taxiway A.<br />
6.1.3 SERVICE ROADS<br />
The distance of the service road behind the terminal gates is typically located<br />
180 feet from the face of the terminal building. The service road around the<br />
terminal gate will be marked to lead to the make-up areas located on the apron<br />
level of the New <strong>Terminal</strong> building.<br />
As shown in Figure 6.1-6, PROPOSED NEW SERVICE ROADS, the terminal<br />
service road will also extend north in two locations to connect to a proposed new<br />
service road constructed north of the terminal apron. The new northern service<br />
road will extend west to intersect Ottawa Avenue, the existing service road that<br />
parallels Taxiway B on the east side. An additional service road will extend south<br />
from Ottawa Avenue to access the centralized deicing pads. All service roads are<br />
two lanes with each lane being 12.5 feet wide.<br />
Figure 6.1-6<br />
PROPOSED NEW SERVICE ROADS<br />
DRAFT<br />
Source:<br />
L&B<br />
6.1.4 REMOTE OVER NIGHT (RON) PARKING POSITIONS<br />
In addition to the aircraft positions at the terminal gates, there will be 28 remote<br />
overnight (RON) aircraft parking positions designated to temporarily store aircraft<br />
that cannot be accommodated at the terminal gates. Figure 6.1-7, Remote Over<br />
Night Parking Positions, identifies the RON parking positions, denoted by boxes.<br />
Each box is 150 feet x 150 feet to accommodate ADG III aircraft.<br />
Landrum & Brown Page 167<br />
April 2013
KANSAS CITY NEW TERMINAL STUDY<br />
ADVANCE TERMINAL PLANNING STUDY<br />
PROGRAM CRITERIA DOCUMENT<br />
DRAFT<br />
Figure 6.1-7<br />
REMOTE OVER NIGHT PARKING POSITIONS<br />
Source:<br />
L&B<br />
DRAFT<br />
6.1.5 CENTRALIZED DEICING PADS<br />
Centralized deicing pads will be established on the terminal apron in three different<br />
areas. Dividing the twelve required deicing pads into three areas reduces<br />
congestion, provides proximity to all terminal gates, and allows deicing pads to be<br />
isolated for snow removal operations or deactivated if the operational need for all<br />
twelve pads is not necessary.<br />
Figure 6.1-8, West Deicing Pads, depicts nine of the twelve deicing pads located<br />
on the west side of the New <strong>Terminal</strong>. Due to the proximity of the New <strong>Terminal</strong> to<br />
Taxiway B, each of these pads is sized to accommodate ADG III aircraft. A deicing<br />
pad to accommodate ADG V aircraft will not work on the west side of the terminal<br />
area.<br />
Landrum & Brown Page 168<br />
April 2013
KANSAS CITY NEW TERMINAL STUDY<br />
ADVANCE TERMINAL PLANNING STUDY<br />
PROGRAM CRITERIA DOCUMENT<br />
DRAFT<br />
Figure 6.1-8<br />
WEST DEICING PADS<br />
Source:<br />
HNTB<br />
The deicing pads will be located to allow the dual taxilanes on the north and south<br />
side of the New <strong>Terminal</strong> to remain in operation during deicing conditions.<br />
In addition, two taxilanes separate the two groups of deicing pads to provide direct<br />
access from the terminal gates located in the center of the west side of the terminal<br />
complex.<br />
DRAFT<br />
Deicing pads on the north side of the apron will not be constructed due to the<br />
proximity to existing infrastructure that will remain in place after the initial phase of<br />
the New <strong>Terminal</strong> construction is completed. Locating five deicing pads north of the<br />
center taxilanes will provide direct access from the north gates to more deicing<br />
pads.<br />
A pavement area outside the center taxilane OFA or the deicing pad VSZ will be<br />
constructed adjacent to the northern deicing pads as shown in Figure 6.1-9, Snow<br />
Dump Plan. This area can be used to store snow that is pushed from the terminal<br />
gates or stage snow removal equipment.<br />
South of the center taxilanes, four additional deicing pads can serve ADG III<br />
aircraft.<br />
Landrum & Brown Page 169<br />
April 2013
KANSAS CITY NEW TERMINAL STUDY<br />
ADVANCE TERMINAL PLANNING STUDY<br />
PROGRAM CRITERIA DOCUMENT<br />
DRAFT<br />
Figure 6.1-9<br />
SNOW DUMP PLAN<br />
DRAFT<br />
Source:<br />
L&B<br />
Landrum & Brown Page 170<br />
April 2013
KANSAS CITY NEW TERMINAL STUDY<br />
ADVANCE TERMINAL PLANNING STUDY<br />
PROGRAM CRITERIA DOCUMENT<br />
DRAFT<br />
Figure 6.1-10, South Deicing Pads, depicts three deicing pads that will be<br />
constructed south of the New <strong>Terminal</strong>, adjacent to Taxiway D. The western two<br />
pads are sized to serve ADG III aircraft and the eastern pad is sized to<br />
accommodate an ADG Group VBoeing 787-8 aircraft. When not in use as an ADG<br />
Group V pad, the large size of this deicing pad allows the flexibility to deice two<br />
ADG II aircraft simultaneously.<br />
Dual taxilanes designed to bypass the deicing pads are located east of the deicing<br />
pads. A single taxilane is utilized to access the three new southern deicing pads<br />
and is sized to accommodate ADG V aircraft. Additional taxilanes branch from the<br />
ADG V taxilane to access the additional deicing pads or direct ADG II aircraft to<br />
deicing positions within the larger pad.<br />
Figure 6.1-10<br />
SOUTH DEICING PADS<br />
DRAFT<br />
Source:<br />
HNTB<br />
Gate deicing operations will not be permitted once the New <strong>Terminal</strong> is in operation.<br />
If airlines are permitted to perform spot deicing of aircraft near the terminal gate,<br />
glycol recovery vehicles will be used to collect the small amount of glycol fluids<br />
applied before aircraft taxi to centralized deicing pads.<br />
Landrum & Brown Page 171<br />
April 2013
KANSAS CITY NEW TERMINAL STUDY<br />
ADVANCE TERMINAL PLANNING STUDY<br />
PROGRAM CRITERIA DOCUMENT<br />
DRAFT<br />
6.1.6 AIRSIDE SECURITY<br />
Access to the Airside from the landside will be provided by a security gate on the<br />
west end of Paris Street. After entering the secure area through the gate, a vehicle<br />
operator will utilize Ottawa Avenue and the proposed new service roads to access<br />
the New <strong>Terminal</strong> gates and centralized deicing pads.<br />
Apron floodlighting is required for contact gates, RON positions, and deicing pads.<br />
Floodlighting provides visibility for pilots operating aircraft and sufficient<br />
illumination for safe and efficient aircraft servicing.<br />
Floodlighting adjacent to the New <strong>Terminal</strong> should be building mounted.<br />
Where feasible, RON positions should be provided with pole-mounted floodlighting<br />
located along the rear of the parking positions to avoid interference with aircraft<br />
movements. Existing floodlights on <strong>Terminal</strong> C can be used to illuminate RON<br />
positions in this area. In no case can poles or fixtures penetrate Part 77 surfaces.<br />
Floodlighting of centralized deicing pads is more challenging. Additional studies to<br />
understand the impacts of glare on the FAA ATCT and the potential height and<br />
hazards obstructions will be necessary to determine the optimum lighting of the<br />
centralized deicing pads.<br />
Floodlights should be provided with connections to emergency lighting circuits.<br />
Servicing of floodlights is expected to be completed by utilizing equipment currently<br />
owned by the airport.<br />
DRAFT<br />
6.1.7 AIRFIELD CONSTRUCTION SEQUENCING<br />
The construction sequencing for the airfield pavement requires multiple phases to<br />
minimize the impact on aircraft operations on the airfield and at the <strong>Terminal</strong> B<br />
gates. Four phases are anticipated to construct the airfield pavements. They are<br />
shown in Figure 6.1.11, Overall Airfield Phasing Diagram, and summarized<br />
below.<br />
1. Phase 1-Construct airfield pavements outside the OFA of the taxilanes<br />
accessing <strong>Terminal</strong> B.<br />
2. Phase 2-Close <strong>Terminal</strong> B Gates 31-36. Construct airfield to access southern<br />
gates of new terminal.<br />
3. Phase 3-Close <strong>Terminal</strong> B. Construct airfield to provide a single taxilane<br />
south from new terminal to Taxiway D.<br />
4. Phase 4-Demolish <strong>Terminal</strong> B. Construct remaining airfield pavement to<br />
provide triple taxilane access south from the new terminal.<br />
Landrum & Brown Page 172<br />
April 2013
KANSAS CITY NEW TERMINAL STUDY<br />
ADVANCE TERMINAL PLANNING STUDY<br />
PROGRAM CRITERIA DOCUMENT<br />
DRAFT<br />
Figure 6.1.11<br />
OVERALL AIRFIELD PHASING DIAGRAM<br />
Source:<br />
HNTB<br />
DRAFT<br />
6.1.7.1 Airfield Construction-Phase 1<br />
Phase 1 includes the reconstruction of Taxiways A and B for the purpose of raising<br />
the elevation of the north side of the apron to ultimately provide a consistent apron<br />
elevation around the perimeter of the terminal. Taxiways A and B cannot be closed<br />
simultaneously. <strong>Terminal</strong> B gates will not be impacted during this phase of<br />
construction either. Figure 6.1-12, Airfield Phasing Diagram-Phase 1, shows<br />
this area.<br />
Phase 1 construction operations should consider the following sequence.<br />
1. Perform demolition and construction operations on Taxiway A and connecting<br />
taxiways from the east edge of the Runway 1L-19R RSA to the west edge of<br />
the Taxiway A RSA. Aircraft operations will be maintained on Taxiway B, the<br />
existing terminal aprons and Runway 1L-19R. All connecting taxiways south<br />
of Taxiway B4 shall remain closed after the completion of Taxiway A<br />
construction due to the elevation changes.<br />
Landrum & Brown Page 173<br />
April 2013
KANSAS CITY NEW TERMINAL STUDY<br />
ADVANCE TERMINAL PLANNING STUDY<br />
PROGRAM CRITERIA DOCUMENT<br />
DRAFT<br />
2. Perform demolition operations on Taxiway B and connecting taxiways from<br />
the east edge of the Taxiway A RSA to the east edge of Taxiway B. Aircraft<br />
operations will be maintained on Taxiway A and Runway 1L-19R.<br />
All connecting taxiways south of Taxiway B4 can re-open after the<br />
construction operations within the Taxiway B safety area are completed.<br />
3. Simultaneously with the Taxiway B construction, <strong>Terminal</strong> A can be<br />
demolished.<br />
4. Remove enough <strong>Terminal</strong> A apron pavement to construct the foundation and<br />
walls of the new terminal. Leave as much of the existing pavement to serve<br />
as a staging area for terminal construction.<br />
5. Constructing the west deicing pads and associated drainage network after<br />
the Taxiway B construction will allow the deicing pads to be commissioned as<br />
soon as possible. Remove only enough apron pavement as necessary to<br />
maintain as much of the existing pavement for terminal construction staging<br />
operations.<br />
6. Remove additional <strong>Terminal</strong> A apron pavement to construct taxilanes from<br />
<strong>Terminal</strong> B to the deicing pads. Aircraft can begin deicing operations at the<br />
new deicing pads upon completion of the access to the deicing pads.<br />
7. Construct the remainder of Phase 1 pavement upon completion of the<br />
construction of the exterior walls of the terminal.<br />
Figure 6.1-12<br />
AIRFIELD PHASING DIAGRAM-PHASE 1<br />
DRAFT<br />
Source:<br />
HNTB<br />
Landrum & Brown Page 174<br />
April 2013
KANSAS CITY NEW TERMINAL STUDY<br />
ADVANCE TERMINAL PLANNING STUDY<br />
PROGRAM CRITERIA DOCUMENT<br />
DRAFT<br />
6.1.7.2 Airfield Construction-Phase 2A<br />
Upon completion the Phase 1 pavement, it will be necessary to close Gates 31-35 in<br />
<strong>Terminal</strong> B to construct the Phase 2A pavement to allow access to the south interior<br />
gates. It will take approximately three months to complete the Phase 2A pavement<br />
construction. The construction of the pavement area depicted in Figure 6.1-13,<br />
Airfield Phasing Diagram-Phase 2A, should occur simultaneously with the last<br />
three months of the terminal construction.<br />
Figure 6.1-13<br />
AIRFIELD PHASING DIAGRAM-PHASE 2A<br />
Source:<br />
HNTB<br />
DRAFT<br />
Four gates currently utilized by Southwest Airlines will not be accessible during the<br />
construction of the Phase 2A apron pavement. The KCAD shall coordinate with the<br />
impacted airline to maintain the airline’s operations. Options to consider include.<br />
1. Close Gates 31-35 and Southwest Airlines operates from fewer gates for<br />
three months. This is likely not possible as they are the busiest carrier at<br />
KCI.<br />
2. During the shift of airlines when <strong>Terminal</strong> A closes, move Delta to <strong>Terminal</strong> C<br />
and provide an additional four gates for Southwest on the east side of their<br />
current gates. Move a smaller airline from <strong>Terminal</strong> A or C into the area<br />
vacated by Delta.<br />
3. Prior to Phase 2A paving, construct the majority of the new terminal to allow<br />
<strong>Terminal</strong> B tenants to vacate their current space and occupy the northern<br />
and western gates of the new terminal.<br />
Landrum & Brown Page 175<br />
April 2013
KANSAS CITY NEW TERMINAL STUDY<br />
ADVANCE TERMINAL PLANNING STUDY<br />
PROGRAM CRITERIA DOCUMENT<br />
DRAFT<br />
Upon completion of Phase 2A, only a single taxilane from the south gates is<br />
constructed. Ground movements into the southern gates will have to be<br />
coordinated with departures from the southern gates as there will be a bottleneck<br />
until Phase 2B is constructed.<br />
6.1.7.3 Airfield Construction-Phase 2B<br />
Figure 6.1-14, Airfield Phasing Diagram-Phase 2B, depicts the paving limits of<br />
this Phase. This paving will require the closure of many <strong>Terminal</strong> B gates andwill<br />
occur after <strong>Terminal</strong> B airlines have moved to the new terminal. This phase<br />
includes the construction of the south deicing pads. Phase 2B will provide a second<br />
taxilane from the southern terminal gates, but also a single taxilane south to<br />
Taxiway D.<br />
Phase 2B can be constructed without <strong>Terminal</strong> B being demolished but many of the<br />
gates at <strong>Terminal</strong> B will require closure.<br />
Figure 6.1-14<br />
AIRFIELD PHASING DIAGRAM-PHASE 2B<br />
DRAFT<br />
Source:<br />
HNTB<br />
Landrum & Brown Page 176<br />
April 2013
KANSAS CITY NEW TERMINAL STUDY<br />
ADVANCE TERMINAL PLANNING STUDY<br />
PROGRAM CRITERIA DOCUMENT<br />
DRAFT<br />
6.1.7.4 Airfield Construction-Phase 2C<br />
Once <strong>Terminal</strong> B is demolished, Phase 2C can be constructed. Phase 2C may be<br />
constructed simultaneously with Phases 2A and/or 2B depending on when <strong>Terminal</strong><br />
B is vacated and if <strong>Terminal</strong> B will be demolished after the airlines shift to the new<br />
terminal.<br />
As shown in Figure 6.1-15, Airfield Phasing Diagram-Phase 2C, this pavement<br />
provides dual taxilanes around the south deicing pads and provides triple taxilane<br />
capabilities from the southern terminal gates.<br />
Figure 6.1-15<br />
AIRFIELD PHASING DIAGRAM-PHASE 2C<br />
Source: HNTB<br />
DRAFT<br />
Landrum & Brown Page 177<br />
April 2013
KANSAS CITY NEW TERMINAL STUDY<br />
ADVANCE TERMINAL PLANNING STUDY<br />
PROGRAM CRITERIA DOCUMENT<br />
DRAFT<br />
6.2 Ground Access Site Plan for the New <strong>Terminal</strong><br />
The recommended New <strong>Terminal</strong> ground access site plan provides the following<br />
features:<br />
<br />
<br />
<br />
<br />
<br />
<br />
<br />
<br />
<br />
A two-level curb roadway adjacent to the New <strong>Terminal</strong> building<br />
Reconfiguration of the existing terminal loop roadway utilizing Bonn Circle<br />
and including relocation of the existing return-to-terminal roadway<br />
A six-level parking structure<br />
A commercial vehicle plaza within the parking structure<br />
A surface parking lot behind the new parking structure and within the new<br />
terminal loop roadway<br />
Consolidated entry and exit plazas for the garage and surface parking areas<br />
Connections to the existing <strong>Terminal</strong> B and <strong>Terminal</strong> C garages<br />
Relocation of the taxi and commercial vehicle staging areas<br />
Opportunity to maintain existing Central Utility Plant (CUP) and Police<br />
Building<br />
Figure 6.2-1, Ground Access Site Plan, shows the recommended overall<br />
landside concept features that preserve the existing airfield lighting vault and FAA<br />
ATCT. The concept also allows the existing CUP to be retained, as shown, during<br />
construction and as part of the final build out, if warranted.<br />
DRAFT<br />
Landrum & Brown Page 178<br />
April 2013
KANSAS CITY NEW TERMINAL STUDY PROGRAM CRITERIA DOCUMENT<br />
ADVANCE TERMINAL PLANNING STUDY DRAFT<br />
Landrum & Brown Page 179<br />
April 2013<br />
Figure 6.2-1<br />
GROUND ACCESS SITE PLAN<br />
DRAFT<br />
Source: HNTB
KANSAS CITY NEW TERMINAL STUDY<br />
ADVANCE TERMINAL PLANNING STUDY<br />
PROGRAM CRITERIA DOCUMENT<br />
DRAFT<br />
6.2.1 ROADWAYS<br />
As shown in Figure 6.2-1, Ground Access Site Plan, the recommended roadway<br />
concept will provide a reconstruction of the terminal loop roadway to align with<br />
Bonn Circle, relocated return-to-terminal roadway, two-level curbside adjacent to<br />
the New <strong>Terminal</strong>, separate access for commercial vehicles to a dedicated<br />
commercial vehicle plaza, terminal loading dock with separate access, and modified<br />
access to the FAA ATCT.<br />
6.2.1.1 <strong>Terminal</strong> Loop Roadway<br />
The New <strong>Terminal</strong> loop roadway will diverge from the existing Cookingham Drive<br />
alignment immediately south of the Paris Street overpass to access the New<br />
<strong>Terminal</strong>. Access to the parking garage and surface lot entrances will be provided<br />
from the left side of the terminal loop roadway before the main<br />
The primary terminal complex entrance along Cookingham Drive would remain two<br />
lanes until splitting to provide two access lanes, each to the upper (departures) and<br />
lower (arrivals) level curbside roadways (four lanes total). South of the New<br />
<strong>Terminal</strong>, the loop roadway will follow the Bonn Circle alignment to allow sufficient<br />
space for the upper and lower roadways to merge and to maximize the area<br />
available for surface parking within the loop roadway. The upper and lower<br />
roadways are two lanes each merging to two outbound lanes east of <strong>Terminal</strong> B.<br />
The outbound roadway returns to the existing International Circle/Cookingham<br />
Drive alignment north of <strong>Terminal</strong> C where both the parking exit and commercial<br />
vehicle roadway merge with the outbound roadway.<br />
6.2.1.2 Return-To-<strong>Terminal</strong> Roadway<br />
The return-to-terminal roadway will be relocated beyond the Paris Street overpass<br />
to accommodate for maneuvering vehicles as they approach the New <strong>Terminal</strong>.<br />
This roadway should be a minimum of one lane with a shoulder, and provide an<br />
additional storage lane along Cookingham Drive in both the northbound and<br />
southbound directions to allow sufficient time for vehicles to reduce speed for the<br />
turn and merge with traffic after the turn.<br />
6.2.1.3 Curbsides<br />
DRAFT<br />
As part of the New <strong>Terminal</strong> design, curbs and separate private vehicle arrivals and<br />
departures curbs will be provided. Zero clearance - or soft curbs - are proposed to<br />
minimize passenger tripping hazards. Sloping pavement will be used for the curbs<br />
and/or different pavement material or colors will be used for the roadway to help<br />
differentiate between the pedestrian and vehicle areas. Bollards will be provided<br />
along the curb to protect waiting passengers from vehicles.<br />
A maximum grade of 6 percent will be used on the curbside approach roadway and<br />
4.3 percent on the departure roadway.<br />
Landrum & Brown Page 180<br />
April 2013
KANSAS CITY NEW TERMINAL STUDY<br />
ADVANCE TERMINAL PLANNING STUDY<br />
PROGRAM CRITERIA DOCUMENT<br />
DRAFT<br />
As shown on Figure 6.2-2, Departures Level, the departures roadway will be<br />
four lanes, comprised of one 20-foot wide parking lane and three 11-foot wide<br />
travel lanes. The 20-foot wide parking lane will allow vehicles to double park as<br />
necessary to unload passengers during the peak periods without blocking the travel<br />
lanes. The lane adjacent to the parking lane will accommodate vehicle<br />
maneuvering and, as a result, will have a lower vehicle throughput than the outer<br />
travel lanes.<br />
The departures curbside length will be 790 feet, meeting the requirement for<br />
providing LOS C operations during peak periods. LOS C operations will allow double<br />
parking on up to 40 percent of the curb. The required curb length assumes only<br />
private vehicle, taxicab, and for-hire shuttle and limousine passenger drop-off, and<br />
all other commercial vehicle drop-off will occur at the commercial vehicle plaza.<br />
A 20-foot sidewalk/curb will be provided for passenger loading between the<br />
roadway and terminal building.<br />
Figure 6.2-2<br />
DEPARTURES LEVEL<br />
DRAFT<br />
Source:<br />
HNTB<br />
Landrum & Brown Page 181<br />
April 2013
KANSAS CITY NEW TERMINAL STUDY<br />
ADVANCE TERMINAL PLANNING STUDY<br />
PROGRAM CRITERIA DOCUMENT<br />
DRAFT<br />
The arrivals curb is located on the lower level adjacent to baggage claim and is<br />
depressed 10 feet below grade adjacent to the new terminal building. As shown on<br />
Figure 6.2-3, Arrivals Level, the arrivals roadway will be four lanes comprised of<br />
one 20-foot wide parking lane and three 11-foot wide travel lanes. The 20-foot<br />
parking lane will allow vehicles to double-park as necessary to load passengers<br />
during the peak periods without blocking the travel lanes. The lane adjacent to the<br />
parking lane will accommodate vehicle maneuvering and, as a result, will have a<br />
lower vehicle throughput than the outer travel lanes. Two additional bypass lanes<br />
are provided east of the curbside roadway. These lanes are separated by a 10 foot<br />
median serving as a landing for the upper level roadway columns.<br />
The arrivals curbside length will be 895 feet, meeting the requirement for providing<br />
LOS C operations during peak periods. LOS C operations will allow double parking<br />
on up to 40 percent of the curb. The required curb length assumes only private<br />
vehicle passenger pick-up and all commercial vehicle pick-up will occur at the<br />
commercial vehicle plaza. A 20-foot sidewalk/curb for passenger waiting and<br />
loading will be provided between the roadway and terminal building.<br />
Figure 6.2-3<br />
ARRIVALS LEVEL<br />
DRAFT<br />
Source:<br />
HNTB<br />
Landrum & Brown Page 182<br />
April 2013
KANSAS CITY NEW TERMINAL STUDY<br />
ADVANCE TERMINAL PLANNING STUDY<br />
PROGRAM CRITERIA DOCUMENT<br />
DRAFT<br />
6.2.1.4 Commercial Vehicle Access Roadway<br />
A dedicated commercial vehicle access roadway will be provided on the east side of<br />
the site with direct access to the commercial plaza within the garage. This roadway<br />
will be two lanes in each direction to provide sufficient capacity and prevent slower<br />
moving buses from blocking other vehicles. The entrance to the commercial<br />
roadway is off Cookingham Drive immediately prior to the parking entrance and<br />
would be restricted to commercial vehicles and FAA traffic only. The inbound and<br />
outbound lanes will traverse the FAA ATCT parking areas with the outbound lanes<br />
connecting to the terminal outbound roadway just past the parking exit plaza.<br />
To maintain the CUP and Police Building, the commercial roadway would be located<br />
17.4 feet onto the south side of the FAA ATCT parking area. This offset would allow<br />
an 8-foot walkway on the north side of the Police Building to be maintained along<br />
with a new exit from the FAA ATCT parking area between the building and<br />
Commercial Roadway.<br />
The commercial plaza will have a maximum 5 percent embankment to allow buses<br />
to make the ascent/descent in snow and icy conditions, and allow snow removal<br />
equipment to clear snow.<br />
6.2.1.5 Loading Docks<br />
A primary loading dock will be provided on the north side of the New <strong>Terminal</strong> for<br />
concessions delivery and trash collection. Dedicated access to this dock will be<br />
provided from Paris Street along Athens Avenue, which would be upgraded and<br />
extend to the New <strong>Terminal</strong>. It is assumed that concession deliveries would be<br />
made to a central receiving location and then brought to the New <strong>Terminal</strong> loading<br />
dock in box trucks. However, space will be provided north of the dock to allow a<br />
53-foot tractor-trailer to turn and back into the dock or turn to leave if necessary.<br />
DRAFT<br />
A secondary loading area will be provided on the south side of the building and<br />
accessed from the south end of the lower level roadway but would be restricted to<br />
parking for authorized employees or deliveries by small vehicles.<br />
Truck loading/unloading could not occur here due to having to traverse the lower<br />
level curbside roadway and make a tight 180-degree turn to access the<br />
dock/parking area.<br />
6.2.1.6 FAA Air Traffic Control Tower Access<br />
Access for vehicular traffic will be provided to the FAA ATCT site along the<br />
commercial vehicle roadway. Direct access into the site will be provided from the<br />
inbound commercial vehicle lanes with an entrance on the northeast end of the site.<br />
Egress will be provided from the west end of the site with an exit lane connecting to<br />
the southwest corner, traversing under the commercial roadway adjacent to the<br />
surface parking access roadway and connecting to the south side of the outbound<br />
commercial lanes when the vehicles reach ground level. This allows FAA employees<br />
and visitors direct ingress and egress to the site without going through the public<br />
Landrum & Brown Page 183<br />
April 2013
KANSAS CITY NEW TERMINAL STUDY<br />
ADVANCE TERMINAL PLANNING STUDY<br />
PROGRAM CRITERIA DOCUMENT<br />
DRAFT<br />
parking entry or exit plazas. As described in Section 6.2.1.4, to maintain the CUP<br />
and Police Building, the commercial roadway would be located 17.4 feet on the<br />
south side of the FAA ATCT parking area.<br />
6.2.1.7 Roadway Phasing<br />
The interim roadway phasing, as depicted in Figure 6.2-4, Roadway Phasing,<br />
will provide a contiguous area for terminal, garage, and utility construction to occur<br />
for as long as possible while maintaining operations and vehicle access at<br />
<strong>Terminal</strong>s B and C. It is expected that the major vehicle movements remain freeflow<br />
with limited stop control on the minor movements. As depicted, inbound traffic<br />
flow will be provided along the east portion of International Circle with a temporary<br />
connection from Cookingham Drive to International Circle. Direct access for<br />
vehicles to <strong>Terminal</strong>s B and C from International Circle will be provided via the<br />
existing bridges. These movements would be free flow with no crossing traffic.<br />
Outbound traffic from <strong>Terminal</strong> B would follow International Circle but ramp down,<br />
traverse the edge of the Circle Lot connecting to Bonn Circle, pass under the<br />
<strong>Terminal</strong> C access bridges, and merge with Cookingham Drive along the planned<br />
terminal exit roadway. In order to maintain free-flow operations from <strong>Terminal</strong> C,<br />
the outbound <strong>Terminal</strong> C traffic would use International Circle in the opposite<br />
direction of the inbound traffic with a barrier dividing the traffic flows.<br />
A roadway connection between <strong>Terminal</strong> B and C will be provided along<br />
International Circle in the north direction to allow commercial vehicles to drop-off<br />
and pick-up at both terminals.<br />
DRAFT<br />
In order to maintain access to <strong>Terminal</strong> B during construction, the south wing of the<br />
parking garage would be phased last and completed once <strong>Terminal</strong> B operations are<br />
moved.<br />
As terminal parking will be limited during construction, every effort should be made<br />
to keep the Circle Lot, between <strong>Terminal</strong>s B and C and north of <strong>Terminal</strong> C,<br />
operational through construction. There would be no connection between parking<br />
lots due to the outbound <strong>Terminal</strong> B traffic flow and the new parking exit, would<br />
need to be provided in the portion adjacent to <strong>Terminal</strong> C. Access to the portion of<br />
the Circle Lot between <strong>Terminal</strong>s B and C will be provided via a ramp from the<br />
<strong>Terminal</strong> B access. Access to the portion of the Circle Lot adjacent to <strong>Terminal</strong> C<br />
will be provided from the curbside exit.<br />
During construction, return-to-terminal traffic will use the Paris Street overpass or<br />
the newly constructed return-to-terminal roadway beyond the terminal complex.<br />
FAA traffic has direct ingress from International Circle, but during construction<br />
would also exit to International Circle in the south flow direction, and use the<br />
connector prior to the <strong>Terminal</strong> B curb entrance to turn and merge with the<br />
<strong>Terminal</strong> B exiting traffic.<br />
Landrum & Brown Page 184<br />
April 2013
KANSAS CITY NEW TERMINAL STUDY<br />
ADVANCE TERMINAL PLANNING STUDY<br />
PROGRAM CRITERIA DOCUMENT<br />
DRAFT<br />
Figure 6.2-4<br />
ROADWAY PHASING<br />
Source:<br />
HNTB<br />
6.2.2 PARKING<br />
The recommended landside concept includes a six level parking structure and an<br />
approximately 2,400 space surface parking area east of the garage. The plan<br />
maintains the existing airfield lighting vault and FAA ATCT facility, provides space<br />
for a new central utility plant adjacent to the exit plaza, maintains the existing<br />
<strong>Terminal</strong> B and C garages, and allows the existing CUP and Police Building to be<br />
maintained during construction and beyond if desired. Specific components of the<br />
plan are described below.<br />
6.2.2.1 Garage<br />
DRAFT<br />
The proposed new garage footprint has been planned to preserve the airfield<br />
lighting vault and FAA ATCT facility sites, and would be constructed 39 feet west of<br />
the existing police building allowing it to be maintained during construction.<br />
The offset will provide a 7.5-foot walkway to maintain access to the west side of the<br />
police building and an access roadway for the surface parking area between the<br />
Landrum & Brown Page 185<br />
April 2013
KANSAS CITY NEW TERMINAL STUDY<br />
ADVANCE TERMINAL PLANNING STUDY<br />
PROGRAM CRITERIA DOCUMENT<br />
DRAFT<br />
walkway and garage. Sufficient space will be provided to allow excavation during<br />
construction of the lower levels of the garage while maintaining the police building<br />
using standard construction practices of excavation slopes.<br />
The garage will be six-levels, two levels below-grade, one at-grade, and three<br />
above-grade to maintain views over the garage from the arrivals level of the<br />
terminal building. There will be three main sections to conform to the circular<br />
alignment of the terminal and roadway system; however, each of these sections<br />
would connect and vehicles would circulate seamlessly between them. The garage<br />
will be 350 feet deep with the north wing 468 feet long, the central section 588 feet<br />
long, and the south wing 468 feet long. Area is available for expanding the north<br />
and south wings on either side of the garage.<br />
Vehicles would enter the garage at the third floor and circulate either up or down to<br />
find parking. External helices will be provided for primary entry and exit flows with<br />
the entry flow through the north helix and exit flow through the south helix.<br />
Internal ramps will be provided in each wing to allow circulation between floors and<br />
a simplified search pattern. Direct access from the entry plaza to the ground level<br />
third floor will also be provided.<br />
A typical floor plan is depicted on Figure 6.2-5, Typical Garage Floor Plate,<br />
representing levels one through four that will provide 1,336 parking spaces per<br />
level. Parking aisles will follow an east-west configuration with the pedestrian flow<br />
toward a center circulation core and then east-west toward the building.<br />
The proposed floor plan for Level 5 is depicted on Figure 6.2-6, Garage Level 5<br />
Commercial Vehicle Floor Plate. Level 5 will serve as the commercial vehicle<br />
plaza and will also accommodate 1,016 parking spaces with 509 on each side of the<br />
commercial plaza. In order to maintain uninterrupted commercial vehicle flow, no<br />
connection between the north and south sides of the garage will be provided on<br />
Level 5. Vehicles would use the internal ramping system to access Level 4 or<br />
Level 6 to connect to the opposite side of the garage. Level 5 will serve as the<br />
primary pedestrian circulation to and from the terminal and provide moving<br />
walkways on either side of the commercial plaza to facilitate pedestrian movement<br />
through the garage.<br />
DRAFT<br />
The proposed floor plan for Level 6 is depicted on Figure 6.2-7, Garage Level 6<br />
Upper Floor Plate. Level 6 will be the top floor of the garage and provide<br />
1,206 parking spaces with an open area above the commercial plaza to allow<br />
sunlight to reach the plaza and exhaust fumes to escape. The opening will provide<br />
added height to the commercial plaza preventing it from feeling constricted.<br />
A connection between the north and south sides of the garage will be provided on<br />
both the east and west ends allowing vehicles to circulate between areas.<br />
Landrum & Brown Page 186<br />
April 2013
KANSAS CITY NEW TERMINAL STUDY PROGRAM CRITERIA DOCUMENT<br />
ADVANCE TERMINAL PLANNING STUDY DRAFT<br />
Landrum & Brown Page 187<br />
April 2013<br />
Figure 6.2-5<br />
TYPICAL GARAGE FLOOR PLATE<br />
DRAFT<br />
Source: HNTB
KANSAS CITY NEW TERMINAL STUDY PROGRAM CRITERIA DOCUMENT<br />
ADVANCE TERMINAL PLANNING STUDY DRAFT<br />
Landrum & Brown Page 188<br />
April 2013<br />
Figure 6.2-6<br />
GARAGE LEVEL 5 COMMERCIAL VEHICLE FLOOR PLATE<br />
DRAFT<br />
Source: HNTB
KANSAS CITY NEW TERMINAL STUDY PROGRAM CRITERIA DOCUMENT<br />
ADVANCE TERMINAL PLANNING STUDY DRAFT<br />
Landrum & Brown Page 189<br />
April 2013<br />
Figure 6.2-7<br />
GARAGE LEVEL 6 UPPER FLOOR PLATE<br />
DRAFT<br />
Source: HNTB
KANSAS CITY NEW TERMINAL STUDY<br />
ADVANCE TERMINAL PLANNING STUDY<br />
PROGRAM CRITERIA DOCUMENT<br />
DRAFT<br />
The space counts for each floor of the garage, as depicted on Figures 6.2-5, 6.2-6,<br />
and 6.2-7, are summarized on Table 6.2-1, New Garage Parking Space<br />
Summary. A total of 7,566 parking spaces are depicted; however, this number<br />
will reduce slightly as handicap parking spaces are added.<br />
Table 6.2-1<br />
NEW GARAGE PARKING SPACE SUMMARY<br />
FLOOR<br />
SPACE COUNT<br />
First 1,336<br />
Second (Tunnel Connection) 1,336<br />
Third (Ground) 1,336<br />
Fourth 1,336<br />
Fifth (Commercial Plaza, Bridge Connection) 1,016<br />
Sixth 1,206<br />
Total 7,566<br />
Note:<br />
Based on typical floor plans shown in Figures 6.2-5, 6.2-6, and 6.2-7 and does not count<br />
lost space for ADA parking stalls.<br />
The Americans with Disabilities Act (ADA) defines a minimum required number of<br />
handicap accessible parking spaces based on the size of the parking facility.<br />
The minimum requirement per the ADA Accessibility Guidelines, as amended in<br />
September 2002, is provided in Table 6.2-2, Minimum Accessible Parking<br />
Space Requirement. To meet ADA requirements, one of every eight accessible<br />
spaces, but not less than one must be van accessible with an adjacent access aisle.<br />
In accordance with these requirements the depicted parking garage would require<br />
86 accessible parking spaces with 11 of these being van accessible. Accessible<br />
parking stalls should be provided in each parking facility available to ensure equal<br />
access to all parking rates and types of parking offered at the airport.<br />
DRAFT<br />
Table 6.2-2<br />
MINIMUM ACCESSIBLE PARKING SPACE REQUIREMENT<br />
TOTAL PARKING SPACES IN MINIMUM REQUIRED NUMBER OF ACCESSIBLE<br />
LOT OR GARAGE<br />
SPACES<br />
0-25 1<br />
26-50 2<br />
51-75 3<br />
76-100 4<br />
101-150 5<br />
151-200 6<br />
201-300 7<br />
301-400 8<br />
401-500 9<br />
501-1,000 2% of total<br />
1,001 and over 20 plus 1 for every 100 or fraction of 100 over 1,000<br />
Source: Americans with Disabilities Act Accessibility Guidelines as amended September 2002.<br />
Landrum & Brown Page 190<br />
April 2013
KANSAS CITY NEW TERMINAL STUDY<br />
ADVANCE TERMINAL PLANNING STUDY<br />
PROGRAM CRITERIA DOCUMENT<br />
DRAFT<br />
The primary pedestrian route to the New <strong>Terminal</strong> will be on Level 5 of the garage.<br />
Moving walkways will be provided on either side of the commercial vehicle plaza to<br />
aid pedestrian movement between the backs of the garage and two pedestrian<br />
bridges connecting to the terminal on either side of the commercial vehicle plaza.<br />
Pedestrians at all levels of the garage will be directed to this level to access the<br />
pedestrian bridges. A secondary terminal connection will also be provided via two<br />
tunnels located on Level 2 of the garage for those parking in the front (west)<br />
portion of lower levels.<br />
Three primary vertical circulation cores will be provided and located at the front,<br />
center, and back of the garage. The back circulation core is on the south end of the<br />
central portion of the garage providing vertical access to the pedestrian walkways<br />
on Level 5 for those parking in the surface lot. Two central circulation cores, one<br />
on each side of the commercial plaza will provide primary vertical access to Level 5<br />
for those parking in the central or back portions of the garage. Each circulation<br />
core will consist of two elevators and a stairwell. Vertical circulation will also be<br />
provided at the front of the garage adjacent to the pedestrian bridges and tunnels<br />
on either side of the commercial vehicle plaza. A set of up/down escalators<br />
between each floor of the garage and three elevators will be provided on each side<br />
of the plaza. The tunnels on Level 2 and bridges on Level 5 will allow passengers to<br />
walk between the garage and terminal with a minimum of one level change.<br />
Table 6.2-3, Parking Design <strong>Criteria</strong>, lists the criteria used for the garage floor<br />
plans. Parking bays are depicted at a minimum of 62 feet, to match existing<br />
facilities at KCI, with a desired stall width of 9 feet to allow sufficient room to<br />
unload passengers and baggage from vehicles (8.5 feet is the minimum allowable<br />
stall width for this facility to maintain acceptable level of service). The column grid<br />
depicted is 63 feet by 27 feet allowing structural columns to be located between<br />
parking spaces without compromising the parking space depth. The column<br />
spacing would remain the same beneath the commercial plaza but the floor slab<br />
depth would increase from 30 inches to 36 inches. The floor-to-floor height is also<br />
shown as 12 feet on a typical level with 14 feet provided on the commercial vehicle<br />
level to allow extra clearance for commercial vehicles. Emergency vehicles would<br />
be restricted to the commercial plaza on the fifth floor of the garage and snow<br />
removal vehicles are also only assumed to be required on the fifth floor and roof, as<br />
necessary. Access would be provided for trucks to conduct maintenance and<br />
repairs.<br />
DRAFT<br />
An area may be reserved for priority parking near the terminal walkways on Level 5<br />
and if desired, higher fees could be charged for these spaces. This would provide a<br />
direct connection to the terminals and access to the passenger check-in and<br />
baggage check facilities at the commercial vehicle plaza. Spaces near the bridges<br />
on Level 5 and tunnels on Level 2 could be utilized for handicap accessible parking.<br />
Landrum & Brown Page 191<br />
April 2013
KANSAS CITY NEW TERMINAL STUDY<br />
ADVANCE TERMINAL PLANNING STUDY<br />
PROGRAM CRITERIA DOCUMENT<br />
DRAFT<br />
Table 6.2-3<br />
PARKING DESIGN CRITERIA<br />
Parking bay<br />
PARAMETER<br />
Parking space width (recommended shown)<br />
Parking space width (minimum)<br />
Parking garage column grid depicted<br />
Emergency vehicle access<br />
Snow removal vehicle access<br />
Typical floor-to-floor height depicted<br />
Commercial plaza level floor-to-floor height<br />
depicted<br />
CRITERIA<br />
62 feet<br />
9 feet<br />
8.5 feet<br />
63 feet by 27 feet<br />
Only Level 5 (commercial plaza)<br />
Only Level 5 (commercial plaza);<br />
Level 6 (roof) if covering not provided<br />
12 feet<br />
14 feet<br />
Source:<br />
Team recommendation with input from KCAD.<br />
6.2.2.2 Surface Parking<br />
Surface parking is provided in the area east of the garage and south of the FAA<br />
ATCT providing approximately 2,462 parking spaces with removal of the existing<br />
CUP/Police Building and 2,360 parking spaces if the building remains. Within this<br />
lot a minimum of 35 handicap accessible spaces and five van accessible spaces<br />
must be provided. Pedestrian access to the terminal is provided through level 5 of<br />
the parking garage with elevators on the back and center of the garage to provide<br />
vertical circulation to reach level 5 from the surface lot. Parking bays are depicted<br />
at a minimum of 62 feet to match existing facilities at KCI. A desired width of<br />
9 feet (8.5 feet is considered the minimum allowable width) will allow sufficient<br />
room to unload passengers and baggage from vehicles.<br />
DRAFT<br />
6.2.2.3 Entry and Exit Plazas<br />
The primary entrance to the parking garage and surface lot is provided from the left<br />
side of the terminal entrance roadway before the new terminal and parking garage.<br />
After branching off the main terminal access roadway the parking entry splits to<br />
separate entrances for the garage and surface lot. The entrance plaza queue area<br />
would also serve as a screening area for vehicles entering the parking garage<br />
during high threat levels and a connection back to the terminal access roadway will<br />
be provided for vehicles that do not wish to be searched.<br />
A secondary dual lane access to the garage will be provided after the departures<br />
curbside to serve those that want to enter the parking garage after dropping-off<br />
passengers or those that might access the terminal roadway from Paris Street<br />
ramp, which merges with the terminal access roadway beyond the main parking<br />
entrance.<br />
Landrum & Brown Page 192<br />
April 2013
KANSAS CITY NEW TERMINAL STUDY<br />
ADVANCE TERMINAL PLANNING STUDY<br />
PROGRAM CRITERIA DOCUMENT<br />
DRAFT<br />
Plaza sizing was based on a projected hourly design volume and estimated service<br />
rate for each entry/exit lane. The hourly design volume was determined by<br />
reviewing the March 2012 peak hour parking entry and exit volumes for each<br />
facility. The combined hourly volumes for the existing <strong>Terminal</strong>s A, B, and C<br />
garages were used for the New <strong>Terminal</strong> garage entry and the Circle Lot volumes<br />
were used for the surface lot entry. Combined terminal garages and Circle Lot peak<br />
hour exit volumes were used for a combined exit plaza. The March 2012 peak hour<br />
entry/exit volumes for each facility were adjusted to represent the peak transaction<br />
month of July for the garages and October for the Circle Lot. These adjusted<br />
volumes were projected to 2030 based on the forecast growth in origin and<br />
destination passengers. The volumes were then increased relative to the difference<br />
in the required parking spaces and the number of parking spaces to be provided in<br />
the proposed facilities to represent the maximum volume for the initial build.<br />
This volume was then divided by a service rate of 0.85 to account for surges within<br />
the peak hour resulting in the peak hour design volume reported in Table 6.2-4,<br />
Parking Plaza Sizing.<br />
The number of entry and exit lanes shown in Table 6.2-4, Parking Plaza Sizing, was<br />
determined by the number of lanes required to accommodate the peak hour design<br />
volume with the design throughput for each lane. The design throughput assumes<br />
a capacity associated with unfamiliar drivers to represent the portion of airport<br />
parking users who are infrequent and have slower processing times than frequent<br />
users such as employees or frequent travelers. The entry lanes assume a push<br />
button ticket dispenser with unfamiliar user capacity of 250 vehicles per hour. Use<br />
of alternate equipment could result in different throughput capacity. Four entry<br />
lanes are required for the garage and two for the surface parking lot. Five garage<br />
entry lanes are recommended to provide for the reduction of one lane taken out of<br />
service for repairs.<br />
DRAFT<br />
The exit plaza will be sized to accommodate both the garage and surface parkers<br />
and a gate would be provided between the lots allowing garage patrons to exit<br />
through the surface lot but prevent surface parkers from trying to park in the<br />
garage. The number of exit lanes was calculated for 100 percent pay-on-foot with<br />
an unfamiliar user service rate of 200 vehicles per hour and 100 percent manned<br />
cashier stations with an unfamiliar user service rate of 100 vehicles per hour.<br />
Six lanes would be required if parking is 100 percent pay-on-foot while twelve lanes<br />
would be required if all exit booths are staffed with cashiers. Pay-on-foot has the<br />
fastest transaction time because the ticket is coded at a pay station within the<br />
parking area and entered into the machine at the exit lane raising the gate arm<br />
when the ticket is processed requiring no additional interaction. Alternate<br />
automated transaction options such as machine read credit-card transactions or<br />
credit card in/out may be used and would have a service rate/throughput capacity<br />
between pay-on-foot and cashier. A combination of both automated and cashier<br />
booths at the exits is recommended to allow flexibility in the future (cashier booths<br />
can be equipped for automated use when not staffed). The ground access site plan<br />
depicts the maximum 12 lanes to reserve space for maximum flexibility during<br />
design. When a parking revenue control system vendor is chosen, specific design<br />
capacities will be provided for their specific equipment and the recommended<br />
number of lanes can be refined as necessary.<br />
Landrum & Brown Page 193<br />
April 2013
KANSAS CITY NEW TERMINAL STUDY<br />
ADVANCE TERMINAL PLANNING STUDY<br />
PROGRAM CRITERIA DOCUMENT<br />
DRAFT<br />
Table 6.2-4<br />
PARKING PLAZA SIZING<br />
TYPE<br />
Entry Garage<br />
Push Button<br />
Dispenser<br />
Entry Surface Lot<br />
DESIGN<br />
THROUGHPUT<br />
PER LANE<br />
PEAK HOUR<br />
DESIGN VOLUME<br />
(WITH 0.85<br />
SERVICE RATE)<br />
REQUIRED<br />
NUMBER OF<br />
LANES<br />
RECOMMENDED<br />
NUMBER OF<br />
LANES<br />
250 veh/hr 830 veh/hr 4 lanes 5 lanes<br />
Push Button<br />
250 veh/hr 255 veh/hr 2 lanes 2 lanes<br />
Dispenser<br />
Exit Garage and Surface<br />
Note:<br />
Sources:<br />
Pay-on-foot 200 veh/hr 1,115 veh/hr 6 lanes<br />
Cashier<br />
(variable<br />
fee)<br />
100 veh/hr 1,115 veh/hr 12 lanes 12 lanes<br />
Veh/hr = vehicles per hour<br />
Design throughput capacity, Institute of Transportation Engineers, Traffic Engineering Handbook<br />
sourcing Weant and Levinson, Parking; peak hour volumes and lane requirements, HNTB analysis based<br />
on KCAD parking data.<br />
6.2.2.4 Existing Garages B and C<br />
The existing <strong>Terminal</strong> B and C garages would be maintained with connections to the<br />
New <strong>Terminal</strong> loop roadway. The existing <strong>Terminal</strong> B garage, which provides<br />
2,006 parking spaces, would serve as a self-park public garage with a walkway to<br />
the New <strong>Terminal</strong>. The existing <strong>Terminal</strong> C garage which provides 2,258 parking<br />
spaces is envisioned to serve as space for valet parking services, such as vehicle<br />
storage, or employee parking.<br />
6.2.3 COMMERCIAL VEHICLES<br />
Taxis, limos, and for-hire shuttles (such as SuperShuttle) would be allowed to<br />
drop-off passengers on the departures curb. All commercial vehicles including taxi,<br />
limo, and for-hire shuttles passenger pick-up would occur at the commercial vehicle<br />
plaza described below. Access to the plaza would be provided by a dedicated<br />
commercial vehicle roadway described previously in Section 6.2.1, Roadways.<br />
6.2.3.1 Plaza<br />
DRAFT<br />
The commercial vehicle plaza will be 220 feet wide with four 260-foot long<br />
curbsides: one on each side and two island curbs. The outer curb lanes are 36 feet<br />
or three lanes wide and are reserved for bus and shuttle loading/unloading.<br />
The two island curb lanes are 24 feet or two lanes wide and would serve taxis,<br />
limos, and for-hire shuttles. A 20-foot sidewalk curb passenger loading/unloading<br />
area is provided on each side of the roadway and the island curbs are each 23 feet<br />
wide. Vehicle flow-through is inbound on the north side toward outer and inner<br />
north curbs and outbound on the south side through the inner and outer south<br />
Landrum & Brown Page 194<br />
April 2013
KANSAS CITY NEW TERMINAL STUDY<br />
ADVANCE TERMINAL PLANNING STUDY<br />
PROGRAM CRITERIA DOCUMENT<br />
DRAFT<br />
curbs. Vehicles can stop on either the north or south curbs, depending on the<br />
selected allocation plan, with vehicle loading/unloading from the right side of the<br />
vehicle at each curb. The plaza is designed to accommodate the turn radius of a<br />
45-foot bus along the outer curb lanes.<br />
Two potential allocation plans were developed to ensure adequate space and<br />
commercial vehicle operations. The commercial vehicle requirements were adapted<br />
for the operations associated with each allocation plan as shown in Table 6.2-5,<br />
Commercial Vehicle Plaza Sizing. Initial requirements were developed based on<br />
pick-up and drop-off activity for courtesy shuttles occurring at a single stop.<br />
However, the second allocation plan provides a separate area for courtesy shuttles<br />
to drop-off passengers reducing the dwell time required for picking-up passengers<br />
and changing the required curb length.<br />
Table 6.2-5<br />
COMMERCIAL<br />
DRAFT<br />
VEHICLE PLAZA SIZING (FEET)<br />
PROPOSED PROPOSED<br />
2030<br />
2030 ALLOCATION ALLOCATION<br />
REQUIREMENT REQUIREMENT DESIGNATED COMBINED<br />
VEHICLE (INDEPENDENT (COMBINED AREAS<br />
AREAS<br />
CLASSIFICATION OPERATIONS) OPERATIONS) (FIGURE 6.2-8) (FIGURE 6.2-9)<br />
Taxicab 125 125 160 160<br />
Limousine 150 150 200 200<br />
For-Hire Shuttle 105 105 160 160<br />
Rental Car Shuttle 110 110 120 100<br />
Hotel Shuttle 105<br />
120<br />
160<br />
140<br />
Off-Airport Parking 1 160<br />
(combined<br />
160<br />
(combined<br />
Blue Bus/ Economy<br />
110 pick-up)<br />
80<br />
pick-up)<br />
Park<br />
Charter Bus 60 60 Departures curbside<br />
Metro (public bus) 60 60 Departures curbside<br />
Combined Courtesy<br />
N/A 210 N/A 240<br />
Shuttle Drop-off<br />
Total 1,015 980 1,000 1,000<br />
Notes: 1 Off-Airport parking includes Park Air Express<br />
N/A = Not applicable<br />
Source: HNTB Analysis.<br />
Landrum & Brown Page 195<br />
April 2013
KANSAS CITY NEW TERMINAL STUDY<br />
ADVANCE TERMINAL PLANNING STUDY<br />
PROGRAM CRITERIA DOCUMENT<br />
DRAFT<br />
The first allocation plan, Figure 6.2-8, Designated Drop-off/Pick-up Area,<br />
provides a designated area for type of shuttle (rental car, off-Airport parking, KCI<br />
economy parking, and hotel) where both passenger drop-off and pick-up activities<br />
occur. The taxis, limos, and for-hire shuttles would pick up passengers on the<br />
north and south inner islands in both plans.<br />
Figure 6.2-8<br />
DESIGNATED DROP-OFF/PICK-UP AREA<br />
Source: HNTB<br />
DRAFT<br />
Landrum & Brown Page 196<br />
April 2013
KANSAS CITY NEW TERMINAL STUDY<br />
ADVANCE TERMINAL PLANNING STUDY<br />
PROGRAM CRITERIA DOCUMENT<br />
DRAFT<br />
The second allocation plan, Figure 6.2-9, Combined Drop-off Area, provides a<br />
combined passenger drop-off for rental car, off-Airport parking, KCI Economy<br />
Parking, and hotel/motel shuttles on the outer north curb. Passenger pick-up for<br />
these modes is provided on the south curb with rental cars on the west end of the<br />
curb and hotels/parking shuttles on the east end of the curb.<br />
Figure 6.2-9<br />
COMBINED DROP-OFF AREA<br />
Source:<br />
HNTB<br />
DRAFT<br />
6.2.3.2 Staging Area<br />
The commercial vehicle and taxi staging areas will be displaced by the surface<br />
parking area and relocated outside of the terminal area. An area within the existing<br />
surface lot on the south side of Paris Street near London Avenue could potentially<br />
be used for taxi, limo, for-hire shuttle, and charter bus staging with easy access to<br />
the commercial vehicle roadway entrance. An area of 0.32 acres are required for<br />
taxi parking in a traditional nose-to-tail configuration for dispatch to the terminal in<br />
addition to 0.92 acres for limousine and for-hire shuttle staging resulting in a total<br />
requirement of 1.24 acres for commercial vehicle staging.<br />
Landrum & Brown Page 197<br />
April 2013
KANSAS CITY NEW TERMINAL STUDY<br />
ADVANCE TERMINAL PLANNING STUDY<br />
PROGRAM CRITERIA DOCUMENT<br />
DRAFT<br />
6.3 <strong>Terminal</strong> Support and Collateral Development Site<br />
Plan<br />
6.3.1 AVIATION FUELING<br />
The purpose of the aviation fueling system is to supply fuel from the Tank Farm into<br />
the aircraft through an underground piping system. The piping system serves<br />
hydrant pits located at each aircraft parking position. Existing <strong>Terminal</strong>s A, B, and<br />
C include 90 gates. The New <strong>Terminal</strong> will have 37 narrowbody gates.<br />
6.3.1.1 Fuel Pipeline – Magellan - Bridging Concept Analysis<br />
The existing six-inch fuel supply pipeline is adequate to meet the New <strong>Terminal</strong> fuel<br />
demands. At the current delivery rate (22,000 gph), KCI fuel consumption could<br />
increase to 300,000 gallons per day (GDP) and still be below a 14-hour batch<br />
delivery. The coalescer filters and clay treater flow rates are rated for 800 gpm<br />
which exceeds the current delivery rate (367 gpm).<br />
6.3.2 HYDRANT FUELING BRIDGING CONCEPT ANALYSIS<br />
No new hydrant distribution mains are needed to meet the estimated peak flow rate<br />
for the New <strong>Terminal</strong>. Figure 6.3-1, Existing Fuel Site Plan, shows the existing<br />
fuel distribution mains. However, alterations to the existing mains will be needed<br />
for the proposed New <strong>Terminal</strong>.<br />
Phasing Plan for Construction: A fuel system phasing plan will need to be prepared<br />
to maintain airport operations during construction of the proposed New <strong>Terminal</strong>.<br />
DRAFT<br />
Fuel Back Feed: During construction of the New <strong>Terminal</strong>, one 18-inch hydrant<br />
main line will need to be installed on “landside,” out of the New <strong>Terminal</strong> work area<br />
as shown in Figure 6.3-2, Hydrant Distribution Plan Temporary <strong>Terminal</strong> B<br />
and C Fueling, to maintain fuel supply to <strong>Terminal</strong>s B and C and provide an<br />
independent supply to the south end of the New <strong>Terminal</strong> to improve system<br />
reliability. In addition, two new 16-inch hydrant lines will need to be installed to<br />
the north side of the new terminal. The 18-inch and two 16-inch lines will provide<br />
peak flow in two separate directions, meet the fuel demands of the new terminal,<br />
and provide back feed capability. Refer to Figure 6.3-3, Hydrant Distribution<br />
Plan – New <strong>Terminal</strong> Fueling, for more information. High-point vent (HPV) and<br />
low-point drain (LPD) pits will be installed throughout the system. It is assumed<br />
that Cathodic protection will be the sacrificial anode type and leak detection will be<br />
provided with the Hansa Consult portable type system which is currently in use.<br />
Landrum & Brown Page 198<br />
April 2013
KANSAS CITY NEW TERMINAL STUDY PROGRAM CRITERIA DOCUMENT<br />
ADVANCE TERMINAL PLANNING STUDY DRAFT<br />
Landrum & Brown Page 199<br />
April 2013<br />
Figure 6.3-1<br />
EXISTING FUEL SITE PLAN<br />
DRAFT<br />
Source: HNTB
KANSAS CITY NEW TERMINAL STUDY PROGRAM CRITERIA DOCUMENT<br />
ADVANCE TERMINAL PLANNING STUDY DRAFT<br />
Landrum & Brown Page 200<br />
April 2013<br />
Figure 6.3-2<br />
HYDRANT DISTRIBUTION PLAN TEMPORARY TERMINAL B AND C FUELING<br />
DRAFT<br />
Source: HNTB
KANSAS CITY NEW TERMINAL STUDY PROGRAM CRITERIA DOCUMENT<br />
ADVANCE TERMINAL PLANNING STUDY DRAFT<br />
Landrum & Brown Page 201<br />
April 2013<br />
Figure 6.3-3<br />
HYDRANT DISTRIBUTION PLAN – NEW TERMINAL FUELING<br />
DRAFT<br />
Source: HNTB
KANSAS CITY NEW TERMINAL STUDY<br />
ADVANCE TERMINAL PLANNING STUDY<br />
PROGRAM CRITERIA DOCUMENT<br />
DRAFT<br />
New Hydrant Distribution: The ADG III gates will include one hydrant pit located<br />
within 10 feet of the right aircraft wing fuel tank and behind the engine. ADG V flex<br />
gates will include one hydrant pit under each aircraft wing within ten feet of the fuel<br />
tank point of connection and behind the engine. Hydrant pit branch lines will<br />
alternate connections between the two 16-inch mains. Isolation valve vaults will be<br />
located to segregate the fuel pits into four main groups. Each vault will contain<br />
motor operated (MOV) double-block and bleed valves that are tied into the<br />
Emergency Fuel Shut-Off (EFSO) system. Upon activation of an EFSO button, the<br />
respective valves will isolate fuel to that group of hydrant pits. Exhibit F-3, Hydrant<br />
Distribution Plan – New <strong>Terminal</strong> Fueling, shows the locations of the new hydrant<br />
pits and valve vaults.<br />
6.3.1.1 Truck Fueling/Staging Facility Needs<br />
The fuel farm consists of one tanker truck/refueler load/offload position with a fuel<br />
flow rate equal to 1600 to 2000 gpm. Space and pipe connections are available to<br />
install one airport refueler load/offload station. No additional truck fueling or<br />
staging facility requirements is needed. Figure 6.3-4, Plan-Fuel Storage<br />
Expansion, shows the fuel farm layout with provisions for the future truck<br />
transportation refueler load/offload station and fuel tanks.<br />
Figure 6.3-4<br />
PLAN-FUEL STORAGE EXPANSION<br />
DRAFT<br />
Source:<br />
HNTB<br />
Landrum & Brown Page 202<br />
April 2013
KANSAS CITY NEW TERMINAL STUDY<br />
ADVANCE TERMINAL PLANNING STUDY<br />
PROGRAM CRITERIA DOCUMENT<br />
DRAFT<br />
6.3.1.2 Commercial Vehicle Staging and Delivery Layout<br />
The fuel farm is located to the north of the airport on Brasilia Avenue and Bern<br />
Street. The fuel farm control building has a parking lot capacity for 35 vehicles.<br />
Commercial vehicles stage at the fuel farm to make deliveries. No additional<br />
commercial vehicle staging is needed.<br />
6.3.1.3 Aviation Fueling Power and Communications<br />
Control valve vaults will be equipped with motor-operated double block and bleed<br />
plug valves, vault float switch for water/hydrocarbon detection, low and high flow<br />
terminal control valves, and fuel shutoff capability. This protocol will be followed<br />
for each of the new control valve vaults installed on the KCI airfield.<br />
The permanent valve control connectivity and power for all vault electrical<br />
equipment will be supplied from two dedicated Fuel Control Rooms at ramp level in<br />
the New <strong>Terminal</strong>. Each control valve vault will receive 208V power from the<br />
nearby apron level electrical rooms within the terminal. See Figure 6.3-5,<br />
<strong>Terminal</strong> Electrical & Telecomm Room Floor Plan, for locations. The alarm<br />
and controls for the valve vaults will connect back to the MDF through EFSO Control<br />
Panels via nearby apron level IDF rooms. See Figure 6.3-5, <strong>Terminal</strong> Electrical &<br />
Telecomm Room Floor Plan, for IDF and MDF room locations. In addition,<br />
connections will be made for full system monitoring at the Airport Fuel Farm.<br />
Emergency fuel shutoff pushbutton stations will be located in the vicinity of each<br />
aircraft gate. When activated, the EFSO station will stop the flow of fuel on that<br />
group of hydrant pits. Fuel flow shutdown will be accomplished by closing<br />
motor-operated valves in the associated control valve vault. Each EFSO pushbutton<br />
station will receive 120V power from the nearby apron level electrical rooms within<br />
the terminal. See Figure 6.3-5, <strong>Terminal</strong> Electrical & Telecomm Room Floor Plan,<br />
for locations. The alarm and controls for the various EFSO push button stations will<br />
connect from the EFSO push button station through a zone monitor card, located<br />
within three different EFSO control panels. The control panels will then<br />
communicate to their respective control valve vaults via an EFSO surge suppressor<br />
panel. The EFSO Control panels will be located on the exterior of the New <strong>Terminal</strong>,<br />
on the north, south and west. EFSO push button stations will be located at each<br />
gate.<br />
DRAFT<br />
Landrum & Brown Page 203<br />
April 2013
KANSAS CITY NEW TERMINAL STUDY<br />
ADVANCE TERMINAL PLANNING STUDY<br />
PROGRAM CRITERIA DOCUMENT<br />
DRAFT<br />
Figure 6.3-5<br />
TERMINAL ELECTRICAL & TELECOMM ROOM FLOOR PLAN<br />
Source:<br />
HNTB<br />
6.3.2 AIRFIELD DRAINAGE<br />
DRAFT<br />
The purpose of the apron drainage system is to capture stormwater runoff from the<br />
entire apron area, as well as intercept existing storm drainage pipes within the new<br />
apron limits, and convey it to the existing drainage basins.<br />
Any glycol-contaminated runoff will be collected and diverted to above ground<br />
storage tanks.<br />
The proposed terminal apron and associated taxilanes will drain by sheet flow to<br />
drainage structures constructed with the apron pavement. The New <strong>Terminal</strong><br />
configuration will result in a swale between the concourses and area inlets will be<br />
installed in the swales. The apron will also be graded in such a manner to isolate<br />
the centralized deicing pads and reduce the drainage area required to capture the<br />
glycol-contaminated runoff.<br />
The stormwater collection system for the terminal apron is designed for two<br />
separate systems: “clean” and “glycol contaminated” runoff. The “clean” runoff<br />
collection system is designed to intercept flows from normal rainfall events.<br />
This storm water is routed to the existing detention basin south of the Berlin<br />
Reservoir. The “clean” runoff collection system is denoted in Figure 6.3-6, Storm<br />
Drainage System.<br />
Landrum & Brown Page 204<br />
April 2013
KANSAS CITY NEW TERMINAL STUDY<br />
ADVANCE TERMINAL PLANNING STUDY<br />
PROGRAM CRITERIA DOCUMENT<br />
DRAFT<br />
Figure 6.3-6<br />
STORM DRAINAGE SYSTEM<br />
Source:<br />
HNTB<br />
DRAFT<br />
New trench drains located behind the aircraft parking positions at the terminal will<br />
collect stormwater runoff from areas where aircraft fueling operations are<br />
conducted and minimal gate deicing operations may occur. This is a high risk area<br />
for grease and oil pollutants.<br />
In an effort to improve water quality, the first flush (0.2 inch/hour rainfall) from the<br />
contamination high risk areas, those areas between the terminal and the trench<br />
drain, will be routed through oil/water separation devices prior to discharge into the<br />
storm sewer collection trunk lines. The oil/water separators are designed to reduce<br />
the grease and oil pollutant load to meet the permit requirements for the Kansas<br />
City International Airport.<br />
Periodic maintenance is required for the oil/water separators. As the oil level<br />
increases, the oil must be removed, typically with a vacuum truck. If the oil is not<br />
removed, the separation function will cease. Since the separators are located<br />
within the secure area, their maintenance will have to be coordinated with KCAD<br />
operations and maintenance personnel.<br />
Landrum & Brown Page 205<br />
April 2013
KANSAS CITY NEW TERMINAL STUDY<br />
ADVANCE TERMINAL PLANNING STUDY<br />
PROGRAM CRITERIA DOCUMENT<br />
DRAFT<br />
Runoff from the taxilane portions of the apron, as well as from the centralized<br />
deicing pad, is not considered to be at high risk of containing grease and oil<br />
pollutants and will not pass through any oil water separation devices. Stormwater<br />
runoff in these areas is collected by a series of area inlets. The area inlets are<br />
connected by a series of pipes. The “clean” runoff may be conveyed in reinforced<br />
concrete pipes or other structures designed to withstand aircraft loadings.<br />
The “clean” runoff collected around the terminal will be conveyed to a trunk line<br />
located on the north side of the terminal. This trunk line will ultimately convey all<br />
“clean” storm water runoff to the existing detention basin and ultimately to the<br />
Berlin Reservoir.<br />
At this time all pipes are anticipated to gravity flow.<br />
6.3.3 GLYCOL COLLECTION AND STORAGE<br />
Collection of glycol-contaminated runoff begins with reducing the area of the<br />
application of deicing fluids, grading the area to collect the entirety of the deicing<br />
pad(s) and incorporating collection areas and pipe networks to convey the<br />
contaminated runoff to a retention facility for ultimate treatment or disposal.<br />
Figure 6.3-7, Glycol Collection System depicts the glycol-contaminated runoff<br />
collection and storage system.<br />
Figure 6.3-7<br />
GLYCOL COLLECTION SYSTEM<br />
DRAFT<br />
Source:<br />
HNTB<br />
Landrum & Brown Page 206<br />
April 2013
KANSAS CITY NEW TERMINAL STUDY<br />
ADVANCE TERMINAL PLANNING STUDY<br />
PROGRAM CRITERIA DOCUMENT<br />
DRAFT<br />
Area inlets will be installed within the centralized deicing area to collect runoff.<br />
The inlets will be connected by HDPE (or similar) pipes and flow to the glycol trunk<br />
line. A diversion manhole will be installed at the beginning of each pipe located<br />
within a deicing pas. During deicing conditions, the runoff will flow to the glycol<br />
collection trunk line. During normal rainfall events, the runoff will be diverted to<br />
the “clean” runoff pipes.<br />
The pipes conveying runoff contaminated with deicing fluids should be high density<br />
polyethylene (HDPE) pipes (or similar materials) to avoid damage caused by the<br />
corrosive properties of the glycol fluids. Valves and manholes that are not<br />
susceptible to damage by glycol fluids shall be specified as well.<br />
Glycol-contaminated runoff will flow from the deicing pads to a dedicated glycol<br />
trunk line to above ground storage tanks located north of the terminal apron along<br />
Mexico City Avenue. The existing above ground storage tank adjacent to Paris<br />
Street may remain during the initial construction. This tank collects the<br />
glycol-contaminated runoff from the cargo and general aviation aprons. Once the<br />
ultimate apron is constructed, this tank will require relocation to the proposed tank<br />
location.<br />
It has not been determined how to dispose of the highly concentrated glycol runoff<br />
once they have been conveyed to the storage tanks. Runoff with high<br />
concentrations of glycols has been shipped to the wastewater treatment facility via<br />
truck for disposal, but there are more alternatives to repurpose the glycol fluids<br />
that could be a benefit to the environment, but also provide economic advantages<br />
to the KCAD.<br />
DRAFT<br />
Landrum & Brown Page 207<br />
April 2013
KANSAS CITY NEW TERMINAL STUDY<br />
ADVANCE TERMINAL PLANNING STUDY<br />
PROGRAM CRITERIA DOCUMENT<br />
DRAFT<br />
Figure 6.3-8, Combined Drainage Infrastructure, provides an overview of the<br />
combined drainage systems to understand how the two systems will operate.<br />
The glycol collection system will only be operable when the diversion manholes<br />
within a set of deicing pads are set to allow discharge to the glycol collection<br />
system.<br />
Figure 6.3-8<br />
COMBINED DRAINAGE INFRASTRUCTURE<br />
Source: HNTB<br />
DRAFT<br />
Landrum & Brown Page 208<br />
April 2013
KANSAS CITY NEW TERMINAL STUDY<br />
ADVANCE TERMINAL PLANNING STUDY<br />
PROGRAM CRITERIA DOCUMENT<br />
DRAFT<br />
6.3.4 DEICING SUPPORT FACILITIES<br />
Aircraft deicing will be conducted by a third party vendor once the new terminal is<br />
in operation. The development of a centralized location for management of the<br />
deicing operations is proposed north of the terminal apron, yet within close<br />
proximity to the deicing pads. The proposed location is shown in Figure 6.3-9,<br />
Glycol Support Facilities.<br />
Figure 6.3-9<br />
GLYCOL SUPPORT FACILITIES<br />
Source: HNTB<br />
DRAFT<br />
Landrum & Brown Page 209<br />
April 2013
KANSAS CITY NEW TERMINAL STUDY<br />
ADVANCE TERMINAL PLANNING STUDY<br />
PROGRAM CRITERIA DOCUMENT<br />
DRAFT<br />
This location shown in Figure 6.3-9, Glycol Support Facilities, is west of Mexico City<br />
Avenue. The facility should be centered on the existing AOA security fence to<br />
minimize unwarranted access to the AOA. At this location glycol vehicles will be<br />
maintained and loaded with deicing fluids. The support facilities include an<br />
administration building for management of the glycol operations and driver training.<br />
Parking for employees is located east of the security fence.<br />
Also on the landside is an access road for the delivery of glycol fluids. Delivery<br />
vehicles will remain outside the fence. Glycol fluids will be unloaded into storage<br />
tanks located within the AOA security fence. In addition to the glycol storage<br />
tanks, water hydrants will be installed to complete the glycol blending process prior<br />
to aircraft deicing application.<br />
A staging area for loading water and glycol fluid onto the deicing vehicles is<br />
depicted within the security fence so these vehicles are not required to leave the<br />
AOA at any time. Within the fence is a maintenance facility to repair and store<br />
deicing vehicles.<br />
Deicing vehicles will access the deicing pads via the proposed new service road.<br />
The service road will extend west from the staging area to Ottawa Avenue.<br />
6.3.5 AIRFIELD LIGHTING<br />
The proposed lighting system is based on the current apron and taxiway<br />
configuration described in Section 6.1. A detailed signage and lighting plan will be<br />
developed during the final design phase of the project.<br />
DRAFT<br />
The taxiway lighting system should provide a centerline lighting layout and circuitry<br />
to connect into the existing Taxiway A and Taxiway B centerline lights. Taxiway<br />
centerline lights should emit a steady burning green light with applicable variable<br />
intensity to match the existing taxiway centerline lighting system.<br />
Elevated taxiway edge lights will be installed in the paved shoulders adjacent to the<br />
terminal apron and Taxiways A and B. Taxiway edge lights should emit a steady<br />
burning blue light with applicable variable intensity to match the existing taxiway<br />
centerline lighting system.<br />
The current terminal aprons do not have centerline lighting. A taxilane centerline<br />
lighting layout and circuitry to delineate the taxilanes on the apron should be<br />
installed.<br />
Landrum & Brown Page 210<br />
April 2013
KANSAS CITY NEW TERMINAL STUDY<br />
ADVANCE TERMINAL PLANNING STUDY<br />
PROGRAM CRITERIA DOCUMENT<br />
DRAFT<br />
6.3.6 AIRFIELD LIGHTING VAULT<br />
The Existing Airfield Lighting Vault, and adjacent Airfield Lighting Power and<br />
Communications Manholes 1, 2, 3, and 4 will be left in place and protected. The<br />
Airfield Lighting Power and Communications Manholes and duct bank serving the<br />
North Airfield between existing manholes AP-1/AC-1 and AP-4/AC-4 will have to be<br />
relocated prior to demolition. A new 9w4-inch power duct bank and 2w4-inch<br />
communications duct bank will be installed around the new terminal and parking<br />
garage construction area. Refer to Figure 6.3-10, Proposed Electrical Site<br />
Plan, Figure 6.3-11, Existing Airfield Electrical Site Plan, and Figure 6.3-12,<br />
Proposed Airfield Electrical Site Plan, for proposed design details.<br />
Figure 6.3-10<br />
PROPOSED ELECTRICAL SITE PLAN<br />
Source: HNTB<br />
DRAFT<br />
Landrum & Brown Page 211<br />
April 2013
KANSAS CITY NEW TERMINAL STUDY PROGRAM CRITERIA DOCUMENT<br />
ADVANCE TERMINAL PLANNING STUDY DRAFT<br />
Landrum & Brown Page 212<br />
April 2013<br />
Figure 6.3-11<br />
EXISTING AIRFIELD ELECTRICAL SITE PLAN<br />
DRAFT<br />
Source: HNTB
KANSAS CITY NEW TERMINAL STUDY PROGRAM CRITERIA DOCUMENT<br />
ADVANCE TERMINAL PLANNING STUDY DRAFT<br />
Landrum & Brown Page 213<br />
April 2013<br />
Figure 6.3-12<br />
PROPOSED AIRFIELD ELECTRICAL SITE PLAN<br />
DRAFT<br />
Source: HNTB
KANSAS CITY NEW TERMINAL STUDY<br />
ADVANCE TERMINAL PLANNING STUDY<br />
PROGRAM CRITERIA DOCUMENT<br />
DRAFT<br />
Cut-overs for all airfield lighting circuits will be done during airfield operations<br />
off-hours between the hours of 1:00 a.m. and 5:00 am, or in conjunction with<br />
scheduled Airfield Operations and maintenance shutdowns.<br />
For the Preferred Alternative, the existing (2) 1.5MW emergency generators in the<br />
CUP maintenance yard, will be relocated just North of the existing airfield electrical<br />
vault. All power feeds will be reconnected to existing 2000KVA, 4.16kV – 480/277V<br />
Stand-by Service Transformer, located at the southeast corner of the existing<br />
airfield lighting vault. In addition the KCP&L service transformer for the airfield<br />
lighting vault will have to be relocated as shown in Figure 6.3-13, Electrical<br />
Lighting Vault Plan, and Figure 6.3-14, Proposed Airfield Electrical Site<br />
Plan.<br />
Figure 6.3-13<br />
ELECTRICAL LIGHTING VAULT PLAN<br />
DRAFT<br />
Source:<br />
HNTB<br />
6.4 FAA Navigational Aids<br />
The existing navigational aids at KCI will not be impacted by the construction of the<br />
new terminal and associated airfield pavements. During design, a study will be<br />
conducted to determine the location of buried cables, within the construction limits,<br />
that must be protected to maintain the operation of all navigational aids.<br />
Landrum & Brown Page 214<br />
April 2013
KANSAS CITY NEW TERMINAL STUDY PROGRAM CRITERIA DOCUMENT<br />
ADVANCE TERMINAL PLANNING STUDY DRAFT<br />
Landrum & Brown Page 215<br />
April 2013<br />
Figure 6.3-14<br />
PROPOSED AIRFIELD ELECTRICAL SITE PLAN<br />
DRAFT<br />
Source: HNTB
KANSAS CITY NEW TERMINAL STUDY<br />
ADVANCE TERMINAL PLANNING STUDY<br />
PROGRAM CRITERIA DOCUMENT<br />
DRAFT<br />
7. REFINE CONCEPTUAL TERMINAL BUILDING PLANS<br />
7.1 Conceptual <strong>Terminal</strong> and Concourse Plans<br />
7.1.1 CONCEPTUAL ALTERNATIVES AND OPTIONS<br />
The following three alternatives were developed for the <strong>Terminal</strong> A site, each of<br />
which are different in the way vehicles would approach and use the new terminal.<br />
Passenger experience is also unique in each alternative by requiring different levels<br />
of navigation from the drop-off curb to the security screening checkpoint.<br />
<br />
<br />
<br />
Alternative 1a and 1b: This alternative provides a traditional approach to the<br />
new terminal with the curbside drop-off and pick-up lanes of arriving and<br />
departing passengers have been separated on an upper and lower deck. The<br />
curbside lanes would run along the length of the main terminal entrance. To<br />
reduce congestion at the curbside lanes, commercial vehicles would use a<br />
separate route which is located in the parking garage structure and is aligned<br />
with the main gate level of the terminal. With this arrangement all<br />
passengers using the surface parking lot within International Circle, the<br />
parking garage, and commercial vehicle plaza would consolidate at the plaza<br />
in a conditioned space and enter the terminal at the gate level which would<br />
be located between the arriving and departing vehicular traffic.<br />
Whereas most terminals are arranged with departing passengers on the top<br />
level and arriving passengers at the bottom, Alternative 1a reverses this<br />
trend and has placed the arriving passengers at the top level. This<br />
arrangement would welcome all arriving passengers to Kansas City as they<br />
proceed from the gate level up to a grandiose baggage claim hall flooded<br />
with natural light and views out to the landscape of the Kansas City area. As<br />
a matter of concern, the traditional arrangement of arriving passengers<br />
located on the bottom level has been examined in Alternative 1b.<br />
DRAFT<br />
Alternative 2: This alternative would divide the main terminal processor into<br />
two terminals, which would allow a major airline to use as an exclusive<br />
terminal, if desired. The two terminals would share a common commercial<br />
vehicle plaza, but parking garages would have to be separated in this<br />
configuration. This arrangement of roadways and a commercial vehicle plaza<br />
would allow the main terminal processor to be two levels instead of three.<br />
Alternative 3: This alternative, while similar to Alternative 1a, would move<br />
the commercial vehicle plaza from the parking structure to the back side of<br />
the terminal processor. The major advantage to this alternative is that it<br />
places commercial traffic closer to the main terminal entrance.<br />
Landrum & Brown Page 216<br />
April 2013
KANSAS CITY NEW TERMINAL STUDY<br />
ADVANCE TERMINAL PLANNING STUDY<br />
PROGRAM CRITERIA DOCUMENT<br />
DRAFT<br />
The layout of the conceptual terminal building at KCI is driven by airside and<br />
landside activities on a variety of levels. The airside activities (concourse,<br />
holdroom/gates) generally occur within the <strong>Terminal</strong> Concourse and landside<br />
activities (ticketing, security screening, and baggage claim) generally occur within<br />
the <strong>Terminal</strong> Processor as shown in Figure 7.1-1, Concept Diagram: <strong>Terminal</strong><br />
Processor and <strong>Terminal</strong> Concourse).<br />
Figure 7.1-1<br />
CONCEPT DIAGRAM: TERMINAL PROCESSOR AND TERMINAL CONCOURSE<br />
Source:<br />
L&B and Wellner Architects<br />
DRAFT<br />
Within the boundaries of the airfield and based on required setbacks and efficient<br />
aircraft circulation, the concourse layout has been defined as a bent ‘H’<br />
configuration. This configuration was defined early on in the study and was refined<br />
only slightly as the plans developed. Each of the terminal processor alternatives<br />
were combined with the typical ‘H’ configuration concourse layout and then<br />
modified as needed to meet the program requirements.<br />
When considering the layout of the terminal and site-wide components including<br />
vehicular traffic patterns and public parking, passenger convenience is important.<br />
Convenience factors include reducing passenger travel distance/time (from vehicle<br />
to departure gate), safety from other vehicles (cross traffic flows), protection from<br />
weather (rain, snow, etc.), and ease of navigation (traffic patterns and signage).<br />
Landrum & Brown Page 217<br />
April 2013
KANSAS CITY NEW TERMINAL STUDY<br />
ADVANCE TERMINAL PLANNING STUDY<br />
PROGRAM CRITERIA DOCUMENT<br />
DRAFT<br />
7.1.2 CONCEPTUAL CONCOURSE SPACE ALLOCATION<br />
Apron Level 01<br />
The conceptual concourse consists of two levels, an Apron Level and a Gate Level.<br />
A partial third level is required for the U.S. Customs and Border Patrol (CBP)<br />
services and other functions that would be located adjacent to the Baggage Claim<br />
Hall on a third level of the <strong>Terminal</strong> Processor. An example of general space<br />
allocation can be seen in Figure 7.1-2, Conceptual Apron Level – <strong>Terminal</strong><br />
Concourse.<br />
Figure 7.1-2<br />
CONCEPTUAL APRON LEVEL – TERMINAL CONCOURSE<br />
DRAFT<br />
Source:<br />
L&B and Wellner Architects<br />
The conceptual terminal Apron Level is similar in function to the existing terminals<br />
at KCI. Space on the Apron Level would include non-public functions such as<br />
baggage handling; airline operation; concession support; security; and mechanical,<br />
electrical, and trash collection/disposal rooms. The Apron Level would be served by<br />
a central circulation corridor, approximately eleven feet wide, which is sufficient to<br />
handle pedestrian traffic and delivery or service vehicles such as electric powered<br />
utility carts. The Apron level would be intersected by three apron cross-through<br />
drives, each 20 feet wide, that are required for efficient operation of tugs and other<br />
support vehicles which utilize the apron.<br />
Landrum & Brown Page 218<br />
April 2013
KANSAS CITY NEW TERMINAL STUDY<br />
ADVANCE TERMINAL PLANNING STUDY<br />
PROGRAM CRITERIA DOCUMENT<br />
DRAFT<br />
Vertical circulation cores have been placed along the main service corridor at<br />
locations that would allow back-of-house service to most of the retail spaces on the<br />
Gate Level. The circulation cores would also serve as public egress paths from the<br />
Gate Level above for both fire and hazardous weather events. Adjacent to each<br />
vertical circulation core would be retail support storage rooms where goods will be<br />
delivered and stored until the vendors move up to the Gate level.<br />
Outbound baggage handling rooms are central to the Apron Level layout. Bags are<br />
received from the TSA checked baggage screening room which is also located on<br />
the apron level within the boundaries of the terminal processor. The inbound<br />
baggage handling rooms are located closer to the terminal processor to minimize<br />
belt runs to the baggage claim hall.<br />
Mechanical rooms, which serve all levels of the terminal, are distributed throughout<br />
the Apron Level of the concourse. The balance of space is utilized for Airline<br />
Operations along with approximately 6,000 square feet to be used for Airport<br />
Operations<br />
Gate Level 02<br />
Located 13.5 feet above the Apron Level, the Gate Level of the concourse would<br />
provide passenger holdroom space for each gate, food and retail concessions,<br />
public restrooms, vertical circulation cores, and other airport function spaces.<br />
These other airport function spaces would be located along the perimeter of the<br />
concourse and would typically be contained within a thirty-foot deep structural bay<br />
module. All of these spaces would be served by a central circulation spine with<br />
moving walkways. As illustrated in Figure 7.1-3, Typical Gate Level – <strong>Terminal</strong><br />
Concourse, the corridors would be double loaded along the main concourse which<br />
would run in an east-west direction and along the north and south wings of the<br />
west corridor. The main corridor width would be sixty feet wide and the west<br />
corridor would be forty-five feet wide. The north and south wings of the east<br />
corridor would be single loaded and thirty feet wide.<br />
DRAFT<br />
The general layout of spaces within the Gate Level of the concourse is defined by<br />
the aircraft parking and the nodular concept of the concessions space. Food and<br />
retail concessions create a synergy of activity when they are grouped together in<br />
nodes instead of being sporadically distributed throughout the terminal. First and<br />
foremost, aircraft parking drives the location of the passenger boarding bridges.<br />
Off of each boarding bridge a holdroom of approximately 2,200 square feet would<br />
be provided. The aircraft parking layout and the resulting gate locations reinforce<br />
the main retail nodes at the intersections of the concourse. Secondary and tertiary<br />
nodes for concessions would be provided further down each concourse wing.<br />
Public restrooms modules that are 900 square feet each would be distributed<br />
throughout the concourse. Maximum passenger travel distance would be no more<br />
than two gate lengths, or approximately 150 feet.<br />
Landrum & Brown Page 219<br />
April 2013
KANSAS CITY NEW TERMINAL STUDY<br />
ADVANCE TERMINAL PLANNING STUDY<br />
PROGRAM CRITERIA DOCUMENT<br />
DRAFT<br />
Figure 7.1-3<br />
TYPICAL GATE LEVEL – TERMINAL CONCOURSE<br />
Source:<br />
L&B and Wellner Architects<br />
Arrival level 03<br />
CBP<br />
DRAFT<br />
The new terminal study requires planning for four international gates and each gate<br />
designated as international must provide sterile corridor access to the CBP services<br />
area. Connecting the gates to the CBP area would be accomplished by access to<br />
the third level shown in Figure 7.1-4, Arrival Level. Each international gate<br />
would contain a vertical circulation core consisting of an elevator and a staircase<br />
leading up to Level 3. The CBP would be located adjacent to the “ Sky Lobby “ hall<br />
and therefore, would provide a direct link for international passengers to exit the<br />
terminal while utilizing the same directional signage for transportation and lodging<br />
services. International passengers with connecting flights would return to the<br />
security screening checkpoint and then proceed to their connecting gate. The<br />
location of the CBP would also be in relatively close proximity to baggage conveyor<br />
systems needed to support the CBP.<br />
Landrum & Brown Page 220<br />
April 2013
KANSAS CITY NEW TERMINAL STUDY<br />
ADVANCE TERMINAL PLANNING STUDY<br />
PROGRAM CRITERIA DOCUMENT<br />
DRAFT<br />
Figure 7.1-4<br />
ARRIVAL LEVEL<br />
This illustration is a preliminary concept drawing and indicates sterile corridors for two international<br />
gates. Refer to Section 7.2 for developed plan showing four international gates.<br />
Source:<br />
L&B and Wellner Architects<br />
Baggage Claim Support<br />
DRAFT<br />
The opposite side of Level 3 would provide space within the concourse but it would<br />
be accessed from the Baggage Claim Hall. This area would include space for retail,<br />
baggage service offices, public restrooms, miscellaneous tenants, and facility<br />
support.<br />
7.1.3 CONCEPTUAL ALTERNATIVES 1A AND 1B<br />
A traditional vehicular approach was considered for this alternative. Traditional, in<br />
this definition, would require splitting the arrival and departure vehicular traffic<br />
onto separate levels, one on top of the other, in a counter-clockwise flow.<br />
In Alternative 1a the arrivals traffic is on top and the departures traffic is<br />
underneath. Conversely, in Alternative 1b, the Departures traffic is on top and the<br />
Arrivals traffic is underneath. It was further defined, that Commercial vehicular<br />
traffic would be separated to help relieve congestion at the curbside.<br />
All Commercial traffic except departure taxis and limousines would flow through the<br />
Landrum & Brown Page 221<br />
April 2013
KANSAS CITY NEW TERMINAL STUDY<br />
ADVANCE TERMINAL PLANNING STUDY<br />
PROGRAM CRITERIA DOCUMENT<br />
DRAFT<br />
Level 5 of the parking garage which would be located midway between the Arrival<br />
and Departures level of the <strong>Terminal</strong> Building. Pedestrian traffic from the<br />
commercial vehicles and the parking garage would be consolidated at Level 5 of the<br />
parking garage and then proceed in an enclosed and air conditioned and heated<br />
walkway across the roadway and into the terminal on the main gate level of the<br />
terminal. See Figure 7.1-5, Alternative 1A, Level 01 – Departures.<br />
Figure 7.1-5<br />
ALTERNATIVE 1A, LEVEL 01 – DEPARTURES<br />
Source:<br />
L&B and Wellner Architects<br />
DRAFT<br />
Departing passengers that are being dropped off in private vehicles will enter the<br />
terminal at this level which is ten feet lower than the concourse apron level.<br />
Four curbside baggage check positions will be distributed along the entrance.<br />
Passengers can either check their bags or enter into the terminal and then proceed<br />
up one level to the Gate Level. Besides public restrooms, this is the only public<br />
function of the Apron Level. Behind the public circulation corridor is space for nonairline<br />
tenants. Entrance for these tenants is from the public circulation corridor.<br />
All other functions within the terminal processor except the central mechanical<br />
space will be elevated 10 feet to match up the concourse apron level.<br />
Delivery support for concessions will be located on the right side of the floor plan.<br />
The space includes a dock for deliveries and a temporary processing and storage<br />
area that will be located adjacent to the main circulation of the apron concourse<br />
level. On the opposite (left side of the plan) will be delivery and access for building<br />
support services such as maintenance, shop, and storage as needed for terminal<br />
functions. In the center will be TSA space for checked baggage screening, office,<br />
and break room.<br />
Landrum & Brown Page 222<br />
April 2013
KANSAS CITY NEW TERMINAL STUDY<br />
ADVANCE TERMINAL PLANNING STUDY<br />
PROGRAM CRITERIA DOCUMENT<br />
DRAFT<br />
Entrance to the Gate level will be from conditioned bridges that span over the<br />
departure traffic below and will be connected to the parking garage at the<br />
commercial vehicle plaza level (Level 5). Passengers will also access the Gate level<br />
from the upper departures level lobby using stairs, escalators, or elevators.<br />
As shown in Figure 7.1-6, Alternative 1a, Level 02 – Gates, the lobby of the<br />
gate level will include vertical circulation connecting the levels above and below,<br />
ticketing for domestic and international flights, public restrooms, retail, and a main<br />
entrance into the security screening checkpoint queuing area.<br />
Figure 7.1-6<br />
ALTERNATIVE 1A, LEVEL 02 – GATES<br />
Source:<br />
L&B and Wellner Architects<br />
DRAFT<br />
This up-front approach for the security screening checkpoint will allow passengers<br />
with boarding passes to have quick and direct access from the terminal entrance.<br />
From that point, screened passengers will proceed directly into the main node of<br />
the terminal concourse. Working outwards from the security checkpoint entrance<br />
will be retail space so that all passengers have close visual contact with some retail<br />
before entering the checkpoint. Next will be public restrooms and then ticketing<br />
which will include a 45-foot deep space for kiosks banks and ticket queuing space.<br />
The security screening checkpoint will be flanked on both sides with an exit corridor<br />
for arriving passengers that do not have baggage to claim on the level above.<br />
Those passengers will be able to proceed across the bridge to the parking garage or<br />
go up a level for curbside pick-up.<br />
Behind the ticket counters will be space for Airline Ticket Offices. Other space on<br />
this level will include shafts for baggage conveyors systems that feed the baggage<br />
claim devices, the CBP space, and other support space for terminal functions.<br />
Landrum & Brown Page 223<br />
April 2013
KANSAS CITY NEW TERMINAL STUDY<br />
ADVANCE TERMINAL PLANNING STUDY<br />
PROGRAM CRITERIA DOCUMENT<br />
DRAFT<br />
As shown in Figure 7.1-7, Alternative 1a, Level 03 – Arrival / Baggage<br />
Claim, arriving passengers needing to claim baggage will proceed from the Gate<br />
Level up the vertical circulation (elevators, stairs, and escalators) to the Baggage<br />
Claim Hall located on the third level. There, passengers will pass the<br />
meeter/greeter area before moving to the baggage claim devices. The claim hall<br />
will include concessions, public restrooms, baggage service offices, and space for<br />
other tenants. All of these support spaces will be distributed along the back<br />
concourse which allows an open view to the curbside. Arriving passengers will then<br />
exit the terminal for curbside pick-up or proceed down to Level 2 and across the<br />
bridge for all other transportation options.<br />
Figure 7.1-7<br />
ALTERNATIVE 1A, LEVEL 03 – ARRIVAL / BAGGAGE CLAIM<br />
Source:<br />
L&B and Wellner Architects<br />
DRAFT<br />
Landrum & Brown Page 224<br />
April 2013
KANSAS CITY NEW TERMINAL STUDY<br />
ADVANCE TERMINAL PLANNING STUDY<br />
PROGRAM CRITERIA DOCUMENT<br />
DRAFT<br />
The conceptual section will be cut through the middle of the building spline, starting<br />
at the parking structure shown on the left side, through the roadways, into the<br />
terminal processor, and then terminating at the beginning of the main concourse.<br />
The section illustrates that 23.5 feet will be needed between the departure curb and<br />
the gate level bridge leading to the garage in order to accommodate vehicular<br />
traffic, pedestrian bridge structure, and depth within the bridge structure needed to<br />
contain baggage conveyance systems. The distance between the apron and gate<br />
level of 13.5 feet will be determined by the greatest dimension allowed such that<br />
the slope of the boarding bridges when docked with aircrafts does not exceed the<br />
ADA ramp standards. The distance between the Apron and Gate level at the<br />
existing KCI terminal is 13.0 feet. See Figure 7.1-8, Alternative 1a, Conceptual<br />
Section Through Parking Garage, Roadway, Processor And Concourse.<br />
An optional tunnel from Level 2 of the parking garage leading to the departure<br />
lobby is shown in this illustration but has not been developed or included in refined<br />
building plans.<br />
Figure 7.1-8<br />
ALTERNATIVE 1A, CONCEPTUAL SECTION THROUGH PARKING GARAGE,<br />
ROADWAY, PROCESSOR AND CONCOURSE<br />
DRAFT<br />
Source:<br />
L&B and Wellner Architects<br />
Landrum & Brown Page 225<br />
April 2013
KANSAS CITY NEW TERMINAL STUDY<br />
ADVANCE TERMINAL PLANNING STUDY<br />
PROGRAM CRITERIA DOCUMENT<br />
DRAFT<br />
Alternative 1b<br />
Alternative 1b is the converse of Alternate 1a. In this scheme the Arriving<br />
passenger pick-up and Bag Claim is on the lower level and the Departing<br />
Passengers are dropped off on the upper level. See Figure 7.1-9, Alternative 1b,<br />
Level 01 – Arrival / Baggage Claim.<br />
Arriving passengers needing to claim baggage will proceed from the Gate Level<br />
down the vertical circulation (elevators, stairs, and escalators) to the Baggage<br />
Claim Hall located on the lowest level, 10 feet below the concourse Apron level.<br />
There, passengers will pass the meeter/greeter area before moving to the baggage<br />
claim devices. The claim hall includes concessions, public restrooms, baggage<br />
service offices, and space for other tenants. The loading dock for retail deliveries is<br />
also on this level but is a back-of-house function. All of these support spaces will<br />
be distributed along the back concourse side which allows an open view to the<br />
curbside. Arriving passengers will then exit the terminal for curbside pick-up or<br />
proceed up to Level 2 and across the bridge for all other transportation options.<br />
This layout is very similar to Alternative 1a but with a different structural grid<br />
geometry. Entrance to the Gate level will be from conditioned bridges which span<br />
over the arrival traffic below and connected to the parking garage at the<br />
commercial vehicle plaza level (Level 5). Passengers will also come down from the<br />
departure level (above) using stairs, escalators, or elevators.<br />
Figure 7.1-9<br />
ALTERNATIVE 1B, LEVEL 01 – ARRIVAL / BAGGAGE CLAIM<br />
DRAFT<br />
Source:<br />
L&B and Wellner Architects<br />
Landrum & Brown Page 226<br />
April 2013
KANSAS CITY NEW TERMINAL STUDY<br />
ADVANCE TERMINAL PLANNING STUDY<br />
PROGRAM CRITERIA DOCUMENT<br />
DRAFT<br />
The entrance lobby of the gate level will include vertical circulation connecting the<br />
levels above (departure drop-off) and below (arrivals), ticketing for domestic and<br />
international flights, public restrooms, retail, and a prominent entrance into the<br />
security screening checkpoint queuing area.<br />
This up-front approach for the security screening checkpoint will allow passengers<br />
with boarding passes to have quick and direct access from the terminal entrance.<br />
From that point, screened passengers will proceed directly into the main node of<br />
the terminal concourse. Working outwards from the security checkpoint entrance<br />
will be retail space so that all passengers have close visual contact with some retail<br />
before entering the checkpoint. Next will be public restrooms and then ticketing<br />
which will include a 45-foot deep space for kiosks banks, and ticket queuing space.<br />
The security screening checkpoint will be flanked on both sides with an exit corridor<br />
for arriving passengers that do not have baggage to claim on the level below.<br />
Those passengers will either proceed across the bridge to the parking garage or go<br />
down to the level below for curbside pick-up.<br />
Behind the ticket counters will be space for Airline Ticket Offices. Other space on<br />
this level will include shafts for baggage conveyor systems which will feed the<br />
baggage claim devices, the CBP space, and other support space for terminal<br />
functions. See Figure 7.1-10, Alternative 1b, Level 02 – Gates.<br />
Figure 7.1-10<br />
ALTERNATIVE 1B, LEVEL 02 – GATES<br />
DRAFT<br />
Source:<br />
L&B and Wellner Architects<br />
Landrum & Brown Page 227<br />
April 2013
KANSAS CITY NEW TERMINAL STUDY<br />
ADVANCE TERMINAL PLANNING STUDY<br />
PROGRAM CRITERIA DOCUMENT<br />
DRAFT<br />
As shown in Figure 7.1-11, Alternative 1b, Level 03 – Departure Level,<br />
departing passengers that are being dropped off in private vehicles will enter the<br />
terminal at this level. Three main entrances will be spaced along the front of the<br />
terminal. Passengers will enter into the main lobby and can either check bags at<br />
this location or proceed down to the gate level below. Walkways at each of the<br />
main entrances will span through the main lobby and lead to space for non-airline<br />
tenants. The center will contain TSA space for checked baggage screening, office,<br />
and break room.<br />
Figure 7.1-11<br />
ALTERNATIVE 1B, LEVEL 03 – DEPARTURE LEVEL<br />
Source:<br />
L&B and Wellner Architects<br />
DRAFT<br />
Landrum & Brown Page 228<br />
April 2013
KANSAS CITY NEW TERMINAL STUDY<br />
ADVANCE TERMINAL PLANNING STUDY<br />
PROGRAM CRITERIA DOCUMENT<br />
DRAFT<br />
The conceptual section is similar to Alternative 1a and will cut through the middle of<br />
the building spline, starting at the parking structure shown on the left side, through<br />
the roadways, into the terminal processor, and then will terminate at the beginning<br />
of the main concourse. The section illustrates that 23.5 feet will be needed<br />
between the arrival curb and the gate level bridge leading to the garage to<br />
accommodate vehicular traffic, pedestrian bridge structure, and depth within the<br />
bridge structure needed to contain baggage conveyance systems. The distance<br />
between the apron and gate level of 13.5 feet will be determined by the greatest<br />
dimension allowed such that the slope of the boarding bridges when docked with<br />
aircrafts do not exceed the ADA ramp standards. See Figure 7.1-12, Alternative<br />
1b, Conceptual Section Through Parking Garage, Roadway, Processor, And<br />
Concourse.<br />
Figure 7.1-12<br />
ALTERNATIVE 1B, CONCEPTUAL SECTION THROUGH PARKING GARAGE,<br />
ROADWAY, PROCESSOR, AND CONCOURSE<br />
Source:<br />
L&B and Wellner Architects<br />
DRAFT<br />
Landrum & Brown Page 229<br />
April 2013
KANSAS CITY NEW TERMINAL STUDY<br />
ADVANCE TERMINAL PLANNING STUDY<br />
PROGRAM CRITERIA DOCUMENT<br />
DRAFT<br />
7.1.4 CONCEPTUAL ALTERNATIVE 2<br />
Another way to approach the terminal processor is to split arrival and departure<br />
vehicular traffic into two separate wings, depending on the airline being used.<br />
In Alternative 2 the commercial vehicles will be separated and utilize a commercial<br />
plaza that is centered between the two-winged processor. This plaza will allow<br />
direct access into the terminal security screening checkpoint without having to<br />
cross roadways or travel through ticketing lobbies if passengers have boarding<br />
passes in hand and will eliminate the “bridge” level shown in Alternative 1.<br />
Departing passengers will be dropped off along two curbside lanes depending on<br />
the airline being used. This level will contain two separate lobby wings containing<br />
the ticket counters, kiosks, public restrooms and retail, and airline ticket offices.<br />
Between the two public lobbies will be space designated for mechanical systems,<br />
baggage handling, and checked baggage screening. Directly above the mechanical<br />
and baggage handling rooms will be the commercial vehicle plaza. Commercial<br />
vehicle passengers that need to use the ticket counter will determine which<br />
terminal wing to enter and then proceed down to the Apron level. Upon entering<br />
either lobby, passengers will check their bags and then proceed towards the<br />
concourse at which point they will circulate up to the gate level and arrive at the<br />
security screening checkpoint. See Figure 7.1-13, Alternative 2, Level 01 –<br />
Departures.<br />
Figure 7.1-13<br />
ALTERNATIVE 2, LEVEL 01 – DEPARTURES<br />
DRAFT<br />
Source:<br />
L&B and Wellner Architects<br />
Landrum & Brown Page 230<br />
April 2013
KANSAS CITY NEW TERMINAL STUDY<br />
ADVANCE TERMINAL PLANNING STUDY<br />
PROGRAM CRITERIA DOCUMENT<br />
DRAFT<br />
Passengers coming up from the departure level below will be at the entrance to the<br />
security screening checkpoint. This is the same location where commercial vehicle<br />
passengers can enter the terminal if they do not need to go to the ticket counter.<br />
Passengers will proceed through the screening checkpoint and on to their assigned<br />
gate.<br />
Arriving passengers will flow through the exit corridors that are flanked on each<br />
side of the security screening checkpoint and then into the Baggage Claim Hall.<br />
From that point the passenger’s baggage will be claimed, if needed, and then will<br />
go on to passenger curbside pickup or the central commercial vehicle plaza located<br />
between the two terminal processor wings. See Figure 7.1-14, Alternative 2,<br />
Level 02 – Arrivals.<br />
Figure 7.1-14<br />
ALTERNATIVE 2, LEVEL 02 – ARRIVALS<br />
DRAFT<br />
Source:<br />
L&B and Wellner Architects<br />
7.1.5 CONCEPTUAL ALTERNATIVE 3<br />
The vehicular approach in Alternative 3 is similar to Alternative 1a. The departure<br />
drop-off traffic will be at the lowest level. The Gate level will be the next level and<br />
enclosed bridges will connect the gate level to the parking garage located across<br />
the roadway. Vehicles will pick up arriving passengers on the third level. The main<br />
difference in this alternative is the <strong>Terminal</strong> Processor will be separated from the<br />
<strong>Terminal</strong> Concourse and all commercial vehicles will drive between the Processor<br />
and Concourse at the arriving passenger (third) level. Departing commercial<br />
Landrum & Brown Page 231<br />
April 2013
KANSAS CITY NEW TERMINAL STUDY<br />
ADVANCE TERMINAL PLANNING STUDY<br />
PROGRAM CRITERIA DOCUMENT<br />
DRAFT<br />
vehicle passengers will enter the terminal and go down to the gate level and then<br />
to the security screening checkpoint, or they can continue down to the departure<br />
level and to the ticket counter. This is the only alternative where the commercial<br />
vehicle lane is not part of a plaza within the parking structure. See Figure 7.1-15,<br />
Alternative 3, Level 01 – Departures / Ticketing.<br />
Figure 7.1-15<br />
ALTERNATIVE 3, LEVEL 01 – DEPARTURES / TICKETING<br />
Source:<br />
L&B and Wellner Architects<br />
DRAFT<br />
Departing passengers that are being dropped off in private vehicles will enter the<br />
terminal at this level. Four curbside baggage check positions will be distributed<br />
along the entrance. Passengers can either check their bags at curbside or enter<br />
into the terminal lobby. At this level the terminal lobby will include ticket counters<br />
and kiosks, retail, public restrooms, and vertical circulation cores serving the levels<br />
above. Behind the ticket counters will be space for airline ticket offices.<br />
The interstitial space between the processor and the concourse will contain the<br />
main mechanical room. It will also contain delivery support for retail which is<br />
located on the right side of the floor plan. The space will include a dock for<br />
deliveries and a temporary processing and storage area that will be located<br />
adjacent to the main circulation of the apron concourse level. On the opposite side<br />
will be delivery and access for building support services such as maintenance, shop,<br />
and storage as needed for terminal functions.<br />
In this alternative shown in Figure 7.1-16, Alternative 2, Level 02 –<br />
Security/Gates, the TSA space for checked baggage screening, office, and break<br />
room will be pushed further into the terminal concourse.<br />
Landrum & Brown Page 232<br />
April 2013
KANSAS CITY NEW TERMINAL STUDY<br />
ADVANCE TERMINAL PLANNING STUDY<br />
PROGRAM CRITERIA DOCUMENT<br />
DRAFT<br />
Figure 7.1-16<br />
ALTERNATIVE 2, LEVEL 02 – SECURITY/GATES<br />
Source:<br />
L&B and Wellner Architects<br />
The entrance to the Gate level will be from conditioned bridges which span over the<br />
departure traffic below, and connected to the parking garage at the commercial<br />
vehicle plaza level (Level 05). Passengers will also access the Gate level from the<br />
lower departure level using stairs, escalators, or elevators.<br />
DRAFT<br />
The entrance lobby of the gate level will include vertical circulation connecting the<br />
levels above (baggage claim) and below (departure drop-off). Adjacent to this<br />
lobby will be the non-airline tenant space. Departing passengers will feed towards<br />
the concourse and directly into the security screening checkpoint. Arriving<br />
passengers will exit the concourse on each side of the screening checkpoint where<br />
they can proceed directly to the parking garage or up to the third level to claim<br />
baggage or use transportation services.<br />
Arriving passengers that come up to Level 3 will do so after passing underneath the<br />
commercial vehicle drive located on the back side of the terminal processor. Upon<br />
entering the third level at the meeter/greeter lobby, arriving passengers can exit to<br />
the commercial vehicle curbside, enter the baggage claim hall, or exit at the<br />
opposite side of the claim hall for non-commercial curbside pick-up.<br />
See Figure 7.1-17, Alternative 3, Level 03 – Arrival / Baggage Claim.<br />
This level will contain commercial vehicle curbside baggage check-in. It will also<br />
contain a baggage service office, retail, public restrooms, and terminal function<br />
space. Although the CBP facility will also be on this level, arriving international<br />
passengers would exit the facility by proceeding down to the gate level and then<br />
exit with other arriving passengers. See Figure 7.1-18, Alternative 3, Section<br />
Diagrams.<br />
Landrum & Brown Page 233<br />
April 2013
KANSAS CITY NEW TERMINAL STUDY<br />
ADVANCE TERMINAL PLANNING STUDY<br />
PROGRAM CRITERIA DOCUMENT<br />
DRAFT<br />
Figure 7.1-17<br />
ALTERNATIVE 3, LEVEL 03 – ARRIVAL / BAGGAGE CLAIM<br />
Source:<br />
L&B and Wellner Architects<br />
Figure 7.1-18<br />
ALTERNATIVE 3, SECTION DIAGRAMS<br />
DRAFT<br />
Source:<br />
L&B and Wellner Architects<br />
Landrum & Brown Page 234<br />
April 2013
KANSAS CITY NEW TERMINAL STUDY<br />
ADVANCE TERMINAL PLANNING STUDY<br />
PROGRAM CRITERIA DOCUMENT<br />
DRAFT<br />
7.2 Refined Alternative 1B Building Plans<br />
Throughout the course of this study the alternatives described in Section 7.1 were<br />
analyzed and ranked against each other. The results led to the decision to refine<br />
Alternative 1B.<br />
7.2.1 LEVEL O1 DEPARTURE<br />
Refinement of the Apron Level Concourse:<br />
During Refinement, an adjustment was made to the aircraft parking layout, which<br />
included among other things, allocation for four international gates shown in<br />
Figure 7.2-1, Refined Alternative 1B Apron Level. Conflicts with aircraft<br />
taxiing at the existing KCI <strong>Terminal</strong> B then led to a slight adjustment in the lengths<br />
of the concourse wings. The south end of the east wing was shortened while the<br />
north end of the east wing was lengthened. The main circulation corridor has been<br />
maintained and the vertical circulation cores which include a stairwell and an<br />
elevator coordinate with the back-of-house retail spaces above.<br />
Space allocated for outbound baggage operations was reduced providing more<br />
space for mechanical rooms and Airport and airline operations. The distribution of<br />
mechanical rooms was reviewed and resized. There are a total of nine mechanical<br />
rooms which each containing two air handling units, chilled water pumps, exhaust<br />
fans, water heater, and air compressor. Vertical shafts from each mechanical room<br />
will be approximately 80 square feet each. The Emergency and Standby Generator<br />
Plant and the Domestic Hot Water Plant are placed at the south end of the east<br />
wing. Approximately 11,000 square feet is occupied by these functions.<br />
DRAFT<br />
Behind the public space of the departure lobby the TSA screening room was reoriented<br />
to accommodate equipment and baggage belt runs required for in-line<br />
baggage screening. TSA space has been provided adjacent to the screening facility<br />
and dedicated vertical circulation feeds into the security screening checkpoint<br />
located on the level above.<br />
Refinement of the Apron Level ”Sky Lobby”:<br />
Escalators, elevators, and stairs within the Sky Lobby of the departures level have<br />
been coordinated with the placement of the entrance vestibules and curbside<br />
baggage check-in podiums. Design Details can be seen in Figure 7.2-2, Refined<br />
Departure Level ”Sky Lobby”.<br />
Landrum & Brown Page 235<br />
April 2013
KANSAS CITY NEW TERMINAL STUDY PROGRAM CRITERIA DOCUMENT<br />
ADVANCE TERMINAL PLANNING STUDY DRAFT<br />
Landrum & Brown Page 236<br />
April 2013<br />
Figure 7.2-1<br />
REFINED ALTERNATIVE 1B APRON LEVEL<br />
DRAFT<br />
Source: L&B and Wellner Architects
KANSAS CITY NEW TERMINAL STUDY<br />
ADVANCE TERMINAL PLANNING STUDY<br />
PROGRAM CRITERIA DOCUMENT<br />
DRAFT<br />
Figure 7.2-2<br />
REFINED DEPARTURE LEVEL ”Sky Lobby”<br />
Source: L&B and Wellner Architects<br />
7.2.2 LEVEL 02 GATES<br />
Refinement of the Gate Level Concourse:<br />
DRAFT<br />
As shown in Figure 7.2-3, Refined Alternate 1B Gate Level, the refinement of<br />
the aircraft parking layout resulted in a slight shortening of the main concourse.<br />
In addition, the south end of the east wing was shortened while the north end of<br />
the east wing was lengthened. The number of moving walkways in the main<br />
corridor was reduced and moved to the center of the spine. Not only does this<br />
allow for better pedestrian flow within the concourse but it moves the walkway pits<br />
out of the outbound baggage handling rooms below and into the ceiling space of<br />
the apron corridor. Vertical circulation down to the baggage claim hall has been<br />
enhanced with the addition of a grand staircase and elevators to supplement the<br />
escalators.<br />
Refinement of the Gate Level Ticket Lobby:<br />
Configuration of the ticket lobby did not change from the preliminary concepts.<br />
Vertical circulation cores were refined and coordinated with the levels above and<br />
below. Behind the ticket counters, shaft space was added for check-in bag belts<br />
that would turn back into the ticket counter back wall and then decline to the ceiling<br />
space of the Apron level. Airline Ticket Office space was adjusted to meet the<br />
program requirements. Design details can be seen in Figure 7.2-4, Refined Gate<br />
Level Ticket Lobby.<br />
Landrum & Brown Page 237<br />
April 2013
KANSAS CITY NEW TERMINAL STUDY PROGRAM CRITERIA DOCUMENT<br />
ADVANCE TERMINAL PLANNING STUDY DRAFT<br />
Landrum & Brown Page 238<br />
April 2013<br />
Figure 7.2-3<br />
REFINED ALTERNATE 1B GATE LEVEL<br />
DRAFT<br />
Source: L&B and Wellner Architects
KANSAS CITY NEW TERMINAL STUDY<br />
ADVANCE TERMINAL PLANNING STUDY<br />
PROGRAM CRITERIA DOCUMENT<br />
DRAFT<br />
Figure 7.2-4<br />
REFINED GATE LEVEL TICKET LOBBY<br />
Source:<br />
L&B and Wellner Architects<br />
DRAFT<br />
Landrum & Brown Page 239<br />
April 2013
KANSAS CITY NEW TERMINAL STUDY<br />
ADVANCE TERMINAL PLANNING STUDY<br />
PROGRAM CRITERIA DOCUMENT<br />
DRAFT<br />
Refinement of the Gate Level Screening Checkpoint Lobby:<br />
Boundaries of the Security Screening Checkpoint were increased slightly and the<br />
configuration of the checkpoint lanes changed slightly. A central passenger exit<br />
corridor was introduced to simplify wayfinding for arriving passengers. Mechanical<br />
shafts from the mechanical room below which are used to feed air to the lobby and<br />
spaces above have been added and are adjacent to the retail space at the entrance<br />
to the security checkpoint. Vertical circulation within the main lobby is refined and<br />
coordinated with the levels above and below. Design details can be seen in<br />
Figure 7.2-5, Refined Gate Level Screening Checkpoint Lobby.<br />
7.2.3 LEVEL 01 APRON/BAGGAGE CLAIM<br />
Refinement of the Apron Level:<br />
As shown in Figure 7.2-6, Refined Apron Level, many of the operational<br />
functions and building systems are housed in the apron level of the building.<br />
The layout of the apron level is similar to the conceptual layout. These functions<br />
include secure circulation, inbound baggage processing and claim, outbound<br />
baggage processing and screening, concessions storage and screening, airline<br />
operations and storage, and mechanicals for the building (i.e. HVAC, backup<br />
generators, trash, etc.). Publicly accessible support functions, such as bag claim,<br />
baggage service offices, and USO offices are also housed within the apron level.<br />
Refinement of the Apron Level Baggage Claim Hall:<br />
A total of six domestic baggage claim devices are needed for the Baggage Claim<br />
Hall. Passenger circulation flows from the bottom of the escalator/stairs, through a<br />
space for meters/greeters, and into the public circulation areas along the frontage<br />
of the facility. Other support spaces adjacent to the Claim Hall remain unchanged<br />
from the conceptual stage. The preferred layout is shown in Figure 7.2-7,<br />
Refined Apron Level Baggage Claim Hall.<br />
7.2.4 LEVEL 03 U.S. CBP<br />
DRAFT<br />
Refinement of the Arrival Level U.S. CBP:<br />
The refined plan for International flights shown in Figure 7.2-8, Refined Arrival<br />
Level U.S. CBP, includes up to four gates for arriving aircraft and an arrivals hall<br />
designed to maintain a high level of service while processing the arriving<br />
passengers. Immigration, Customs, Bag Claim and restrooms are all provided in<br />
one central area at the upper “Sky Lobby” level. In this concept, international<br />
passengers that are exiting the CBP would use stairs or elevators down to the<br />
Baggage Claim Hall, and then exit the terminal or return to the security screening<br />
checkpoint entrance for connecting flights.<br />
Landrum & Brown Page 240<br />
April 2013
KANSAS CITY NEW TERMINAL STUDY PROGRAM CRITERIA DOCUMENT<br />
ADVANCE TERMINAL PLANNING STUDY DRAFT<br />
Landrum & Brown Page 241<br />
April 2013<br />
Figure 7.2-5<br />
REFINED GATE LEVEL SCREENING CHECKPOINT LOBBY<br />
DRAFT<br />
Source: L&B and Wellner Architects
KANSAS CITY NEW TERMINAL STUDY PROGRAM CRITERIA DOCUMENT<br />
ADVANCE TERMINAL PLANNING STUDY DRAFT<br />
Landrum & Brown Page 242<br />
April 2013<br />
Figure 7.2-6<br />
REFINED APRON LEVEL<br />
DRAFT<br />
Source: L&B and Wellner Architects
KANSAS CITY NEW TERMINAL STUDY PROGRAM CRITERIA DOCUMENT<br />
ADVANCE TERMINAL PLANNING STUDY DRAFT<br />
Landrum & Brown Page 243<br />
April 2013<br />
Figure 7.2-7<br />
REFINED APRON LEVEL BAGGAGE CLAIM HALL<br />
DRAFT<br />
Source: L&B and Wellner Architects
KANSAS CITY NEW TERMINAL STUDY PROGRAM CRITERIA DOCUMENT<br />
ADVANCE TERMINAL PLANNING STUDY DRAFT<br />
Landrum & Brown Page 244<br />
April 2013<br />
Figure 7.2-8<br />
REFINED ARRIVAL LEVEL U.S. CBP<br />
DRAFT<br />
Source: L&B and Wellner Architects
KANSAS CITY NEW TERMINAL STUDY PROGRAM CRITERIA DOCUMENT<br />
ADVANCE TERMINAL PLANNING STUDY DRAFT<br />
Landrum & Brown Page 245<br />
April 2013<br />
7.3 Conceptual <strong>Terminal</strong> Building Cross-Sections<br />
7.3.1 LONGITUDINAL SECTIONS<br />
DRAFT<br />
Figure 7.3-1<br />
SECTION THROUGH SPINE OF TERMINAL, LOOKING NORTH<br />
Source: Wellner Architects
KANSAS CITY NEW TERMINAL STUDY PROGRAM CRITERIA DOCUMENT<br />
ADVANCE TERMINAL PLANNING STUDY DRAFT<br />
Landrum & Brown Page 246<br />
April 2013<br />
Figure 7.3-2<br />
ENLARGED SECTION THROUGH SPINE OF TERMINAL, PROCESSOR<br />
DRAFT<br />
Source: Wellner Architects
KANSAS CITY NEW TERMINAL STUDY PROGRAM CRITERIA DOCUMENT<br />
ADVANCE TERMINAL PLANNING STUDY DRAFT<br />
Landrum & Brown Page 247<br />
April 2013<br />
Figure 7.3-3<br />
ENLARGED SECTION THROUGH SPINE OF TERMINAL<br />
DRAFT<br />
Source: Wellner Architects
KANSAS CITY NEW TERMINAL STUDY PROGRAM CRITERIA DOCUMENT<br />
ADVANCE TERMINAL PLANNING STUDY DRAFT<br />
Landrum & Brown Page 248<br />
April 2013<br />
Figure 7.3-4<br />
END OF CONCOURSE AT RETAIL NODE<br />
DRAFT<br />
Source: Wellner Architects
KANSAS CITY NEW TERMINAL STUDY PROGRAM CRITERIA DOCUMENT<br />
ADVANCE TERMINAL PLANNING STUDY DRAFT<br />
Landrum & Brown Page 249<br />
April 2013<br />
Figure 7.3-5<br />
SECTION THROUGH CONCOURSE<br />
DRAFT<br />
Source: Wellner Architects
KANSAS CITY NEW TERMINAL STUDY PROGRAM CRITERIA DOCUMENT<br />
ADVANCE TERMINAL PLANNING STUDY DRAFT<br />
Landrum & Brown Page 250<br />
April 2013<br />
7.3.2 TRANSVERSE SECTIONS<br />
Figure 7.3-6<br />
LOOKING BACK TO SECURITY SCREENING CHECKPOINT<br />
DRAFT<br />
Source: Wellner Architects
KANSAS CITY NEW TERMINAL STUDY PROGRAM CRITERIA DOCUMENT<br />
ADVANCE TERMINAL PLANNING STUDY DRAFT<br />
Landrum & Brown Page 251<br />
April 2013<br />
Figure 7.3-7<br />
SECTION THROUGH SINGLE LOADED CORRIDOR LOOKING BACK TO TERMINAL PROCESSOR<br />
DRAFT<br />
Source: Wellner Architects
KANSAS CITY NEW TERMINAL STUDY PROGRAM CRITERIA DOCUMENT<br />
ADVANCE TERMINAL PLANNING STUDY DRAFT<br />
Landrum & Brown Page 252<br />
April 2013<br />
7.4 Conceptual Building Mass Elevations<br />
7.4.1 TERMINAL ELEVATIONS<br />
DRAFT<br />
Figure 7.4-1<br />
SECTION THROUGH SINGLE LOADED CORRIDOR LOOKING BACK TO TERMINAL PROCESSOR<br />
Source: Wellner Architects
KANSAS CITY NEW TERMINAL STUDY PROGRAM CRITERIA DOCUMENT<br />
ADVANCE TERMINAL PLANNING STUDY DRAFT<br />
Landrum & Brown Page 253<br />
April 2013<br />
7.5 Conceptual Illustrations<br />
7.5.1 EXTERIOR ILLUSTRATIONS<br />
DRAFT<br />
Figure 7.5-1<br />
EXTERIOR ILLUSTRATION – CONCEPTUAL TERMINAL AND PARKING STRUCTURE<br />
Source: L&B
KANSAS CITY NEW TERMINAL STUDY PROGRAM CRITERIA DOCUMENT<br />
ADVANCE TERMINAL PLANNING STUDY DRAFT<br />
Figure 7.5-2<br />
EXTERIOR ILLUSTRATION – CONCEPTUAL PARKING STRUCTURE AND COMMERCIAL PLAZA ROOF<br />
Landrum & Brown Page 254<br />
April 2013<br />
DRAFT<br />
Source: L&B
KANSAS CITY NEW TERMINAL STUDY PROGRAM CRITERIA DOCUMENT<br />
ADVANCE TERMINAL PLANNING STUDY DRAFT<br />
Figure 7.5-3<br />
EXTERIOR ILLUSTRATION – CONCEPTUAL PARKING STRUCTURE AND COMMERCIAL PLAZA - CUTAWAY<br />
Landrum & Brown Page 255<br />
April 2013<br />
DRAFT<br />
Source: L&B
KANSAS CITY NEW TERMINAL STUDY PROGRAM CRITERIA DOCUMENT<br />
ADVANCE TERMINAL PLANNING STUDY DRAFT<br />
Landrum & Brown Page 256<br />
April 2013<br />
Figure 7.5-4<br />
EXTERIOR ILLUSTRATION – CONCEPTUAL APPROACH AT THE DEPARTURES LEVEL<br />
DRAFT<br />
Source: L&B
KANSAS CITY NEW TERMINAL STUDY PROGRAM CRITERIA DOCUMENT<br />
ADVANCE TERMINAL PLANNING STUDY DRAFT<br />
Figure 7.5-5<br />
INTERIOR ILLUSTRATION – CONCEPTUAL MAIN CONCOURSE LOOKING TOWARD CONCESSIONS NODE<br />
Landrum & Brown Page 257<br />
April 2013<br />
7.5.2 INTERIOR ILLUSTRATIONS<br />
DRAFT<br />
Source: L&B
KANSAS CITY NEW TERMINAL STUDY PROGRAM CRITERIA DOCUMENT<br />
ADVANCE TERMINAL PLANNING STUDY DRAFT<br />
Landrum & Brown Page 258<br />
April 2013<br />
Figure 7.5-6<br />
INTERIOR ILLUSTRATION – CONCEPTUAL TICKETING LEVEL - CUTAWAY<br />
DRAFT<br />
Source: L&B
KANSAS CITY NEW TERMINAL STUDY PROGRAM CRITERIA DOCUMENT<br />
ADVANCE TERMINAL PLANNING STUDY DRAFT<br />
Figure 7.5-7<br />
INTERIOR ILLUSTRATION – CONCEPTUAL CONCOURSE AND CONCESSIONS NODE - CUTAWAY<br />
Landrum & Brown Page 259<br />
April 2013<br />
DRAFT<br />
Source: L&B
KANSAS CITY NEW TERMINAL STUDY<br />
ADVANCE TERMINAL PLANNING STUDY<br />
PROGRAM CRITERIA DOCUMENT<br />
DRAFT<br />
7.6 New <strong>Terminal</strong> Mechanical & Electrical<br />
Improvements/Alternatives<br />
7.6.1 PROJECTED NEW TERMINAL IMPROVEMENTS/<br />
ALTERNATIVES:<br />
7.6.1.1 Heating Equipment<br />
The New <strong>Terminal</strong> will include a mechanical space for a hot water (HW) heating<br />
system as follows:<br />
<br />
HW Space Heating System: 600 horsepower (20,085 MBTU) natural<br />
gas-fired hot water boilers with 10:1 turn down burner ratio.<br />
HW Distribution: Primary-Secondary Flow HW distribution for space heating.<br />
HW<br />
DRAFT<br />
Supply and Return Temperatures: Supply temperature equals<br />
190 degrees Fahrenheit and Return equals 150 degrees fahrenheit at less<br />
than 60 psig pressure.<br />
Ancillary HW equipment: Water softener, chemical tanks (corrosion<br />
inhibitors), air separator, mixing valve and 5 psig natural gas supply to each<br />
boiler pressure regulating station.<br />
Domestic Hot Water (DHW) system: Natural gas-fired condensing boilers for<br />
large HW demands by restaurants and concessions. Electric unit heaters to<br />
be used for restrooms and miscellaneous demands.<br />
DHW recirculation system will be included for condenser boiler system.<br />
DHW supply temperature equal to 125 degrees fahrenheit.<br />
Water Softeners: All heated water to be softened.<br />
Figure 7.6-1, Boiler/Domestic Hot Water Plant, shows the layout of the New<br />
<strong>Terminal</strong> Boiler Room.<br />
Landrum & Brown Page 260<br />
April 2013
KANSAS CITY NEW TERMINAL STUDY<br />
ADVANCE TERMINAL PLANNING STUDY<br />
PROGRAM CRITERIA DOCUMENT<br />
DRAFT<br />
Figure 7.6-1<br />
BOILER/DOMESTIC HOT WATER PLANT<br />
Source:<br />
HNTB<br />
7.6.1.2 Cooling Equipment<br />
The existing CUP will be used for cooling the New <strong>Terminal</strong>. The alternative to<br />
install cooling equipment in the New <strong>Terminal</strong> was not considered because terminal<br />
space is reserved for revenue generating opportunities and there was no good<br />
landside location for the cooling towers. The following cooling system will be<br />
provided.<br />
<br />
<br />
<br />
<br />
<br />
<br />
DRAFT<br />
Chillers: 1500 Ton, centrifugal, refrigerant type R123 or 134A, with<br />
4160 volt motors. Pipe chillers in parallel.<br />
Chilled Water Supply (CWS) and Chilled Water Return (CWR) Temperatures:<br />
CWS temperature to equal 40 degrees Fahrenheit as it leaves the chiller<br />
plant. Assume 42 degrees Fahrenheit as it enters the AHUs in the New<br />
<strong>Terminal</strong>. CWR temperature to equal 58 degrees Fahrenheit back at the CUP<br />
at less than 60 psig pressure.<br />
CWS distribution type: Variable Primary Flow.<br />
Cooling Towers: Induced draft type, six Cells; induced draft; no anti-plume;<br />
two speed fans; three single-speed condenser water (CHW) pumps – 480V.<br />
Cooling Tower Water Design: Condenser Water Temperature differential<br />
design criteria equal to 90 degrees Fahrenheit in and 80 degrees Fahrenheit<br />
out with Air Wet Bulb temperature equal to 72 degrees Fahrenheit.<br />
Plate Frame Exchangers for Economizer Cooling in winter: Will not be used.<br />
Landrum & Brown Page 261<br />
April 2013
KANSAS CITY NEW TERMINAL STUDY<br />
ADVANCE TERMINAL PLANNING STUDY<br />
PROGRAM CRITERIA DOCUMENT<br />
DRAFT<br />
7.6.1.3 Mechanical Plant<br />
Central Utility Plant (CUP)<br />
In addition to using the existing CUP Site, five alternative sites were investigated as<br />
a new CUP location. The Alternative 4 site was selected as the Prefered Alternative<br />
if the existing CUP site was not used. The preferred Alternative 4 CUP is located<br />
northwest of the existing plant. See Figure 7.6-2, CUP Site Plan-Base Case, for<br />
the existing CUP site location and new CHW piping to the New <strong>Terminal</strong> and<br />
Figure 7.6-3, CUP Site Plan Alternatives and Utility Corridors. The base case<br />
and the preferred Alternative 4 CUPs are planned to include the following:<br />
<br />
<br />
<br />
<br />
<br />
<br />
Chillers:<br />
Primary-Variable Flow Chilled Water PumpsMotor Control Center for chilled<br />
water equipment.<br />
Appropriate chilled water system chemical treatment, corrosion inhibiters,<br />
and expansion tanks.<br />
Kansas City Power & Light (KCP&L) Switchgear Room located on one end of<br />
the CUP with code required egress.<br />
Cooling Towers: Match the chillers, with space to add a future cooling tower.<br />
Distribution Piping: 15 parking spaces outside of the CUP for plant operators.<br />
7.6.1.4 HVAC Systems<br />
<strong>Terminal</strong> HVAC<br />
DRAFT<br />
The New <strong>Terminal</strong> HVAC is planned to be a Single-Duct Variable Air Volume (VAV)<br />
air distribution system for the majority of the spaces. Air Handling Units (AHUs)<br />
will be located in Mechanical Rooms that are spaced throughout the New <strong>Terminal</strong>.<br />
See Figure 7.6-4, Mechanical Room Locations (Appendix A), for mechanical<br />
room locations in the New <strong>Terminal</strong> as well as a typical mechanical room layout.<br />
The AHUs will consist of a plug-type supply fan, chilled water cooling coil, heating<br />
water pre heat coil, plug-type return fan, and pre filters and final filters.<br />
Sufficient outside air is introduced at the AHUs to meet the requirements of<br />
ASHRAE 62.1, Ventilation for Acceptable Indoor Air Quality. A 100 percent Outside<br />
Air Economizer will provide “free cooling” when outdoor air conditions permit.<br />
No humidification will be provided in AHUs. Radiant or HTHW unit heaters will be<br />
used.<br />
The air supply temperature will equal 55 degrees Fahrenheit and return air<br />
temperatures will be at 78 degrees Fahrenheit. Conditioned air is ducted to VAV<br />
boxes with HW coils for additional heating to meet the space requirements.<br />
Perimeter spaces will use a forced air type system and/or perimeter finned tube<br />
radiation depending on the architecture. All restroom spaces will be exhausted.<br />
Landrum & Brown Page 262<br />
April 2013
KANSAS CITY NEW TERMINAL STUDY PROGRAM CRITERIA DOCUMENT<br />
ADVANCE TERMINAL PLANNING STUDY DRAFT<br />
Landrum & Brown Page 263<br />
April 2013<br />
Figure 7.6-2<br />
CUP SITE PLAN-BASE CASE<br />
DRAFT<br />
Source: HNTB
KANSAS CITY NEW TERMINAL STUDY PROGRAM CRITERIA DOCUMENT<br />
ADVANCE TERMINAL PLANNING STUDY DRAFT<br />
Landrum & Brown Page 264<br />
April 2013<br />
Figure 7.6-3<br />
CUP SITE PLAN ALTERNATIVES AND UTILITY CORRIDORS<br />
DRAFT<br />
Source: HNTB
KANSAS CITY NEW TERMINAL STUDY PROGRAM CRITERIA DOCUMENT<br />
ADVANCE TERMINAL PLANNING STUDY DRAFT<br />
Landrum & Brown Page 265<br />
April 2013<br />
Figure 7.6-4<br />
MECHANICAL ROOM LOCATIONS<br />
DRAFT<br />
Source: HNTB
KANSAS CITY NEW TERMINAL STUDY<br />
ADVANCE TERMINAL PLANNING STUDY<br />
PROGRAM CRITERIA DOCUMENT<br />
DRAFT<br />
The Chiller Plant is not run year round and chilled water is not available to provide<br />
cooling for computer equipment. Separate Direct Expansion (DX) Air Conditioning<br />
split systems will serve the larger computer rooms. This involves an indoor Fan Coil<br />
unit, with a refrigerant DX coil to cool the air. The refrigerant is piped to an<br />
outdoor air cooled condensing unit to complete the split system. Smaller IT<br />
Equipment Rooms will use Through-the-Wall DX air conditioning systems.<br />
Bag makeup, tug area, and truck receiving dock areas will be exhausted with a<br />
ducted system and HW unit heaters will provide heating. CO sensors will be<br />
provided for diesel and some gasoline Ground Support Equipment (GSE). Outside<br />
air will come from roof top intakes and will include two-inch pleated paper filters as<br />
minimum. Air Curtains are planned at baggage doors and large support area<br />
openings.<br />
Concession Food Prep areas will be exhausted. Heat Recovery will be investigated<br />
as the design progresses. Kitchen exhaust hoods and gas-fired makeup air units<br />
will be provided for restaurant grease hoods.<br />
7.6.1.5 Aircraft Specialty Equipment<br />
Point-of-Use (POU) systems are preferred by KCI and the Airlines. New <strong>Terminal</strong><br />
gates are planned to have loading bridges with a POU Pre-conditioned Air unit<br />
(PCA) and a 400 Hz unit. Central or zone type PCA and 400 Hz systems were<br />
considered because they save energy and require less maintenance than the POU<br />
type. However, if a chiller or motor generator set fails, the entire system is<br />
impacted. In addition, the capital cost of these systems are high and aircraft<br />
diversity must be significant in order to realize increased savings from reduced<br />
energy usage and reduced maintenance costs to justify these investments. Finally,<br />
central and zone type systems are difficult to modify. For example, at Hobby<br />
International Airport, they want to add Group V aircraft to the terminal but the<br />
existing zone PCA system was designed for Group III aircraft. Pipe size is fixed and<br />
consequently they will likely install a POU type for the larger gates.<br />
DRAFT<br />
GSE Quick Charging Stations are a great technology to help reduce fossil fuel<br />
emissions at the Airport and reduce undesirable emissions from fossil fuel GSE.<br />
The New <strong>Terminal</strong> is planned to include electric GSE and quick charging stations.<br />
Adequate power for electric GSE recharging equipment is planned. For example,<br />
Bob Hope Airport in Burbank, California, was the first in the U.S. to convert to an<br />
“all-electric” GSE fleet model. At Bob Hope Airport, they were able to come to<br />
agreement with the airlines to convert the GSE fleet to electric if the airport<br />
provided the rapid charger infrastructure. Many U.S. airports now operate at least<br />
one electric fast charge system.. Major international airports that have rapid<br />
charging stations include Boston Logan, Charlotte, Chicago O’Hare, Dallas Fort<br />
Worth, Dulles, George Bush, John F. Kennedy, La Guardia, Los Angeles, Miami,<br />
Newark, Philadelphia, and San Francisco. These airports have replaced thousands<br />
of their fossil-fueled GSE vehicles with cleaner, more efficient electric-powered<br />
alternatives<br />
Landrum & Brown Page 266<br />
April 2013
KANSAS CITY NEW TERMINAL STUDY<br />
ADVANCE TERMINAL PLANNING STUDY<br />
PROGRAM CRITERIA DOCUMENT<br />
DRAFT<br />
Recommended Aircraft Specialty Equipment for the New <strong>Terminal</strong> is POU<br />
Preconditioned Air and 400 Hz motor generator units on each loading bridge and<br />
GSE Quick Charging Stations, not the conventional eight-hour chargers. Rapid<br />
chargers provide up to one hour 80 percent equipment charges and are convenient<br />
but come with higher first costs.<br />
7.6.1.6 PLUMBING ITEMS<br />
Water Service<br />
Water Service is planned to come from the KCMO Water Service 12-inch diameter<br />
water main located landside of the existing terminals. Water will enter the building<br />
at the Boiler/Domestic Hot Water Plant through a backflow preventer. The pipe<br />
splits into cold water (CW) and hot water (HW) mains, heated by the HW boilers<br />
(described previously). Water softeners for the HW system will be provided for in<br />
the boiler room.<br />
Sprinkler System<br />
The New <strong>Terminal</strong> will have a complete sprinkler system to meet the requirements<br />
of National Fire Protection Administration (NFPA) 13, Installation of Sprinkler<br />
Systems. No fire pumps are anticipated. Water flow will be provided per the 2012<br />
IFC unless the KCI fire insurance carrier requirements are more conservative.<br />
The water flow rate will be assumed to be 2,000 gallons per minute (gpm) for a<br />
four-hour duration unless otherwise directed. (2012 IFC minimum water flow for<br />
Class IIIA construction over 166,501 square feet is 1,500 gpm for four hours).<br />
Two fire hydrants are planned for airside installation. Figure 7.6-5, Fire<br />
Protection Existing Conditions, shows the existing fire protection mains.<br />
Figure 7.6-6, <strong>Terminal</strong> B and C Fire Protection Phasing Plan, indicates a new<br />
12-inch diameter water line to re-feed the mains for <strong>Terminal</strong>s B and C, as well as<br />
demolition for the existing <strong>Terminal</strong> A mains. Figure 7.6-7, Fire Protection<br />
Routing-New <strong>Terminal</strong>, shows the routes of the fire mains around the New<br />
<strong>Terminal</strong>. In addition, it shows a distribution of fire sprinkler risers and standpipes<br />
in the New <strong>Terminal</strong> and Parking Garage.<br />
Sewer<br />
DRAFT<br />
The New <strong>Terminal</strong> sewer will drain by gravity to the sewer main. The plan is to<br />
have two minimum main eight-inch diameter sewer connections from the New<br />
<strong>Terminal</strong>, one from the north half and one from the south. Lift station<br />
requirements will be determined based on elevations and sanitary outfall.<br />
Individual grease traps will be provided in every food prep area. KCI is very spread<br />
out which makes a centralized grease waste system not practical. If a central<br />
grease vault is located on airside within 100 feet of the main restaurant /<br />
concessions area, it may be considered.<br />
Landrum & Brown Page 267<br />
April 2013
KANSAS CITY NEW TERMINAL STUDY PROGRAM CRITERIA DOCUMENT<br />
ADVANCE TERMINAL PLANNING STUDY DRAFT<br />
Landrum & Brown Page 268<br />
April 2013<br />
Figure 7.6-5<br />
FIRE PROTECTION EXISTING CONDITIONS<br />
DRAFT<br />
Source: HNTB
KANSAS CITY NEW TERMINAL STUDY PROGRAM CRITERIA DOCUMENT<br />
ADVANCE TERMINAL PLANNING STUDY DRAFT<br />
Landrum & Brown Page 269<br />
April 2013<br />
Figure 7.6-6<br />
TERMINAL B AND C FIRE PROTECTION PHASING PLAN<br />
DRAFT<br />
Source: HNTB
KANSAS CITY NEW TERMINAL STUDY PROGRAM CRITERIA DOCUMENT<br />
ADVANCE TERMINAL PLANNING STUDY DRAFT<br />
Landrum & Brown Page 270<br />
April 2013<br />
Figure 7.6-7<br />
FIRE PROTECTION ROUTING-NEW TERMINAL<br />
DRAFT<br />
Source: HNTB
KANSAS CITY NEW TERMINAL STUDY<br />
ADVANCE TERMINAL PLANNING STUDY<br />
PROGRAM CRITERIA DOCUMENT<br />
DRAFT<br />
Natural Gas<br />
Natural gas serves the HTHW boilers, domestic hot water boilers, and concessions.<br />
Natural gas is piped to the Boiler Room from a 10-inch diameter main from Missouri<br />
Gas & Energy. The gas pressure in the main is 25 psig. The gas will be regulated<br />
down to 5.0 psig at the boiler plant. This will provide the gas pressure of 2.8 psig<br />
required at the boiler plus additional pressure for good regulator operation. Natural<br />
gas for concessions will enter the New <strong>Terminal</strong> separately and be regulated down<br />
to seven-inch w.g. to serve the food service equipment.<br />
Roof Drainage<br />
Roof drains and emergency overflow roof drains are spaced as needed to cover all<br />
New <strong>Terminal</strong> roofs. Stormwater leaders are sized per the plumbing code and run<br />
down the interior of the building to the stormwater system. Stormwater runoff<br />
onto apron pavement should be avoided. Roof drains and leaders should not<br />
contribute to build up of ice sheets.<br />
7.6.1.7 Electrical Items<br />
<strong>Terminal</strong> Power Requirements<br />
In order to distribute power throughout the New <strong>Terminal</strong> without extensive voltage<br />
drop, 12.5kV, 3-phase power will be distributed around the New <strong>Terminal</strong>, from the<br />
main KCP&L Switchgear room, to four main KCI substation and switchgear rooms.<br />
It is recommended that this 12.5kV distribution be done in the apron so as to<br />
increase ease of access, and reduce risk of personal injury and vandalism in the<br />
case of a fault. See Figure 7.6-8, KCI <strong>Terminal</strong> 12.5kv Ductbank Site Plan,<br />
for the approximate size and location of the KCP&L Switchgear room and the<br />
locations of the four KCI switchgear rooms. The KCP&L 15kV switchgear will feed<br />
four double-ended unit substations. Each of these four unit substations will consist<br />
of two 2500kVA, 12.5kV – 277/480V transformers and a secondary 4000A maintie-main<br />
switchgear. Each substation will distribute power to 21 100-square foot<br />
sub-electrical rooms located throughout the New <strong>Terminal</strong> for power to adjacent<br />
gates, and low voltage terminal loads. See Figure 7.6-9, Electrical Single Line<br />
Diagram, and Figure 7.6-10, <strong>Terminal</strong> Electrical and Telecomm Room Floor<br />
Plan. Each of the 21 sub-electrical rooms will have 277/480V distribution boards,<br />
480/120/208V transformers, 120/208V distribution boards, and lighting control<br />
panels.<br />
DRAFT<br />
Landrum & Brown Page 271<br />
April 2013
KANSAS CITY NEW TERMINAL STUDY PROGRAM CRITERIA DOCUMENT<br />
ADVANCE TERMINAL PLANNING STUDY DRAFT<br />
Landrum & Brown Page 272<br />
April 2013<br />
Figure 7.6-8<br />
KCI TERMINAL 12.5KV DUCTBANK SITE PLAN<br />
DRAFT<br />
Source: HNTB
KANSAS CITY NEW TERMINAL STUDY PROGRAM CRITERIA DOCUMENT<br />
ADVANCE TERMINAL PLANNING STUDY DRAFT<br />
Landrum & Brown Page 273<br />
April 2013<br />
Figure 7.6-9<br />
ELECTRICAL SINGLE LINE DIAGRAM<br />
DRAFT<br />
Source: HNTB
KANSAS CITY NEW TERMINAL STUDY PROGRAM CRITERIA DOCUMENT<br />
ADVANCE TERMINAL PLANNING STUDY DRAFT<br />
Landrum & Brown Page 274<br />
April 2013<br />
Figure 7.6-10<br />
TERMINAL ELECTRICAL AND TELECOMM ROOM FLOOR PLAN<br />
DRAFT<br />
Source: HNTB
KANSAS CITY NEW TERMINAL STUDY<br />
ADVANCE TERMINAL PLANNING STUDY<br />
PROGRAM CRITERIA DOCUMENT<br />
DRAFT<br />
Each of the four KCI Switchgear rooms will have KCP&L meters that tie back to a<br />
centralized metering point in the main <strong>Terminal</strong> KCP&L Electrical room. The main<br />
<strong>Terminal</strong> electrical room including emergency and stand-by generators as well as<br />
the KCI Switchgear Room A, will require a minimum of 6,500 square feet of space.<br />
The four main KCI substations A, B, C, and D can be fed as shown on Figure 7.6-9,<br />
Electrical Single Line Diagram, or as part of a loop system. The advantages of a<br />
loop system is that fewer, if not larger feeder cables would be required to maintain<br />
power to the four substations as well as allowing additional substations to be added<br />
without interruption. However, source switching equipment would be required in<br />
order to remove and maintain any single substation from the loop without<br />
disrupting power to the entire terminal. It is recommended that the New <strong>Terminal</strong><br />
distribution system be installed as shown on Figure 7.6-9, Electrical Single Line<br />
Diagram, as it requires less equipment and no additional terminal loads are<br />
anticipated. This proposed <strong>Terminal</strong> distribution will be the same for the Base Case<br />
and all alternatives.<br />
CUP<br />
In the proposed Base Case, the existing CUP will remain protected in place.<br />
See Exhibit E-4, KCI <strong>Terminal</strong> 12.5kv Ductbank Site Plan-Base Case. This includes<br />
all the existing 15kV KCP&L switchgear. In addition, new chillers and MCC<br />
equipment will be required in the existing CUP in order to support the New<br />
<strong>Terminal</strong>. To support this new equipment, the existing 15kV KCP&L switchgear,<br />
used for existing <strong>Terminal</strong> A, will be cut over to support the new CUP equipment,<br />
thus avoiding the need for any major overhaul of the existing KCP&L switchgear in<br />
the existing CUP. See Figure 7.6-11, Base Case-Upgraded Cup First Floor<br />
Plan, for power requirements needed to support the new mechanical equipment.<br />
DRAFT<br />
Figure 7.6-11<br />
BASE CASE-UPGRADED CUP FIRST FLOOR PLAN<br />
Source:<br />
HNTB<br />
Landrum & Brown Page 275<br />
April 2013
KANSAS CITY NEW TERMINAL STUDY<br />
ADVANCE TERMINAL PLANNING STUDY<br />
PROGRAM CRITERIA DOCUMENT<br />
DRAFT<br />
KCP&L Distribution Power<br />
In anticipation of the construction, and in order to maintain power to the existing<br />
CUP and <strong>Terminal</strong>s B and C, the existing 15kV distribution ductbanks and manholes<br />
from the KCP&L – KCI Substation 270 will have to be rerouted between existing<br />
MH-PA-10 to existing MH-PA-16. See Figure 7.6-12, 12.5kV Electrical Site<br />
Plan, for proposed re-route.<br />
KCP&L <strong>Terminal</strong> Power<br />
At least two 10MVA feeders are recommended for the New <strong>Terminal</strong>, with each<br />
feeding opposing ends of a 15kV KCP&L double ended switchboard. These new<br />
feeders will enter the New <strong>Terminal</strong> main electrical room directly from the KCP&L –<br />
KCI Substation 270. The New <strong>Terminal</strong> main switchboard will require a space that<br />
is approximately 30 feet x 75 feet, and can be co-located with the KCI Switchgear<br />
Room A within the New <strong>Terminal</strong>. See Figure 7.6-13, KCI <strong>Terminal</strong> 12.5kV<br />
Ductbank Site Plan (Appendix A), for Base Case 12.5kV <strong>Terminal</strong> Power.<br />
The existing KCP&L – KCI Substation 270 has a 50MVA capacity and only 15MVA is<br />
currently utilized. The existing substation is serviced by two transformers, which<br />
allows extending one new feeder from each transformer, providing adequate<br />
capacity, in case one of the transformers fails. KCP&L will own and operate all<br />
15kV distribution lines and associated 15kV equipment. In order to support the<br />
new distribution cables, concrete encased conduit and manholes will have to be<br />
provided to the New <strong>Terminal</strong> Main Electrical Room.<br />
In order to have a truly redundant system, 10MVA of power would have to be<br />
provided from one of the two local KCP&L adjacent substations: Tiffany Springs<br />
Substation or Overhaul Base Substation.<br />
DRAFT<br />
Although the Overhaul base substation is the closer of the two alternative locations<br />
(8,000 linear feet away), it was not originally constructed as a standard substation.<br />
In addition the new feeders from Overhaul Base would have to cross the entire East<br />
Airfield, including Runway 19L-1R and Taxiways E and F. Also, this substation does<br />
not have the ability to provide enough power to feed the entire terminal.<br />
With $500,000 improvements, it could provide one feeder to serve part of the<br />
required load. The cost for such a run could be as high as $3MIL for a single<br />
10MVA feeder and $6MIL for two feeders for materials alone, not counting the cost<br />
associated with jack and boring under the existing airfield and apron or unforeseen<br />
site conditions over the approximate 1.5 mile run. These upgrades would have to<br />
be confirmed with KCP&L prior to any final decision being made.<br />
Landrum & Brown Page 276<br />
April 2013
KANSAS CITY NEW TERMINAL STUDY PROGRAM CRITERIA DOCUMENT<br />
ADVANCE TERMINAL PLANNING STUDY DRAFT<br />
Landrum & Brown Page 277<br />
April 2013<br />
Figure 7.6-12<br />
12.5KV ELECTRICAL SITE PLAN<br />
DRAFT<br />
Source: HNTB
KANSAS CITY NEW TERMINAL STUDY PROGRAM CRITERIA DOCUMENT<br />
ADVANCE TERMINAL PLANNING STUDY DRAFT<br />
Landrum & Brown Page 278<br />
April 2013<br />
Figure 7.6-13<br />
KCI TERMINAL 12.5KV DUCTBANK SITE PLAN<br />
DRAFT<br />
Source: HNTB
KANSAS CITY NEW TERMINAL STUDY<br />
ADVANCE TERMINAL PLANNING STUDY<br />
PROGRAM CRITERIA DOCUMENT<br />
DRAFT<br />
Tiffany Springs Substation is the newest substation and can provide service to the<br />
New <strong>Terminal</strong>. It has 50 MVA capacity and three transformers, two of which are<br />
new. However, Tiffany Springs is the furthest substation from the New <strong>Terminal</strong><br />
(approximately 27,000 linear feet), and would have to cross the south or east<br />
airfield. The cost for such a run could be as high as $8MIL for a single 10MVA<br />
feeder and $16MIL for two feeders for materials alone, not counting the cost<br />
associated with jack and boring under the existing airfield and apron or unforeseen<br />
site conditions over the approximate five-mile run. These upgrades would have to<br />
be confirmed with KCP&L prior to any final decision being made.<br />
Given the unknown condition of the existing Overhaul Base substation, the long<br />
distance associated with connecting to the Tiffany Springs substation as well as the<br />
cost and potential disruptions to aircraft movements, it is recommended at this<br />
time that all connections for the New <strong>Terminal</strong>, CUP, and new Data Center be made<br />
from the existing KCP&L KCI substation to the north. However, if in the future it is<br />
determined that the existing KCP&L KCI substation is prone to failure and outages,<br />
intercept manholes, as well as space for connections to additional feeders will be<br />
provided at the New <strong>Terminal</strong>, CUP, and Data Center, in order to facilitate a new<br />
feeder from either the Overhaul Base or Tiffany Springs Substation. The manholes<br />
and additional switchgear will be located in such a manner that no disruptions to<br />
the terminal or terminal activities will be experienced during the cut-over.<br />
Emergency and Stand-by Power<br />
The Basic code required Emergency Egress and Fire Life Safety requirements can be<br />
facilitated by two 1 MW Emergency Generators provided in the main <strong>Terminal</strong><br />
electrical room. This will allow for basic smoke control, elevator return, egress<br />
lighting requirements, and airplane and terminal evacuation to dedicated<br />
evacuation sites. See Figure 7.6-14, Emergency and Standby Generator<br />
Plant, and Figure 7.6-15, KCI <strong>Terminal</strong> 12.5kv Ductbank Site Plan-Base<br />
Case.<br />
DRAFT<br />
Additional stand-by, non-code required back-up power can be provided for freeze<br />
protection, additional elevator functionality, additional lighting, emergency powered<br />
gate systems that allow for the controlled egress from aircraft at designated gates<br />
and other systems that allow for a more coordinated, public friendly terminal<br />
evacuation. This additional level of stand-by power can be facilitated by two<br />
1.5 MW stand-by generators in the main terminal electrical room.<br />
See Figure 7.6-14, Emergency and Standby Generator Plant.<br />
The entire generator system should be consolidated and located as close as possible<br />
to a KCI switchgear room. This will allow the emergency power to be controlled,<br />
monitored, and fed from a single point of distribution. Per Figure 7.6-15, KCI<br />
<strong>Terminal</strong> 12.5kv Ductbank Site Plan-Base Case, the preferred location is in the<br />
South East corner of the new <strong>Terminal</strong>. In addition to being located near an easily<br />
accessible landside access point, it is also near the main mechanical boiler room<br />
and MDF room, allowing for an inexpensive connection to the standby generator<br />
system.<br />
Landrum & Brown Page 279<br />
April 2013
KANSAS CITY NEW TERMINAL STUDY<br />
ADVANCE TERMINAL PLANNING STUDY<br />
PROGRAM CRITERIA DOCUMENT<br />
DRAFT<br />
Figure 7.6-14<br />
EMERGENCY AND STANDBY GENERATOR PLANT<br />
Source:<br />
HNTB<br />
DRAFT<br />
Locating the emergency and stand-by generators in the new CUP was not<br />
addressed because power for the New <strong>Terminal</strong> would be provided directly from the<br />
existing KCP&L substation, and not routed through the new CUP in order to reduce<br />
the risk of a single point of failure. Locating the generators in the new CUP with<br />
normal power going directly to the New <strong>Terminal</strong> would require that the ATS be<br />
located in the New <strong>Terminal</strong> Electrical room well over 2,000 feet away.<br />
This distance would mean significant voltage drop and added cost due to additional<br />
feeder size and length. The current location for the generator room at the far south<br />
end of the New <strong>Terminal</strong> puts them well out of the way of public traffic, and can be<br />
easily insulated to reduce noise.<br />
Landrum & Brown Page 280<br />
April 2013
KANSAS CITY NEW TERMINAL STUDY<br />
ADVANCE TERMINAL PLANNING STUDY<br />
PROGRAM CRITERIA DOCUMENT<br />
DRAFT<br />
Figure 7.6-15<br />
KCI TERMINAL 12.5KV DUCTBANK SITE PLAN-BASE CASE<br />
Source: HNTB<br />
Fire Alarm System<br />
DRAFT<br />
The New <strong>Terminal</strong> Fire Alarm System will need to have a main Fire Alarm Control<br />
Room located within the New <strong>Terminal</strong>, located on the ground floor adjacent to the<br />
front lobby, and approximately 10 feet x 20 feet in size. This room will house the<br />
main Fire Alarm Control Panel, as well smoke evacuation control system and<br />
emergency generator controls, in accordance with the local Fire Department.<br />
This system will have to be tied back into the main emergency response center at<br />
the Airport Rescue and Fire Fighting (ARFF) and/or Police shop, with remote<br />
annunciators at both locations. This new system will have to be capable of<br />
interfacing with the existing Fire Alarm systems within the existing <strong>Terminal</strong>s B and<br />
C, as well as other existing ancillary buildings to remain. Additional migrating<br />
hardware and or software may be required in order to fully integrate the different<br />
systems.<br />
Coordination with the Kansas City Fire Department (KCFD) should be completed<br />
early on, in order to coordinate the exact location of the New <strong>Terminal</strong> Fire Alarm<br />
Control Room, as well as determining if a second staging area at the COP Shop, or<br />
some other more desirable location is preferred.<br />
Landrum & Brown Page 281<br />
April 2013
KANSAS CITY NEW TERMINAL STUDY<br />
ADVANCE TERMINAL PLANNING STUDY<br />
PROGRAM CRITERIA DOCUMENT<br />
DRAFT<br />
Fiber Optic Site<br />
To accommodate the demolition of <strong>Terminal</strong> A, and maintain the connectivity of the<br />
existing Fiber optic loop, a portion of the existing Fiber Optic Loop System will have<br />
to be re-routed in order to maintain the double-ended feed to existing <strong>Terminal</strong>s B<br />
and C. In addition, final connections will have to be made at the New <strong>Terminal</strong>.<br />
These cut-overs will have to be strategically coordinated in order to avoid<br />
shutdowns of any secure or mission critical systems. See Figure 7.6-16, Fiber<br />
Optic Communications Site Plan.<br />
The existing Data Center and Airport Communications Center (ACC) in the CUP will<br />
continue to be the central hub for the fiber optic loop system. Once the <strong>Terminal</strong><br />
has been completed, the Fiber Optic Loop System will be extended into the new<br />
<strong>Terminal</strong> through a Main Point of Entrance (MPOE) Room or Main Distribution Frame<br />
(MDF) Room.<br />
<strong>Terminal</strong> IT System<br />
With a basic level of service required for the base line operation of the New<br />
<strong>Terminal</strong>, the MPOE/MDF room should be no less than 800 square feet, and located<br />
at the first point of entrance into the New <strong>Terminal</strong> for all communications systems.<br />
The MPOE/MDF room will provide a central hub for communications distribution to<br />
14 smaller telecommunications rooms or Intermediate Distribution Frames (IDFs)<br />
located throughout the New <strong>Terminal</strong>. See Figure 7.6-17, <strong>Terminal</strong> Electrical<br />
and Telecomm Room Floor Plan. The MPOE/MDF room will have all systems<br />
backed up with a UPS to maintain system power during brown outs or during<br />
generator start-up.<br />
DRAFT<br />
The six smaller IDFs will be no less than 150 square feet, and will house routers for<br />
connections to local airline GIDS; connections to airline and passenger WIFI<br />
routers; local eVIDS systems; amplifiers, noise sensors, and network switches for<br />
local Public Address systems; ACAMS security panels for local doors; closed circuit<br />
TV (CCTV) network hubs for signal consolidation and local viewing if required by<br />
individual airlines; local Fire Alarm sub-panels and UPS units to maintain system<br />
power during brown outs or during generator start-up. The IDFs should not be<br />
located any more than 300 feet apart, taking into account structural features such<br />
as stairwells and elevator shafts, which may require the rooms to be located closer<br />
together in order to maintain a 300 feet maximum cable run length between them.<br />
In addition to the IDFs IT closets no less than 8 feet x 10 feet shall be located at<br />
each gate, for ramp services monitoring systems, and local airline IT equipment. In<br />
addition, each IDF, IT closet, and MPOE/MDF will have a dedicated UPS powered<br />
air-conditioning unit separate from the New <strong>Terminal</strong> cooling system.<br />
Landrum & Brown Page 282<br />
April 2013
KANSAS CITY NEW TERMINAL STUDY PROGRAM CRITERIA DOCUMENT<br />
ADVANCE TERMINAL PLANNING STUDY DRAFT<br />
Landrum & Brown Page 283<br />
April 2013<br />
Figure 7.6-16<br />
FIBER OPTIC COMMUNICATIONS SITE PLAN<br />
DRAFT<br />
Source: HNTB
KANSAS CITY NEW TERMINAL STUDY PROGRAM CRITERIA DOCUMENT<br />
ADVANCE TERMINAL PLANNING STUDY DRAFT<br />
Landrum & Brown Page 284<br />
April 2013<br />
Figure 7.6-17<br />
TERMINAL ELECTRICAL AND TELECOMM ROOM FLOOR PLAN<br />
DRAFT<br />
Source: HNTB
KANSAS CITY NEW TERMINAL STUDY<br />
ADVANCE TERMINAL PLANNING STUDY<br />
PROGRAM CRITERIA DOCUMENT<br />
DRAFT<br />
IT<br />
The existing Data Center and ACC will be maintained. However, because of the<br />
New <strong>Terminal</strong> systems that will be installed, modifications will have to be made to<br />
both centers. The preferred option is to utilize existing adjacent support space for<br />
expanded systems. By utilizing adjacent rooms, existing systems to <strong>Terminal</strong>s B<br />
and C can be maintained during construction without interruption while the New<br />
<strong>Terminal</strong> systems are installed in the adjacent space. See Figure 7.6-18,<br />
Existing CUP First Floor Plan, for the existing Data Center room location and<br />
layout, and Figure 7.6-19, Existing CUP Third Floor Plan, for the existing ACC<br />
room location and layout. For the expanded Data Center requirements see<br />
Figure 7.6-20, Upgraded CUP First Floor Plan, and Figure 7.6-21, Upgraded<br />
CUP Third Floor Plan, for the ACC requirements.<br />
Figure 7.6-18<br />
EXISTING<br />
DRAFT<br />
CUP FIRST FLOOR PLAN<br />
Source: HNTB<br />
Landrum & Brown Page 285<br />
April 2013
KANSAS CITY NEW TERMINAL STUDY<br />
ADVANCE TERMINAL PLANNING STUDY<br />
PROGRAM CRITERIA DOCUMENT<br />
DRAFT<br />
Figure 7.6-19<br />
EXISTING CUP THIRD FLOOR PLAN<br />
Source:<br />
HNTB<br />
DRAFT<br />
Figure 7.6-20<br />
UPGRADED CUP FIRST FLOOR PLAN<br />
Source: HNTB<br />
Landrum & Brown Page 286<br />
April 2013
KANSAS CITY NEW TERMINAL STUDY<br />
ADVANCE TERMINAL PLANNING STUDY<br />
PROGRAM CRITERIA DOCUMENT<br />
DRAFT<br />
Figure 7.6-21<br />
UPGRADED CUP THIRD FLOOR PLAN<br />
Source: HNTB<br />
DRAFT<br />
Landrum & Brown Page 287<br />
April 2013
KANSAS CITY NEW TERMINAL STUDY<br />
ADVANCE TERMINAL PLANNING STUDY<br />
PROGRAM CRITERIA DOCUMENT<br />
DRAFT<br />
7.7 Baggage Handling System (BHS)<br />
7.7.1 OUTBOUND BHS<br />
The conceptual Checked Baggage Inspection System (CBIS) for Kansas City<br />
International Airport (MCI) consists of 15 total induction points which feed baggage<br />
to four inline screening devices (ISD) and sort to eight slope plate devicesshown in<br />
Figure 7.7-1, Overall BHS System.<br />
Figure 7.7-1<br />
OVERALL BHS SYSTEM<br />
Source: Vic Thompson Co.<br />
DRAFT<br />
Landrum & Brown Page 288<br />
April 2013
KANSAS CITY NEW TERMINAL STUDY<br />
ADVANCE TERMINAL PLANNING STUDY<br />
PROGRAM CRITERIA DOCUMENT<br />
DRAFT<br />
7.7.2 BAGGAGE INDUCTION POINTS<br />
There are four ticket counter baggage induction points on the north end of the<br />
terminal, and four ticket counter induction points on the south end of the terminal.<br />
Additionally, there are two curbside baggage induction points, four self-tagging<br />
baggage induction points (garage) and one international re-check induction point.<br />
These 15 induction points are collected by two main security feed lines; one for the<br />
north ticket counters and one for the south ticket counters, curbsides and<br />
international re-check. The two security feed lines merge together before entering<br />
the matrix screening area , shown in Figure 7.7-2, Level 2 BHS.<br />
Figure 7.7-2<br />
LEVEL 2 BHS<br />
DRAFT<br />
Source:<br />
Vic Thompson Co.<br />
Landrum & Brown Page 289<br />
April 2013
KANSAS CITY NEW TERMINAL STUDY<br />
ADVANCE TERMINAL PLANNING STUDY<br />
PROGRAM CRITERIA DOCUMENT<br />
DRAFT<br />
Oversize is handled separately from the CBIS. There is an oversize baggage<br />
induction point for each side of the terminal. These two lines merge together<br />
before entering the Checked Baggage Resolution Area (CBRA) for manual<br />
screening.<br />
7.7.3 SCREENING MATRIX<br />
After the two security feed lines merge together, baggage is sized using a bag<br />
measuring array (BMA). Bags that are too large to fit into the ISD will be<br />
considered out-of-gauge (OOG) and will divert to a screening machine bypass line<br />
that leads directly to CBRA for manual screening. The single security feed main line<br />
will divert all in-gauge baggage to one of four CTX9800 screening machines. After<br />
the level 1 screening decision is made by the ISD, clear bags merge onto a main<br />
clear line. Alarmed bags will merge on to an on-screen resolution (OSR) line while<br />
the level 2 decision is pending. Bags which have been cleared by the level 2 OSR<br />
operator will<br />
DRAFT<br />
then be diverted from the OSR line onto the main clear line. Bags that<br />
remain alarmed will continue on to the CBRA for a level 3 inspection by TSA.<br />
Once the baggage is cleared by TSA, it will be placed on the CBRA clear line and<br />
merge onto the main clear line.<br />
7.7.4 BAGGAGE SORTATION<br />
Baggage on the main clear line is then processed through an automatic tag reader<br />
(ATR) for bag sorting. Bags that fail to be read are diverted to a manual encode<br />
station for manual scanning. The main clear line splits into two separate lines, one<br />
for the carriers on the north end and one for the carriers on the south end. Each of<br />
these clear lines feeds four slope plate devices. Any bags that fail to divert will end<br />
up on the most downstream slope plate device.<br />
There is a dedicated oversize clear line in CBRA that carries the cleared oversize<br />
baggage directly to the outbound bag room for make-up. The carriers will need to<br />
collect their oversized items from this single run-out belt for oversized baggage.<br />
7.7.5 INBOUND BHS<br />
The inbound will consist of six inbound load belts that feed six inbound claim units<br />
shown in Figure 7.7-3, Level 1 BHS. Each load belt feeds one claim unit without<br />
crossover capabilities.<br />
Landrum & Brown Page 290<br />
April 2013
KANSAS CITY NEW TERMINAL STUDY<br />
ADVANCE TERMINAL PLANNING STUDY<br />
PROGRAM CRITERIA DOCUMENT<br />
DRAFT<br />
Figure 7.7-3<br />
LEVEL 1 BHS<br />
Source:<br />
Vic Thompson Co.<br />
DRAFT<br />
Landrum & Brown Page 291<br />
April 2013
KANSAS CITY NEW TERMINAL STUDY<br />
ADVANCE TERMINAL PLANNING STUDY<br />
PROGRAM CRITERIA DOCUMENT<br />
DRAFT<br />
7.7.6 FIS<br />
International inbound bags are loaded onto a dedicated FIS inbound load belt in the<br />
south inbound bag room. These bags are read by an ATR and sorted to one of two<br />
FIS claim units shown in Figure 7.7-4, Level 3 BHS.<br />
Figure 7.7-4<br />
LEVEL 3 BHS<br />
Source: Vic Thompson Co.<br />
DRAFT<br />
Landrum & Brown Page 292<br />
April 2013
KANSAS CITY NEW TERMINAL STUDY<br />
ADVANCE TERMINAL PLANNING STUDY<br />
PROGRAM CRITERIA DOCUMENT<br />
DRAFT<br />
8. ENVIRONMENTAL CONSIDERATIONS<br />
8.1 Alternative Evaluation - Environmental Resources<br />
Initial alternatives during the Master <strong>Planning</strong> process were examined in compliance<br />
with the operational planning criteria found in the FAA Advisory Circular<br />
150/5300-13, Airport Design. KCI has a relatively large amount of land that is<br />
currently undeveloped. KCI’s property boundary includes 11,000 acres of open<br />
land with varying terrain providing various site selection possibilities. This uniquely<br />
positive attribute led to the selection of three initial terminal complex site envelopes<br />
in the Master Plan. The three initial options included development in the central<br />
terminal area, development in the west open area between existing Runway 1L/19R<br />
and Interstate 435, and development in the south between existing Runway 9/27<br />
and State Highway 152.<br />
8.1.1 ADVANCED PLANNING/PURPOSE AND NEED<br />
Since the Master Plan, KCAD has identified specific goals, objectives, and passenger<br />
demand characteristics that guided the further development of alternatives.<br />
The purpose of the terminal development project would be to reduce operating<br />
costs and enhance revenues for KCAD while improving passenger processing and<br />
efficiency within the terminal and provide convenient roadways, parking lots, and<br />
traffic flow for Airport users and vehicles. It is KCAD’s goal to provide a high level<br />
of air service, as well as a source of community pride for Kansas City and the Metro<br />
Region in a cost effective and affordable manner. The new terminal would need to<br />
incorporate the latest in passenger processing technology and achieve a balanced<br />
capacity of gates, terminal processing, and landside facilities.<br />
DRAFT<br />
8.1.2 PREFERRED ALTERNATIVE<br />
Based on KCAD’s specific goals, FAA operational requirements, and criteria<br />
including affordability, airside, terminal, and landside characteristics, support<br />
facilities, availability of utilities, environmental pro and cons, implementation, and<br />
other strategic considerations, KCAD has selected a preferred alternative.<br />
8.2 Implementation <strong>Planning</strong> – Environmental<br />
Considerations<br />
The FAA is responsible for complying with both the procedures and policies of the<br />
National Environmental Policy Act (NEPA) 1 and other related environmental laws,<br />
regulations, and orders applicable to FAA actions. FAA Order 1050.1E states that,<br />
“Unless otherwise exempted by the Council on Environmental Quality (CEQ)<br />
regulations, all formal actions taken by FAA officials are subject to NEPA review<br />
unless statutory law applicable to the FAA's operations expressly prohibits or makes<br />
compliance impossible. Actions covered by NEPA review include grants, loans,<br />
1<br />
42 U.S.C. 4321-4347.<br />
Landrum & Brown Page 293<br />
April 2013
KANSAS CITY NEW TERMINAL STUDY<br />
ADVANCE TERMINAL PLANNING STUDY<br />
PROGRAM CRITERIA DOCUMENT<br />
DRAFT<br />
contracts, leases, construction, research activities, rulemaking and regulatory<br />
actions, certifications, licensing, permits, plans submitted to the FAA which require<br />
FAA approval, and legislation proposed by the FAA.” 2<br />
8.2.1 POTENTIAL NEPA PROCESSING REQUIREMENTS<br />
Federal regulations outline three major levels of NEPA review relevant to proposed<br />
airport development projects – Categorical Exclusion, Environmental Assessment,<br />
and Environmental Impact Statement.<br />
Categorical Exclusion (CATEX) – applies to those actions that have been found<br />
(under normal circumstances) to have no potential for significant environmental<br />
impact. Actions that are eligible for a CATEX are listed in Chapter Three of FAA<br />
Order 1050.1E. CATEX documents can take up to three months to prepare and FAA<br />
review time may take 45 to 60 days. A CATEX generally does not require<br />
coordination with regulatory agencies and does not require public notice of the<br />
project.<br />
Environmental Assessment (EA) – applies to those actions that have been found by<br />
experience to sometimes have significant environmental impacts. The list of<br />
actions normally requiring an EA can be found in Chapter Four of FAA Order<br />
1050.1E. The purpose of an EA is to determine whether the proposed project will<br />
have significant impacts. Upon review of the EA findings, the FAA either issues<br />
project approval in the form of a Finding of No Significant Impact (FONSI) or directs<br />
the preparation of an Environmental Impact Statement (EIS) to investigate further<br />
the potential environmental impacts in detail before project approval can be<br />
granted. An EA typically takes between 6 and 24 months to prepare and obtain an<br />
FAA decision. A public hearing is not required but may be recommended by the<br />
FAA.<br />
DRAFT<br />
Environmental Impact Statement (EIS) – applies to those actions that have been<br />
found by experience to usually have significant environmental impacts. An EIS is<br />
the most intense level of environmental review and may take two to four years to<br />
complete. The FAA manages the preparation of the EIS and may issue a Record of<br />
Decision (ROD) after the Final EIS has been released.<br />
To determine if NEPA documentation for the proposed terminal project would be<br />
required, each element of KCAD’s Preferred Alternative and the other improvements<br />
listed on KCAD’s 5-year Capital Improvement Plan was reviewed to determine if a<br />
Federal Action would occur and then the project was appraised to determine the<br />
level of NEPA review that may be required.<br />
2<br />
FAA Order 1050.1E Environmental Impacts: Policies and Procedures. Chapter 2 NEPA <strong>Planning</strong> and<br />
Integration, 200e Applicability of NEPA Procedures to FAA Actions, (3) FAA Actions Subject to<br />
NEPA Review. March 20, 2006.<br />
Landrum & Brown Page 294<br />
April 2013
KANSAS CITY NEW TERMINAL STUDY<br />
ADVANCE TERMINAL PLANNING STUDY<br />
PROGRAM CRITERIA DOCUMENT<br />
DRAFT<br />
For most of the proposed developments projects, there is an associated Federal<br />
action, such as allocation of Federal funds or FAA approval of changes to the Airport<br />
Layout Plan (ALP) to reflect new development; therefore, NEPA would apply.<br />
Based on the type of projects and the anticipated impacts, it is recommended that<br />
an Environmental Assessment be pursued for this project.<br />
8.2.2 ALTERNATIVES TO BE CONSIDERED FOR FURTHER DETAILED<br />
ENVIRONMENTAL ANALYSIS<br />
Federal and state guidelines concerning the environmental review process require<br />
that all prudent, feasible, reasonable, and practicable alternatives that might<br />
accomplish the objectives of a project be identified and evaluated. Federal<br />
agencies may consider the applicant's purposes, needs, and common sense realities<br />
of a given situation in the development of alternatives. 3 Federal agencies may also<br />
afford substantial weight to the alternative preferred by the applicant, provided<br />
there is no substantially superior alternative from an environmental standpoint.<br />
While all the alternatives developed in the Master <strong>Planning</strong> process and advanced<br />
terminal planning process will be disclosed, it is anticipated that only two<br />
alternatives will be carried forward for detailed analysis of environmental impacts,<br />
the No Action and the Proposed Action/Preferred Alternative.<br />
8.3 Sustainability <strong>Planning</strong><br />
8.3.1 LOCAL SUSTAINABILITY INITIATIVES / ENVIRONMENTAL<br />
CONTEXT<br />
The City of Kansas City, Missouri is strongly committed to enhancing sustainability<br />
and the quality of life for its residents and visitors, as evidenced by development of<br />
the following initiatives and documents:<br />
<br />
<br />
DRAFT<br />
Climate Protection Plan: The City released its Climate Protection Plan in July<br />
2008 driven by the belief that greenhouse gas emissions can be reduced at<br />
the same time as the economy and quality of life are improved for businesses<br />
and citizens. The plan includes recommended goals for community-wide<br />
greenhouse gas reductions and actions to achieve the goals, as well as<br />
recommendations affecting the City’s climate protection planning process.<br />
Citywide Green Solutions Policies: In laying the groundwork for the Climate<br />
Protection Plan, the Kansas City Council adopted Resolution #070830,<br />
establishing the policy of the City to integrate green solutions in City<br />
planning and development processes. In addition, the City Manager adopted<br />
the Green Solutions Administrative Regulation (A.R. 5-5) to incorporate<br />
green solutions into City policies, projects, and programs.<br />
3<br />
Guidance Regarding NEPA Regulations, CEQ, 48 Federal Register 34263 (July 28, 1983).<br />
Landrum & Brown Page 295<br />
April 2013
KANSAS CITY NEW TERMINAL STUDY<br />
ADVANCE TERMINAL PLANNING STUDY<br />
PROGRAM CRITERIA DOCUMENT<br />
DRAFT<br />
<br />
<br />
Sustainability in Kansas City Brochure: As a complement to the City’s Green<br />
Solutions Policy and the Climate Protection Plan, which provide a roadmap for<br />
making the City’s vision of being a “certifiable green city” a reality, this<br />
brochure identified the City and regional initiatives designed to help achieve<br />
that goal.<br />
Green Building Ordinance No. 110235: It is the policy of the City that the<br />
design, construction, and operation of new facilities of any size and<br />
renovations in which the facility affected has at least 5,000 square feet of<br />
space, for which the City issues a request for qualifications for design<br />
services, design-build services, or conducts such services itself, shall conform<br />
to the LEED Gold rating or higher.<br />
Transportation Outlook 2040: Metropolitan Kansas City's long-range<br />
transportation plan, developed by the Mid America Regional Council (MARC)<br />
and adopted in June 2010, outlines a vision for the future relationship<br />
between transportation investments and land use in the region. The plan<br />
established a broad set of goals that cover areas ranging from<br />
transportation’s impacts on climate change and energy, to place-making, to<br />
the condition of existing transportation systems. While the plan focuses on<br />
surface transportation for the region, it acknowledges the importance of<br />
aviation and the region’s airports, stating that the Plan’s proper consideration<br />
of aviation planning activities will facilitate and achieve coordinated and<br />
comprehensive transportation planning within the region, thereby further<br />
supporting the overall transportation system goals of accessibility and<br />
economic vitality.<br />
<br />
<br />
Environmental Management System and Green Solutions Annual Report:<br />
The City’s Environmental Management System (EMS) was developed through<br />
a work group involving City employees from 12 departments. The EMS<br />
describes the structure of the City's internal environmental management<br />
program and specifies the best management practices to be followed by City<br />
employees in handling most commonly encountered environmentally<br />
sensitive tasks. The EMS is the focus of environmental orientation training<br />
received by every City employee, and is the standard used for the annual<br />
environmental audit of every City facility. The annual evaluation of each<br />
department’s progress in meeting environmental goals and the City’s efforts<br />
to incorporate green solutions into its programs, projects, and policies is<br />
reported in the EMS and Green Solutions Annual Report.<br />
DRAFT<br />
EnergyWorks KC Initiative: This initiative is designed to inform home and<br />
business owners of ways to reduce energy waste, increase comfort, and<br />
make a healthier live-work space. Through the web site<br />
www.EnergyWorksKC.org a variety of services are available to support home<br />
and business owners in the pursuit of reduced energy waste and increased<br />
energy efficiency. The initiative also includes development of<br />
recommendations for local and state policy changes in support of energy<br />
efficiency, creation of job opportunities, and public education and outreach.<br />
Landrum & Brown Page 296<br />
April 2013
KANSAS CITY NEW TERMINAL STUDY<br />
ADVANCE TERMINAL PLANNING STUDY<br />
PROGRAM CRITERIA DOCUMENT<br />
DRAFT<br />
<br />
<br />
<br />
<br />
Things We Can Do as Individuals to Reduce Greenhouse Gas Emissions:<br />
This brochure describes several quick and easy things that individuals can do<br />
in their homes and throughout their daily routines to do their part in reducing<br />
the amount of greenhouse gas emissions in the Kansas City area.<br />
A Million Lights Initiative: Kansas City was the first city in the nation to set<br />
the goal of changing one million light bulbs from traditional incandescent to<br />
energy-efficient compact fluorescent lights (CFLs), as part of the ENERGY<br />
STAR® national campaign to help consumers save money and energy<br />
through the switch. In 2008, the program reported that throughout the<br />
Kansas City metro area, over 1.6 million CFLs were purchased and/or<br />
distributed by the City and its partners. The program remains in effect today<br />
and continues to encourage residents and businesses to switch from<br />
incandescent to CFLs.<br />
City Environmental Improvement Goals: Each fiscal year, the City adopts<br />
environmental improvement goals for departmental implementation.<br />
The goals are administered in their respective departments by Environmental<br />
Coordinating Managers with progress towards attaining these goals reported<br />
in the City’s annual report to the City Manager at the end of the fiscal year.<br />
The goals are also stated on the City’s public web site.<br />
Sustainable Skylines <strong>Program</strong>: The U.S. EPA Region 7 has recognized<br />
Kansas City as a Sustainable Skylines Partner in its locally-led program to<br />
reduce air emissions and promote sustainability in urban environments.<br />
Greater Kansas City was chosen as one of the first pilot communities to<br />
implement this program, which provides a flexible framework for partners to<br />
integrate transportation, energy, land use, and air quality planning; yield<br />
measurable air quality benefits; promote collaboration among multiple<br />
stakeholders; and identify and leverage resources among partners.<br />
The specific projects under this program in the Kansas City area include:<br />
o<br />
o<br />
o<br />
o<br />
o<br />
o<br />
DRAFT<br />
KC Idle-Free – An idle-reduction campaign, working with public and<br />
private fleets to establish idle-free zones and assist the Kansas City<br />
metropolitan area in maintaining the national air quality standard for<br />
ozone.<br />
Be Water Wi$e – Water conservation and strategic landscaping projects<br />
with parks and homeowners associations to use less water and promote<br />
native plant species.<br />
Parking Lots to Parks – Curbing the urban heat island effect and reducing<br />
storm water runoff through sustainable parking lot design.<br />
Solar KC – Solar demonstration projects at schools and city-owned<br />
buildings to promote renewable, clean energy.<br />
Kansas City Future Forum – Action by individuals, businesses, and civic<br />
groups to reduce our environmental impact and become a green region.<br />
“Constructing” Clean Air – A diesel engine retrofits partnership with the<br />
heavy construction industry in Kansas City to reduce air pollution from<br />
construction equipment.<br />
Landrum & Brown Page 297<br />
April 2013
KANSAS CITY NEW TERMINAL STUDY<br />
ADVANCE TERMINAL PLANNING STUDY<br />
PROGRAM CRITERIA DOCUMENT<br />
DRAFT<br />
8.3.2 RELEVANT REGULATIONS / GUIDANCE<br />
The Leadership in Energy and Environmental Design (LEED ® ) Rating System,<br />
developed (in 2000) and administered by the U.S. Green Building Council (USGBC),<br />
is an internationally recognized mark of excellence for occupied buildings. LEED<br />
provides a framework to building owners and operators for identifying and<br />
implementing practical and measurable green building design, construction,<br />
operations, and maintenance solutions. Working throughout a building’s life cycle,<br />
LEED certification provides independent, third-party verification that the building<br />
was designed and built using strategies aimed at achieving high performance in key<br />
areas of human and environmental health: sustainable site development, water<br />
savings, energy efficiency, materials selection, and indoor environmental quality.<br />
Chicago Department of Aviation Sustainable Airport Manual<br />
The Chicago Department of Aviation (CDA) is embracing the best possible<br />
environmental, social, and fiscally responsible practices to enhance the quality of<br />
life and complement the overall mission and goals of the City of Chicago. In so<br />
doing, the CDA has developed the Sustainable Airport Manual (SAM), with a vision<br />
that it will become the global industry standard for sustainability planning,<br />
development, and everyday functions at airports around the world.<br />
When the original edition of the SAM was unveiled as the Sustainable Design<br />
Manual (SDM) in December of 2003, Chicago was the first in the nation to develop<br />
sustainability guidance specifically for airports. Numerous, wide-ranging projects<br />
have since been reviewed and rated according to the standards established by the<br />
SDM and SAM, resulting in the evolution of a unique process and many industry<br />
firsts:<br />
<br />
<br />
<br />
DRAFT<br />
Development of a rating system,<br />
Development of a green airplane certification award system, and<br />
Recognition of designers and contractors for sustainable accomplishments.<br />
The Sustainable Airport Manual (SAM) is an integral part of Chicago’s ongoing<br />
efforts toward implementing more environmentally sustainable buildings and civil<br />
infrastructure, incorporating best practice guidance for planning, operations and<br />
maintenance of all City airport facilities and functions, and those of its tenants.<br />
The purpose of the SAM is to integrate airport-specific sustainable planning and<br />
practices early in the design process, through planning, construction, operations,<br />
maintenance and all airport functions with minimal impact to schedule or budget.<br />
To achieve greater success, the SAM should be considered in every step of a<br />
project.<br />
Landrum & Brown Page 298<br />
April 2013
KANSAS CITY NEW TERMINAL STUDY<br />
ADVANCE TERMINAL PLANNING STUDY<br />
PROGRAM CRITERIA DOCUMENT<br />
DRAFT<br />
While certain elements of the SAM are specific to the CDA, they can easily be<br />
customized and interpreted for any airport’s unique environment. The vast<br />
majority of SAM’s guidance is already applicable to any airport. The SAM provides<br />
direction and is a guideline for incorporation of as many sustainable elements into a<br />
project as are feasible, beyond those elements that are required through an<br />
individual project’s contract specifications and design standards.<br />
The SAM has been drawn in large part from the LEED Green Building Rating<br />
System and the CDA strongly encourages all applicable airport projects to seek<br />
individual LEED certification in addition to incorporating sustainable elements to the<br />
greatest extent possible and practicable. The SAM is also based on existing federal,<br />
state, and local regulatory requirements with additional sustainable and best<br />
practice environmental strategies and considerations. The guidance provided does<br />
not supersede, but is intended to supplement such regulatory requirements.<br />
Los Angeles World Airports (LAWA) Sustainable Airport <strong>Planning</strong> Design<br />
and Construction Guidelines<br />
Los Angeles World Airports (LAWA) has developed sustainable practices that move<br />
beyond environmental stewardship and integrate economic growth (e.g. use of local<br />
contractors and suppliers) and social responsibility (e.g. implementing fair labor<br />
practices) in their operations. LAWA’s multi-level embrace of sustainability is<br />
enhanced by its use of the Triple Bottom Line philosophy, recognizing that in order<br />
to be sustainable, LAWA’s success should not only be measured by the traditional<br />
bottom line of financial performance but also by its impact on the local, regional<br />
and global economy, environment, and society. LAWA’s sustainability commitment<br />
not only shapes its internal business practices, but also its external relationships<br />
with its tenants, contractors, passengers, suppliers, peers and neighboring<br />
communities.<br />
DRAFT<br />
With the development of the Sustainable Airport <strong>Planning</strong>, Design and Construction<br />
Guidelines (LSAG), LAWA intends to meet its commitment to become the global<br />
leader in airport sustainability through building green infrastructure and being held<br />
to the highest sustainability standards. LSAG is included in all LAWA’s big<br />
documents, design specification and construction contracts. LSAG goes beyond<br />
LEED and provides a set of performance standards and a rating system for both<br />
horizontal and vertical airport projects. LSAG is a compilation of sustainable<br />
planning, design and construction practices that meet the unique circumstances and<br />
needs of an airport. LSAG builds upon the LEED rating systems for buildings.<br />
Because of this overlap between LSAG and LEED, LAWA recommends LEED silver<br />
certification for all building projects.<br />
8.3.3 EXAMPLES OF AIRPORT TERMINAL SUSTAINABLE DESIGN<br />
PROJECTS<br />
This section contains a review of sustainability programs at a selected set of other<br />
major U.S. airports that resulted in sustainable design, construction, and<br />
operation/maintenance of terminal buildings.<br />
Landrum & Brown Page 299<br />
April 2013
KANSAS CITY NEW TERMINAL STUDY<br />
ADVANCE TERMINAL PLANNING STUDY<br />
PROGRAM CRITERIA DOCUMENT<br />
DRAFT<br />
San Francisco International Airport (SFO) <strong>Terminal</strong> 2<br />
SFO’s mission is to be the airport of choice for passengers, the airlines, and for the<br />
industry; and they recognize the importance that environmental sustainability plays<br />
in helping achieve this goal. The Airport is committed to drastically reducing its<br />
environmental impact over the next decade by working to reduce contributions to<br />
global warming, improve air and water quality, reduce noise impacts, and preserve<br />
natural resources. During the past several years SFO has met many milestones in<br />
environmental achievements and resource conservation including the initiatives<br />
listed in this section.<br />
In November 2010, SFO announced that the designed renovation of the Airport’s<br />
<strong>Terminal</strong> 2 (SFO T2) is the first LEED Gold-registered airport terminal in the<br />
United States. The 640,000 square-foot terminal opened in April 2011 and features<br />
progressive sustainability measures that aim to inspire people to live more<br />
sustainably, as summarized below:<br />
<br />
<br />
<br />
Hydration Stations will enable flyers to fill reusable water bottles once past<br />
security, reducing the significant volume of waste created by single-use<br />
water bottles. While native San Francisco travelers will soon adapt to this<br />
amenity, travelers from other cities will also see these stations, triggering<br />
their awareness of the possibility of traveling with reusable water bottles.<br />
Designed to be a teaching tool, creative signage engages travelers and<br />
educates T2's more than 6 million visitors on the terminal's sustainable<br />
features.<br />
Local food: The terminal will feature local-organic food vendors, offering<br />
wholesome food grown and prepared in a healthful manner.<br />
Removing complexity: Three double-height, naturally illuminated spaces<br />
greet passengers, intuitively guiding them at key decision-making points,<br />
such as post-security, pre-baggage claim and the departure lounge.<br />
The natural daylight makes the terminal easier for travelers to navigate,<br />
creates a more healthy environment in which to travel, and helps save<br />
electricity used for lighting during the day.<br />
Building Materials Savings: By reusing a substantial portion of the<br />
infrastructure of the existing building in the renovated T2, SFO generated<br />
cost savings and reduced the global warming impact of the new terminal.<br />
<br />
The incorporation of energy efficient lighting and efficient machinery will<br />
reduce electrical energy consumption by 2.9 gigawatt hours per year, and<br />
natural gas consumption by 116,000 therms per year, resulting in a<br />
reduction of 1,640 tons of CO 2 emissions per year.<br />
Employees at SFO T2 also benefit from sustainable design elements that create a<br />
more sustainable and healthful workplace:<br />
<br />
DRAFT<br />
Take a Deep Breath: SFO’s innovative displacement ventilation system will<br />
use filtered air to improve indoor air quality, while using 20 percent less<br />
energy. The effect will be a more healthy work environment for terminal<br />
employees.<br />
Landrum & Brown Page 300<br />
April 2013
KANSAS CITY NEW TERMINAL STUDY<br />
ADVANCE TERMINAL PLANNING STUDY<br />
PROGRAM CRITERIA DOCUMENT<br />
DRAFT<br />
<br />
Completing a Multi-Modal Hub: The renovation will connect T2 to BART via<br />
SFO's AirTrain people mover system, so that employees and travelers alike<br />
can easily go from airport to city on mass transit.<br />
Abundant natural light: Skylights and clerestories bring daylight into the<br />
ticketing lobby and retail areas, providing a healthier working environment<br />
while significantly reducing electricity requirements during daylight hours.<br />
<br />
Educating the workforce: In addition to the multiple education and signage<br />
programs throughout the terminal, airport employees will have access to<br />
composting guides at all waste stations that explain the airport’s compost<br />
program, and how, as employees, they can contribute to the airport’s zero<br />
waste goal.<br />
In addition, as with other tenants, SFO’s concession tenants are encouraged to use<br />
green building materials for their facilities and will be required to recycle and<br />
compost.<br />
Los Angeles International Airport (LAX) Tom Bradley International<br />
<strong>Terminal</strong><br />
The rehabilitation of the 1 million-square-foot terminal completed in May 2010<br />
created new concourses and 2 boarding gates to accommodate larger aircraft such<br />
as the Boeing 787 and Airbus A380. At LAX, recycled content was used in glass<br />
walls, metal ceilings, and the carpet (backed with low-VOC adhesives).<br />
Additionally, more than 75 percent of the construction and demolition waste was<br />
recycled or salvaged. New, efficient HVAC and lighting systems were installed—and<br />
green power will came from photovoltaic arrays and from the Los Angeles<br />
Department of Water and Power, which provided 100 percent of the airport’s<br />
electricity from renewable sources.<br />
DRAFT<br />
The Airport is currently increasing the capacity of the west side of the terminal<br />
under the Bradley West Project. This project will add additional gates 18 roomier<br />
boarding gates/waiting areas with 9 able to accommodate new generation aircraft<br />
(Boeing 787 and Airbus A380) in addition to a Great Hall for dining, retail shopping<br />
and passenger amenities beyond passenger security screening.<br />
In accordance with LAWA’s LSAG, the Bradley West Project will optimize the use of<br />
recycles building materials, minimize the amount of energy used in construction<br />
and optimize energy efficiency. In an effort to minimize adverse environmental<br />
impacts from this project on surrounding areas, LAWA will; recycle construction<br />
materials, place concrete mixers and other equipment on site to reduce the number<br />
of trips construction vehicles must take, designate specific routes that construction<br />
vehicles must use, retrofit construction equipment with emission and noise<br />
reduction devices, and control dust.<br />
Landrum & Brown Page 301<br />
April 2013
KANSAS CITY NEW TERMINAL STUDY<br />
ADVANCE TERMINAL PLANNING STUDY<br />
PROGRAM CRITERIA DOCUMENT<br />
DRAFT<br />
Boston Logan International Airport <strong>Terminal</strong> A<br />
<strong>Terminal</strong> A at Boston Logan International Airport is the world's first air terminal to<br />
earn LEED certification. The terminal was designed with Massport’s Sustainable<br />
Design Goals, in mind, including:<br />
<br />
Asset Management – Increase value and revenue generating potential of<br />
projects<br />
Environmental Benefits/Permitting Strategy – Reduced impacts and<br />
permitting time/costs<br />
<br />
<br />
Citizenship – Positive community impact<br />
Design Excellence – Innovative, aesthetic and responsible design<br />
Sustainable elements incorporated into the design of <strong>Terminal</strong> A include:<br />
<br />
<br />
<br />
<br />
<br />
<br />
Sustainable sites ‐ Curb design promotes HOV access, including bus and<br />
subway; bicycle racks installed near bus and subway stops.<br />
Energy conservation ‐ roofing and paving materials that reflect solar<br />
radiation, master lighting control systems and photo sensors; windows that<br />
maximize natural lighting; low E glass that reduces heat load<br />
Water conservation ‐ low‐flow toilets, waterless urinals, and drip irrigation.<br />
Materials and resources conservation ‐ >10 percent from recycled sources.<br />
Atmosphere protection ‐ no CFC‐based, HCFC‐based, or halon refrigerants.<br />
Enhanced indoor environmental air quality ‐ low and VOC‐free adhesives,<br />
sealants, paints, and carpets; smoking is prohibited inside the terminal<br />
building.<br />
Sustainable elements incorporated into the daily operation of <strong>Terminal</strong> A include:<br />
<br />
<br />
<br />
<br />
<br />
400‐MHz Power/Preconditioned Air at all contact gates<br />
High Occupancy Vehicle (HOV) Promotion<br />
Recycling <strong>Program</strong><br />
DRAFT<br />
Ground Service Equipment (GSE) Conversion<br />
Assist tenants to meet sustainable goals<br />
Landrum & Brown Page 302<br />
April 2013
KANSAS CITY NEW TERMINAL STUDY<br />
ADVANCE TERMINAL PLANNING STUDY<br />
PROGRAM CRITERIA DOCUMENT<br />
DRAFT<br />
Atlanta Hartsfield-Jackson International Airport, Maynard H. Jackson Jr.<br />
International <strong>Terminal</strong><br />
Opened in May 2012, the 1.2 mil square-foot Maynard H. Jackson Jr. International<br />
<strong>Terminal</strong> has a goal of achieving LEED Silver certification. The City of Atlanta has<br />
planned, designed, and is constructing the terminal in such a way to reflect its<br />
ongoing commitment to sustainability, including the following major elements:<br />
<br />
<br />
<br />
<br />
<br />
<br />
Construction: Contractors were required to use recycled and/or regionally<br />
produced construction materials and sustainable-certified wood products.<br />
Construction waste management programs diverted as much as 75 percent<br />
from disposal.<br />
Water reclamation: One of the most impressive sustainability features of the<br />
international terminal project is a 25,000-cubic-foot “water box.”<br />
The structure collects rainwater from the roof and cleanses it through a<br />
series of filters before releasing it back into the environment. The process<br />
greatly reduces the building’s environmental impact on surrounding<br />
groundwater.<br />
Recycling: The Airport’s recycling program is being extended to the<br />
international terminal and Concourse F. The program will include<br />
source-separated recycling, organics and composting containers.<br />
Water conservation: Low-flow restroom fixtures throughout the facility,<br />
along with highly efficient cooling and heating systems, will cut water usage,<br />
saving more than 40,000 gallons annually.<br />
Carbon footprint reduction: Several sustainable-design features of the project<br />
will limit the overall greenhouse gases emitted as a result of international<br />
terminal operations.<br />
Energy conservation: Environmental conservation played a role in the<br />
selection of finishes and building elements, such as insulated glass for the<br />
front façade and throughout the building. Energy-efficient lighting and<br />
equipment also greatly will reduce the use of electricity and natural gas.<br />
Gate facilities: All Concourse F gates provide preconditioned air and 400<br />
hertz power supplies for aircraft. This cuts jet fuel use dramatically, because<br />
aircraft auxiliary power units are not required to power or cool aircraft at the<br />
gates.<br />
<br />
DRAFT<br />
Plug-in electrical chargers for ground services equipment: These chargers<br />
will be available at all Concourse F gates, saving fuel and reducing<br />
greenhouse gas emissions.<br />
Preferential parking for alternative fuel vehicles: The international hourly<br />
parking deck will feature 14 close-in parking spaces for alternative fuel<br />
vehicles as well as 14 parking spaces for vanpools and carpools.<br />
Indoor air quality: To ensure the quality of indoor air, the international<br />
terminal project incorporates low-chemical-emitting paints, sealants,<br />
carpeting and adhesives as well as environmentally friendly cleaning products<br />
and techniques. Increased ventilation and monitoring of incoming outdoor<br />
air also will enhance air quality.<br />
Landrum & Brown Page 303<br />
April 2013
KANSAS CITY NEW TERMINAL STUDY<br />
ADVANCE TERMINAL PLANNING STUDY<br />
PROGRAM CRITERIA DOCUMENT<br />
DRAFT<br />
<br />
Educational outreach: Quick Read (QR) codes, which passengers can scan<br />
with their smartphones, will link to web-based information about<br />
sustainability initiatives.<br />
8.3.4 PARTNERING OPPORTUNITIES<br />
There are many opportunities for grants, rebates, incentives and credits available<br />
from Federal, State and private sources, for which units of local government can<br />
apply. Resources to research such programs include the following:<br />
<br />
www.dsireusa.org is a comprehensive source of information on state, local,<br />
utility and federal incentives and policies that promote renewable energy and<br />
energy efficiency.<br />
eCivis ® Grants Network (www.ecivis.com) provides grants management<br />
software for accurate grants information, reporting, and management used<br />
by governments and community organizations.<br />
<br />
ACRP Synthesis 24: Strategies and Financing Opportunities for Airport<br />
Environmental <strong>Program</strong>s (http://onlinepubs.trb.org/onlinepubs/acrp/<br />
acrp_syn_024.pdf). The purpose of this ACRP synthesis is to provide a<br />
comprehensive summary of those funding opportunities, programs, and<br />
strategies available to airports to assist them in meeting their environmental<br />
responsibilities or undertaking environmental initiatives.<br />
Depending on the technology/initiative under consideration, there may also be<br />
funding available for participation in a test or demonstration program.<br />
8.3.5 DEVELOPMENT OF PROGRAM SUSTAINABILITY GOALS<br />
Sustainability has been at the forefront during the New <strong>Terminal</strong> <strong>Advance</strong> <strong>Planning</strong><br />
<strong>Study</strong>. One of the criteria in the selection of the central terminal core location for<br />
the terminal development as opposed to the south site included efforts to try and<br />
take advantage of existing infrastructure. This would result in less of an<br />
environmental impact as opposed to building on a green site which would cause<br />
destruction of natural resources including wetlands, streams, and natural vegetated<br />
habitat. A sustainable approach was also considered for the specific site of the<br />
terminal development within the central terminal core.<br />
Next Steps<br />
DRAFT<br />
The City has adopted environmental improvement goals as listed below. As the<br />
planning and design continue, a sustainability policy or mission statement specific<br />
to the terminal development project should be developed with KCAD.<br />
Goal 1 – Improve energy management by increasing energy efficiency in production<br />
processes, incorporating energy conservation into facility operations and designs, and<br />
using more renewable or sustainable energy resources.<br />
Goal 2 – Demonstrate improvements in preservation and restoration of natural<br />
resources and habitats such as wetlands, forests, water bodies and prairies, as well as<br />
manage facility properties and buildings to reduce environmental impacts.<br />
Landrum & Brown Page 304<br />
April 2013
KANSAS CITY NEW TERMINAL STUDY<br />
ADVANCE TERMINAL PLANNING STUDY<br />
PROGRAM CRITERIA DOCUMENT<br />
DRAFT<br />
Goal 3 – Reduce air emissions from facilities through pollution prevention initiatives<br />
and emission control strategies. Reduce air emissions from mobile sources by reducing<br />
environmental impacts of shipping and receiving, fleet operations and employee<br />
commuting.<br />
Goal 4 – Incorporate green solutions, whenever possible and appropriate, during the<br />
planning process into City policies, projects and programs.<br />
Goal 5 – Protect employee health and the environment by ensuring that training<br />
requirements for individuals are identified; that training opportunities are made<br />
available and are carried out; that training is recorded and tracked; and that training<br />
requirements are monitored, revised, and refresher training provided, as appropriate,<br />
to maintain competence.<br />
Goal 6 – Create a cleaner City by implementing actions that reduce illegal dumping<br />
and improve the City's response to illegal dumping.<br />
In discussion with KCAD preliminary goals include LEED certification, a potential<br />
green roof on top of the proposed new six level parking garage and the desire to<br />
construct a more efficient stormwater and glycol collection system for the new<br />
terminal. A baseline inventory should be conducted for defined sustainability<br />
categories in order to set targets for future performance. Several of the<br />
Sustainability categories are listed below.<br />
<br />
<br />
<br />
<br />
<br />
<br />
Air Emissions Reductions<br />
Materials Management<br />
Energy Initiatives<br />
Water Quality<br />
Construction Practices<br />
DRAFT<br />
Community Outreach and stakeholder relationships<br />
Further the Airport could take this opportunity to develop a sustainable plan not<br />
just for the new terminal development project but for all airport activities.<br />
Landrum & Brown Page 305<br />
April 2013
KANSAS CITY NEW TERMINAL STUDY<br />
ADVANCE TERMINAL PLANNING STUDY<br />
PROGRAM CRITERIA DOCUMENT<br />
DRAFT<br />
9. PROGRAM IMPLEMENTATION<br />
9.1 Introduction<br />
The preceding chapters presented a description of the development projects<br />
associated with the construction of a new 42 gate terminal to accommodate the<br />
projected aviation needs at Kansas City International Airport (KCI) over the next<br />
20 years (2032). This chapter presents a description of the projects associated<br />
with the new terminal program and each development phase along with a<br />
preliminary timeline for implementing the new terminal program. Also included is<br />
an order-of-magnitude cost estimate for the proposed new terminal program<br />
projects.<br />
9.2 <strong>Terminal</strong> Development Phasing Summary<br />
In practice, airport projects will be undertaken only when demand warrants, rather<br />
than in accordance with a projected schedule developed in advance. Factors that<br />
can trigger the need to proceed with a particular airport development project can<br />
range from tenant demands for landside and support facilities, to airside and<br />
terminal capacity requirements, to renewing and replacing aging and inefficient<br />
infrastructure. The need for each development project will materialize as the<br />
associated demand level that triggers the need for expansion increases. However,<br />
in the case of the new terminal program most of the associated projects will need<br />
to be implemented in a very short and sequenced timeframe. As such, the<br />
proposed new terminal projects have been divided into three phases with the<br />
beginning of ground breaking activities to opening day, along with a post opening<br />
day set of projects.<br />
9.2.1 PHASE 1 TERMINAL DEVELOPMENT PROJECTS<br />
The Phase 1 projects are those associated with pre-construction activities and<br />
implementation of temporary construction works needed to open up the existing<br />
<strong>Terminal</strong> A site for development of the new terminal development program. These<br />
projects include the following:<br />
<br />
<br />
<br />
DRAFT<br />
Consolidation of remaining airlines to <strong>Terminal</strong> C<br />
Construction of temporary roads to maintain access to <strong>Terminal</strong>s B and C<br />
Construction of temporary utility connections to maintain utility access to<br />
<strong>Terminal</strong>s A and C<br />
Landrum & Brown Page 306<br />
April 2013
KANSAS CITY NEW TERMINAL STUDY<br />
ADVANCE TERMINAL PLANNING STUDY<br />
PROGRAM CRITERIA DOCUMENT<br />
DRAFT<br />
9.2.2 PHASE 2 TERMINAL DEVELOPMENT PROJECTS<br />
The Phase 2 projects are the projects associated with construction of the initial<br />
opening phase of the new terminal and parking garage. These projects include the<br />
following:<br />
<br />
<br />
<br />
Construction of a new 37 gate terminal facility and associated roadways<br />
Construction of the first phase of a new 7,500 space parking garage with<br />
a commercial vehicle plaza and associated access roadways<br />
Construction of a new aircraft apron and taxiway/taxilane system (Phase<br />
1A, 1B and 1D)<br />
Construction of a new common use aircraft deicing ramp area (Phase 1C)<br />
and storage facility<br />
<br />
Construction of a new two-level terminal curbfront and loop roadway<br />
9.2.3 PHASE 3 TERMINAL DEVELOPMENT PROJECTS<br />
The Phase 3 projects are projects that must be completed after all airlines are<br />
relocated from <strong>Terminal</strong> B to the new terminal. These projects include the<br />
following:<br />
<br />
<br />
Construction of the second phase of the new parking garage (south wing)<br />
Construction of the new aircraft apron and taxiway/taxilane system (Phase<br />
2A and 2C)<br />
Construct a new common use aircraft deicing ramp area (Phase 2B)<br />
<br />
Construction of the final tie-ins of the upper-level terminal curbfront and loop<br />
roadway<br />
9.2.4 POST OPENING DAY (2025) and BEYOND TERMINAL<br />
DEVELOPMENT PROJECTS<br />
The post opening day projects are not anticipated to be needed as a part of the<br />
initial build (2025). The post opening day terminal development projects include<br />
the following:<br />
<br />
DRAFT<br />
Expansion (as needed) of the terminal to 42 gates<br />
Landrum & Brown Page 307<br />
April 2013
KANSAS CITY NEW TERMINAL STUDY<br />
ADVANCE TERMINAL PLANNING STUDY<br />
PROGRAM CRITERIA DOCUMENT<br />
DRAFT<br />
9.3 Capital Costs of the New <strong>Terminal</strong> <strong>Program</strong><br />
Table 9.3-1, <strong>Terminal</strong> Development <strong>Program</strong> Capital Costs, presents a<br />
summary of capital costs for the new terminal program. Estimated construction<br />
costs are in 2013 dollars and include “soft” costs associated with services for design<br />
and program/construction management. A 15 percent estimating contingency has<br />
been added to the construction costs, along with a five percent owner’s<br />
contingency, seven percent design/engineering, ten percent program/construction<br />
management, and one percent for permits, testing, and inspection. When a<br />
construction time period is determined, it is suggested that the costs be inflated to<br />
the proposed construction year of a project.<br />
Table 9.3-1<br />
TERMINAL DEVELOPMENT PROGRAM CAPITAL COSTS<br />
DEVELOPMENT PHASE COST ($2013)<br />
<strong>Terminal</strong> $680,740,825<br />
Landside 319,761,975<br />
Civil Airside $203,235,630<br />
CUP Modifications $19,609,043<br />
TOTAL $1,223,347,473<br />
9.4 Enabling Projects<br />
DRAFT<br />
This section of the PCD describes the projects that will help facilitate the<br />
development of the new terminal at Site A. Enabling projects identified include<br />
temporary access roadways, temporary and relocated utility lines, and other<br />
enabling projects and are described above as Phase 1 <strong>Terminal</strong> Development<br />
Projects.<br />
9.4.1 TEMPORARY ACCESS ROADWAYS<br />
In order to isolate the existing <strong>Terminal</strong> A site for construction of the new terminal<br />
while maintaining access to <strong>Terminal</strong>s B and C a series of temporary roadway<br />
connections need to be constructed. These temporary roadways are depicted in<br />
Figure 9.4-1, Temporary Access Roadways, below.<br />
Landrum & Brown Page 308<br />
April 2013
KANSAS CITY NEW TERMINAL STUDY<br />
ADVANCE TERMINAL PLANNING STUDY<br />
PROGRAM CRITERIA DOCUMENT<br />
DRAFT<br />
Figure 9.4-1<br />
TEMPORARY ACCESS ROADWAYS<br />
Parking traffic crosses outbound<br />
<strong>Terminal</strong> B flow<br />
Commercial access to <strong>Terminal</strong> C –<br />
reverse flow<br />
Temporary connectors from Cookingham Drive to International Circle and<br />
International Circle to both the <strong>Terminal</strong> B and <strong>Terminal</strong> C access ramps would be<br />
constructed to route inbound traffic to <strong>Terminal</strong>s B and C without having to travel<br />
through the new terminal construction site. Likewise, temporary connectors from<br />
<strong>Terminal</strong>s B and C access ramps to a new temporary exit roadway system would be<br />
constructed ass shown in Exhibit 9.4-1. Once complete these temporary roadways<br />
would allow for unencumbered access to <strong>Terminal</strong>s B and C during the construction<br />
of the new terminal and its associated infrastructure improvements. Once the new<br />
terminal is open for operations it is anticipated that the temporary roadways would<br />
be removed.<br />
9.4.2 TEMPORARY AND RELOCATED UTILITY LINES<br />
Parking traffic crosses outbound<br />
<strong>Terminal</strong> C flow<br />
DRAFT<br />
In order to maintain access to <strong>Terminal</strong>s B and C to critical utility infrastructure<br />
during construction, a number of utility systems will need to be temporarily<br />
rerouted during construction. These systems include a temporary or secondary<br />
connection of the aircraft hydrant fueling system bypassing the <strong>Terminal</strong> A site, a<br />
new connector from the chilled water plant to <strong>Terminal</strong>s B and C, and new<br />
connectors for the of the 12.5 KV duct bank and airfield lighting systems.<br />
These new and/or temporary infrastructure systems are necessary to facilitate<br />
Landrum & Brown Page 309<br />
April 2013
KANSAS CITY NEW TERMINAL STUDY<br />
ADVANCE TERMINAL PLANNING STUDY<br />
PROGRAM CRITERIA DOCUMENT<br />
DRAFT<br />
unencumbered connection to critical utility systems necessary to maintain full<br />
operations at <strong>Terminal</strong>s B and C during the construction of the new terminal and<br />
parking garage.<br />
9.4.3 OTHER ENABLING PROJECTS<br />
One of the first projects needed to allow for the new terminal program to move<br />
forward is the relocation of existing airlines on <strong>Terminal</strong> A to <strong>Terminal</strong> C. These<br />
airlines include United Airlines and US Airways. United and US Airways are<br />
currently operating in <strong>Terminal</strong> A and plans are under development to consolidate<br />
these airlines with the other airlines already operating on <strong>Terminal</strong> C today. It has<br />
been determined that there is adequate space on <strong>Terminal</strong> C to accommodate the<br />
United and US Air operations without any operational impacts to the other airlines.<br />
It is anticipated that these move would take place well in advance of start of<br />
construction of the new terminal in order to not have a negative effect on airline<br />
operations.<br />
9.5 LEED Gold Certification<br />
The City of Kansas City, Missouri currently has a requirement that all new public<br />
projects built in their jurisdiction achieve a LEED Gold Rating from the U.S. Green<br />
Building Council. Although a terminal building may be designed in a manner to<br />
meet LEED Gold standards, there are many factors that need to be taken into<br />
consideration as to which level of LEED certification is appropriate and/or should be<br />
achieved. However, in order to plan for the potential to include LEED Gold design<br />
elements in the new terminal, the program capital cost estimate includes a three<br />
percent contingency factor for incorporating LEED Gold elements in to the terminal<br />
building design.<br />
DRAFT<br />
The following list contains items for consideration with the goal of reaching LEED<br />
Gold. Each item needs to be evaluated to determine the potential of saving energy<br />
and/or resources versus the project cost (additional expense, schedule delay,<br />
technical feasibility, etc.).<br />
1. Compare Point of Use (POU) Pre-Conditioned Air (PCA) and Central<br />
PCA: PCA is used to provide air conditioning and heating inside aircraft while<br />
parked at the gate. This provides passenger comfort and allows the aircraft<br />
to turn off its auxiliary power unit, thereby saving jet fuel and the associated<br />
emissions. Analysis is required to determine if a centralized PCA system is<br />
cost effective over Ground Power Units. Items to consider include first costs,<br />
operation and maintenance, system diversity, space requirements and<br />
flexibility for the various aircraft planned at KCI airport.<br />
2. Rain Harvesting: Collect rainwater to use for irrigation and other nonpotable<br />
water uses. Evaluate rainwater collection system cost and space<br />
required versus amount of treated water savings.<br />
Landrum & Brown Page 310<br />
April 2013
KANSAS CITY NEW TERMINAL STUDY<br />
ADVANCE TERMINAL PLANNING STUDY<br />
PROGRAM CRITERIA DOCUMENT<br />
DRAFT<br />
3. Grey Water for Restroom Use: Use pipe water from grey water storage to<br />
use for flushing bathroom fixtures. Evaluate system capacity and feasibility<br />
for the New <strong>Terminal</strong> and investigate the type of filtration system needed.<br />
Determine code restrictions for this type of project<br />
4. Ground Source Equipment (GSE) Electrification: Provide the ability for<br />
KCI to use electric GSE rather than those with internal combustion engines.<br />
Electric GSE will eliminate the need for diesel fuel and the associated<br />
greenhouse gas emissions. It has been estimated that electric GSE are<br />
90 percent cleaner and 75 percent less expensive to operate — even after<br />
taking power plant emissions into account. These savings need to be<br />
weighed against the additional electrical service needed and space required<br />
for GSE chargers.<br />
5. Day Lighting and Lighting Controls: Work with project architects to<br />
evaluate day lighting potential with the building envelope design.<br />
Investigate appropriate lighting controls balancing energy savings with the<br />
Airport’s light requirements, as public safety is an issue.<br />
6. Energy Management Control System (EMCS) Energy Reduction<br />
Strategies: Propose strategies to be programmed into the EMCS that will<br />
save energy while maintaining the Airport’s fundamental mission.<br />
7. Monitoring and Verification Strategies (M&V): Consider appropriate<br />
energy measurement instrumentation and software with the goal of<br />
maintaining energy and water savings into future years.<br />
8. Biofuels & CNG for Vehicles: It is highly probable that GSE electrification<br />
will not be 100 percent and consequently will need some fuels. Look at<br />
options and feasibility for alternative fuels for Airport vehicles.<br />
DRAFT<br />
9. Recycling <strong>Program</strong>: Outline a recycling program for the demolished<br />
pavement and construction materials. Develop a second recycling program<br />
for the long term regarding airport waste, i.e., sorting facility for carbon<br />
waste streams to go to composting, metals for potential sale, and deicing<br />
fluid for sale in secondary markets.<br />
10.Solar PV: This was discussed at a previous meeting with KCP&L. KCP&L<br />
resource management group provided the following “ballpark” information for<br />
renewable energy incentives regarding a renewable energy system size<br />
range equal to 500 to 1000 kW:<br />
Any renewable - $30-$35/MWh<br />
Solar RECs would be another $8 to $10/MWh in addition to the<br />
renewable energy<br />
11.Cogeneration: The price of electricity is too low to justify. KCP&L resource<br />
management group provided the following “ballpark” information for<br />
renewable energy incentives regarding a renewable energy system size<br />
range equal to 500 to 1000 kW:<br />
Co-Gen: $25-$35 / MWh<br />
12.Thermal Energy Storage (TES): There is no “on-peak” or time of day<br />
demand shift opportunity and no up-front incentive for TES by KCP&L.<br />
Landrum & Brown Page 311<br />
April 2013
KANSAS CITY NEW TERMINAL STUDY<br />
ADVANCE TERMINAL PLANNING STUDY<br />
PROGRAM CRITERIA DOCUMENT<br />
DRAFT<br />
9.6 Implementation Timeline<br />
There are several elements needed to implement the development of the new<br />
terminal and its associated projects. Figure 9.6-1, Preliminary <strong>Program</strong><br />
Implementation Timeline presents an early schedule for implementing actions<br />
required to develop the new terminal program. These elements include completing<br />
an environmental assessment in accordance with NEPA, selecting a program<br />
manager, the construction tender process, and the overall construction process. It<br />
is anticipated that the projected opening day of the first phase (Phase 1 and 2<br />
projects) of the new terminal would be 1-February-2019 with subsequent phases<br />
(Phase 3 projects) opening later that same year. Additional phases of the terminal<br />
program beyond the 2025 requirements would be developed as needed and when<br />
demand warrants their construction.<br />
Figure 9.6-1<br />
PRELIMINARY PROGRAM IMPLEMENTATION TIMELINE<br />
NEW TERMINAL - PRELIMINARY PROGRAM SCHEDULE<br />
Duration<br />
Estimated Estimated<br />
(Calendar<br />
Start Date End Date<br />
Days)<br />
Description<br />
Environmental Assessment<br />
29-May-13 12-Jul-13 45 Publish Draft EA/Public Comment Period<br />
27-Jun-13 27-Jun-13 1 Public Workshop/ Public Hearing<br />
30-Aug-13 30-Aug-13 1 Publish Final EA<br />
30-Aug-13 30-Sep-13 10-30 FAA prepares FONSI<br />
Project <strong>Program</strong> Management<br />
3-Jun-13 10-Mar-14 280 Select <strong>Program</strong> Manager<br />
17-Mar-14 13-Oct-14 210 Select Design Architect/Engineers<br />
17-Mar-14 28-Jan-19 1,778 <strong>Program</strong> Management/Construction Management<br />
20-Oct-14 16-May-16 574 <strong>Terminal</strong> Design<br />
20-Oct-14 12-Oct-15 357 Parking Structure Design<br />
20-Oct-14 5-Oct-15 350 Civil Airside Design<br />
20-Oct-14 18-Jan-16 455<br />
Landside Roadway Design - Multiple Bid<br />
Packages/Phases<br />
20-Oct-14 19-Oct-15 364 Utilities Design - Multiple Bid Packages/Phases<br />
Construction Tender Process<br />
12-Oct-15 11-Apr-16 182<br />
Civil Airside Construction Tender Process - D-B-B FAA<br />
Grant Eligible<br />
25-Jan-16 25-Jul-16 182<br />
Landside Roadways Construction Tender Process - D-<br />
B-B Multiple Phases/Packages<br />
26-Oct-15 2-May-16 189<br />
Utilities Construction Tender Process - D-B-B Multiple<br />
Phases/Packages<br />
14-Sep-15 27-Jun-16 287 <strong>Terminal</strong> Construction Tender Process - CM @ Risk<br />
8-Jun-15 8-Feb-16 245<br />
Parking Structure Construction Tender Process - CM<br />
@ Risk or Design/Build or D-B-B<br />
Construction Process<br />
28-Jun-16 12-Dec-18 897 <strong>Terminal</strong> Construction<br />
18-Apr-16 12-Mar-18 693 Apron/Airfield Construction<br />
15-Feb-16 12-Feb-18 728 Parking Structure Construction<br />
19-Oct-15 19-Sep-18 1,066 Landside Roadways Construction - Multiple Phases<br />
19-Oct-15 19-Sep-18 1,066 Utilities Construction - Multiple Phases<br />
1-Feb-19 1-Feb-19 1 <strong>Terminal</strong> Opening Day<br />
DRAFT<br />
Landrum & Brown Page 312<br />
April 2013
KANSAS CITY NEW TERMINAL STUDY<br />
ADVANCE TERMINAL PLANNING STUDY<br />
PROGRAM CRITERIA DOCUMENT<br />
DRAFT<br />
9.7 <strong>Program</strong> Delivery Methods<br />
There are several methodologies that could be employed to implement the new<br />
terminal development program. The program delivery methods are generally<br />
divided in to traditional and non-traditional concepts. Examples of traditional<br />
delivery methods include a design-bid-build methodology and a design-build<br />
methodology. An example of a non-traditional delivery method would be to find an<br />
entity that would finance, design, construct, operate and maintain the new terminal<br />
under a long-term operating and lease agreement with the City.<br />
Below is a brief description of each of these methods of delivery contrasting their<br />
advantages and disadvantages to the KCAD.<br />
9.7.1 DESIGN-BID-BUILD<br />
Design-Bid-Build is the most common form of project delivery. It is typically<br />
executed in three phases with three prime players. Many times an owner would<br />
need to also hire a <strong>Program</strong> Manager/Construction Manager to augment their staff<br />
to assist in overseeing the management and implementation of the construction<br />
program. Some features of the methodology include:<br />
Independent contracts between the owner and the architect and the owner<br />
and the contractor<br />
Results in a linear sequence of work<br />
Common with public owners with requirements to select low bid<br />
Below are listed some of the advantages<br />
and disadvantages of this delivery method.<br />
Advantages<br />
Widespread use in industry<br />
Familiarity among owners<br />
Clear roles assigned to each party<br />
Design complete prior to construction<br />
Linear process<br />
Disadvantages<br />
DRAFT<br />
Relatively lengthy process<br />
Multiple contracts to manage<br />
Lacks single point of responsibility<br />
Owner at-risk for detecting design/ construction errors<br />
Construction costs unknown until contract award<br />
Change orders and delay claims are more likely<br />
Landrum & Brown Page 313<br />
April 2013
KANSAS CITY NEW TERMINAL STUDY<br />
ADVANCE TERMINAL PLANNING STUDY<br />
PROGRAM CRITERIA DOCUMENT<br />
DRAFT<br />
9.7.2 DESIGN-BUILD<br />
Design-Build is also a fairly common form of project delivery in today’s construction<br />
industry. In this case, an owner contracts with a single entity that would be<br />
responsible for delivery of both design and construction services. With this delivery<br />
method a contractor is usually in the lead with a design team as a sub-contractor.<br />
Similar to the Design-Bid-Build process, many times an owner would need to also<br />
hire a <strong>Program</strong> Manager/Construction Manager to augment their staff to assist in<br />
overseeing the management and implementation of the construction program.<br />
Some features of the methodology include:<br />
Single point of responsibility<br />
Results in a shorter delivery period work<br />
Becoming increasingly more common with public owners looking to minimize<br />
risk<br />
The process for implementing this method of<br />
project delivery would include:<br />
Two step process: design and<br />
construction<br />
Design is completed by<br />
architect/engineer<br />
Construction is completed by<br />
contractor<br />
Early cost commitment is made<br />
Below are listed some of the advantages<br />
and disadvantages of this delivery method.<br />
Advantages<br />
Single point of responsibility<br />
Minimizes owner’s risks<br />
Shortened project delivery time (varies)<br />
Guaranteed pricing on a project<br />
Reduces change orders<br />
Minimized claims and damage<br />
Better design control<br />
Disadvantages<br />
DRAFT<br />
Complex delivery method<br />
Lack of direct communication between owner/architect and owner/contractor<br />
Potential for compromises in quality to meet budget<br />
Landrum & Brown Page 314<br />
April 2013
KANSAS CITY NEW TERMINAL STUDY<br />
ADVANCE TERMINAL PLANNING STUDY<br />
PROGRAM CRITERIA DOCUMENT<br />
DRAFT<br />
The figure below graphically depicts the timing differences in the two previously<br />
describe delivery methods.<br />
9.7.3 FINANCE, DESIGN, CONSTRUCT, OPERATE AND MAINTAIN<br />
This delivery method is very similar to the Design-Build delivery method in terms of<br />
the overall timing of the design and construction process. Where it differs is where<br />
the contracted entity also brings the necessary financing to develop the terminal<br />
program in exchange for a long-term lease to operate and maintain the terminal<br />
facilities. The term on the lease is usually tied to the amount of time needed to<br />
recoup the initial investment made by the contracted entity. This methodology is<br />
used in many markets around the world and is increasingly becoming a viable<br />
option for airport owners in this country that have difficulties in financing large<br />
development programs. The advantages to this methodology are that the owner<br />
would not need to arrange for financing of the terminals program and would only<br />
coordinate with one management entity. Disadvantages to this delivery method<br />
are that the owner would lose some level of control during the design and<br />
construction process and would lose the management of the terminal asset for the<br />
duration of the lease period.<br />
DRAFT<br />
It is recommended that KCAD continue to keep their options open and continue to<br />
explore both traditional and non-traditional project delivery methods.<br />
Landrum & Brown Page 315<br />
April 2013
KANSAS CITY NEW TERMINAL STUDY<br />
ADVANCE TERMINAL PLANNING STUDY<br />
PROGRAM CRITERIA DOCUMENT<br />
DRAFT<br />
10. FINANCIAL IMPLEMENTATION PLAN<br />
Objective: Draft a document that defines the key inputs, assumptions, and<br />
conclusions of the financial analysis.<br />
Description: The final draft working paper will present the results of the preceding<br />
analyses by outlining the overall KCI terminal development plan and the<br />
recommended refinements to the new South <strong>Terminal</strong> Complex Plan based on<br />
financial feasibility.<br />
Deliverables: Copies of the draft terminal development financial plan working<br />
paper will be prepared for distribution to the KCAD management for their review<br />
and comment. In addition, after review and revision an Executive Summary of the<br />
working paper, approximately six (6) to eight (8) pages in size, will be developed at<br />
a high quality, suitable for officials, that addresses the key issues and findings of<br />
the working paper.<br />
10.1 Cost and Affordability of New Replacement <strong>Terminal</strong><br />
10.1.1 PROJECT OVERVIEW<br />
The Kansas City International Airport (KCI) has commissioned a financial analysis<br />
and review of the construction of a new single terminal complex to replace the<br />
airport’s antiquated three terminal complex. The new terminal is projected to open<br />
for operations in the 1 st quarter of fiscal year (FY) 2019 with construction beginning<br />
in FY2016. This section of the report presents a summary of the estimated project<br />
costs, the assumed sources of project funding, and the analysis and findings of a<br />
financial affordability model.<br />
DRAFT<br />
10.1.2 PROJECT COST SUMMARY<br />
Project costs are currently estimated to be approximately $1.2 billion including<br />
design, project and construction management, and contingency costs. The total is<br />
in 2013 USD and does not include project financing or bond issuance costs that will<br />
be discussed separately. The general project scope includes the demolition of the<br />
existing building and apron, roads and other structures necessary to construct the<br />
first phase of a replacement terminal on the site of the existing <strong>Terminal</strong> A.<br />
The project components are allocated into four major areas: <strong>Terminal</strong>; Landside;<br />
Airside; and Central Utility Plant Modifications.<br />
<strong>Terminal</strong> $680,740,825<br />
Landside 319,761,975<br />
Civil Airside 203,235,630<br />
CUP Modifications 19,609,043<br />
Total $1,223,347,473<br />
Landrum & Brown Page 316<br />
April 2013
KANSAS CITY NEW TERMINAL STUDY<br />
ADVANCE TERMINAL PLANNING STUDY<br />
PROGRAM CRITERIA DOCUMENT<br />
DRAFT<br />
10.1.3 SOURCES OF FUNDING<br />
KCI is not in the position to self-fund a project of this scale and will rely on multiple<br />
sources to fund the costs associated with the new terminal project. The airport will<br />
provide some available cash to initially fund preliminary and reimbursable portions<br />
of the overall project. It is anticipated that a percentage of the project will be<br />
eligible for FAA Airport Improvement <strong>Program</strong> (AIP) grants. The two main areas of<br />
source funds will be through the collection of Passenger Facility Charges (PFCs) and<br />
through the issuance of new airport debt in the form of General Airport Revenue<br />
Bonds (GARBs). The debt service on these bonds will be allocated to airport cost<br />
centers and recovered through rates and charges. The financial affordability model<br />
created for KCI incorporates the necessary bond issuance and funding<br />
requirements.<br />
Airport Cash<br />
It is assumed that KCI will have approximately $60 million in cash reserve funds to<br />
initially cover expected reimbursable expenses associated with the terminal project.<br />
These funds are not intended to reduce the amount that will need to be borrowed<br />
through the issuance of GARBs but will be necessary to guarantee preliminary work.<br />
All cash paid out from available cash reserves is expected to be repaid to the fund<br />
upon issuance of new debt.<br />
AIP Grant Money<br />
The airport will be eligible for FAA AIP grant money for select portions of the total<br />
project that relate predominately to increasing capacity, improving safety and<br />
security, and addressing environmental concerns. The AIP grants are allocated to<br />
qualifying airport capital projects on a yearly basis and are dependent, in part,<br />
upon how much money is available in the FAA region’s annual budget. Eligible<br />
projects can receive grants for up to 75 percent of the estimated cost. The model<br />
makes the very conservative assumption of the receipt of $30 million of AIP grant<br />
monies.<br />
PFC Collections<br />
DRAFT<br />
The airlines currently collect a PFC of $4.50 per eligible enplaned passenger at KCI.<br />
It is assumed that there is currently a reserve of nearly $40 million which should<br />
grow to $46 million by the proposed start of the construction process in FY2016.<br />
Future PFC collections to be applied to the new terminal project were estimated at<br />
$250 million based on continuing PFC based terminal capital spending and debt<br />
obligations. The $250 million is reduced by the available $46 million to a total of<br />
$204 million that would be funded through the issuance of new PFC backed bonds.<br />
Throughout the repayment period of 30 years it is assumed that the PFC collection<br />
rate will remain constant at $4.50.<br />
Landrum & Brown Page 317<br />
April 2013
KANSAS CITY NEW TERMINAL STUDY<br />
ADVANCE TERMINAL PLANNING STUDY<br />
PROGRAM CRITERIA DOCUMENT<br />
DRAFT<br />
GARB Debt<br />
After considering the available funds from Airport cash, AIP Grants and PFC<br />
Collections, the remainder of the funding will need to come from GARBs.<br />
The GARBs are assumed to be issued in three separate tranches, one each year<br />
during the projected construction phase of FY2016 to FY2018. During these three<br />
phases, interest on the expensed capital will be capitalized and accrued for the<br />
bond issuances. In total, GARBs will be issued for approximately $1.2 billion in<br />
order to cover all of the expected costs after applying the available AIP and PFC<br />
funds. The conservative assumption for cost of capital is between 6.0 and 6.5<br />
percent.<br />
10.1.4 FINANCIAL MODEL METHODOLOGY AND ASSUMPTIONS<br />
The general concepts used in this affordability model assume that the airport will<br />
first replace the existing rates and charges agreement at KCI with a system residual<br />
model that recovers all net airport operational expenses and capital improvement<br />
expenses through landing fees, terminal rents and facility charges. The model<br />
assumes that the new terminal will be constructed by the end of FY2018 and be<br />
operational at the beginning of FY2019. The majority of financing will come from<br />
GARB and PFC bond offerings that will begin in FY2016. GARB offerings are<br />
projected to be done in three tranches (annually from FY2016-2018) with interest<br />
capitalized until FY2019 when the new terminal opens. New PFC debt service<br />
payments are scheduled to begin in FY2017, and the residual funds in the existing<br />
PFC reserve fund will be used first in the construction process to meet early<br />
planning and design financial requirements.<br />
DRAFT<br />
The model assumes a continuation of existing revenue and expense streams that<br />
are both scheduled to grow at a modest rate of 3 percent annually. Capital<br />
improvement projects currently scheduled in the 5 Year capital improvement<br />
program (CIP) to maintain the existing airfield and terminals are incorporated into<br />
the model and future baseline expenditure levels are assumed for the new terminal<br />
beginning in FY2019. CIP expenditures of the new terminal are set to increase at<br />
the same 3 percent growth rate beginning in FY2020. Starting in FY2019, terminal<br />
concession revenues are assumed to increase 200 percent because of the improved<br />
terminal concession layout. Operating and maintenance (O&M) expenses are<br />
expected to be reduced by approximately 15 percent with a new and more efficient<br />
terminal design.<br />
The airline cost per enplanement (CPE) calculation includes landing fees, terminal<br />
rents, boarding bridge fees, and airline prepaid expenses. Annual landed weight<br />
and enplanement figures are provided in the 2012 Kansas City International Airport<br />
Master Plan Forecast update. The CPE was used as the barometer for affordability<br />
and compared to other medium hub airports CPE levels.<br />
Landrum & Brown Page 318<br />
April 2013
KANSAS CITY NEW TERMINAL STUDY<br />
ADVANCE TERMINAL PLANNING STUDY<br />
PROGRAM CRITERIA DOCUMENT<br />
DRAFT<br />
Affordability Model Assumptions<br />
General<br />
• Baseline Project Costing equal to $1.2 billion<br />
• Airport will open for operations at the beginning of 2019<br />
• Base Cost Center allocations are 83.4% <strong>Terminal</strong> & Landside and 16.6%<br />
Airfield<br />
• New System Residual Lease Agreement to begin in FY2015<br />
• All Costs, Revenues and Expenses grown at the same inflation growth rates<br />
(2% in 2012-2013, 3% annually thereafter)<br />
• 2012 Airport Cash Reserve estimated at $60 million for modeling purposes<br />
• 2012 PFC reserves estimated at $40 million or modeling purposes<br />
• Operations and Passengers forecasts will be adequately realized<br />
• PFC collection rate held constant at $4.50 per enplanement<br />
Financing<br />
• Three annual capital expenditure phases (2016, 2017, 2018)<br />
• Capital Expenditures will be nearly equal during each year<br />
• Capitalized Interest will accrue during each year<br />
• Cost of Capital will increase during construction (6.0% in FY2016, 6.25% in<br />
FY2017 and 6.5% in FY2018)<br />
• Bond durations for each issuance amortized over 29, 28 and 27 years<br />
• Projected PFC bond proceeds equal to approximately $204 million<br />
• PFC Cash Reserves will be used in the first year of Capital Expenses to reduce<br />
required PFC Bond amount<br />
• $30 million in AIP grant monies expected from FAA<br />
• PFC bond proceeds and AIP grant monies reduce total GARB requirement<br />
Revenues<br />
• 200% increase in terminal concession revenues when new <strong>Terminal</strong> opens<br />
O&M Expenses<br />
DRAFT<br />
• 15% reduction in terminal O&M costs when new <strong>Terminal</strong> opens<br />
• MCI 5 year capital improvement plan estimated outlays incorporated into the<br />
model<br />
• CIP beginning in FY2017 starts at $12 million and increases annually at 3%<br />
• Capital improvement totals allocated at 50% each to the Airfield and<br />
<strong>Terminal</strong> cost centers<br />
Landrum & Brown Page 319<br />
April 2013
KANSAS CITY NEW TERMINAL STUDY<br />
ADVANCE TERMINAL PLANNING STUDY<br />
PROGRAM CRITERIA DOCUMENT<br />
DRAFT<br />
10.2 Determinations of Affordability<br />
10.2.1 DEBT PAYMENTS<br />
The annual debt service payments in the model are a combination of the PFC bonds<br />
and GARBs. The annual PFC debt service payment is projected to increase from<br />
$10 million in FY2016 to approximately $25 million in FY2017 after the issuance of<br />
$204 million in PFC backed public bonds. The annual GARB debt service payment is<br />
projected to increase from $22 million in FY2018 to $109 million in 2019 with the<br />
beginning of payments on the new GARB debt (including capitalized interest) of<br />
approximately $1.2 billion. The total outstanding debt for the Kansas City<br />
International Airport in 2019 is expected to reach nearly $1.55 billion.<br />
10.2.2 CPE COMPARISON<br />
Cost per enplanement (CPE) is a common measure of costs to the airlines and thus<br />
relevant to the determination of affordability for a large scale project such as the<br />
construction of new terminal and associated facilities. In 2010, CPE at the Airport<br />
was $4.96 and was near the bottom in cost comparison to other medium hub<br />
airports. The low average cost can be attributed mainly to the age of the existing<br />
terminals and the current rates and charges agreement. In contrast, airports with<br />
newly renovated or newly built terminals are situated toward the right of the<br />
following comparison chart.<br />
Airline Cost per Enplanement<br />
$20.00<br />
$18.00<br />
$16.00<br />
$14.00<br />
$12.00<br />
$10.00<br />
$8.00<br />
$6.00<br />
2010 Medium Hub CPE<br />
(derived from FAA CATS Form 127)<br />
DRAFT<br />
$4.00<br />
$2.00<br />
$-<br />
Sources:<br />
FAA CATS Form 127, Landrum & Brown analysis<br />
Landrum & Brown Page 320<br />
April 2013
KANSAS CITY NEW TERMINAL STUDY<br />
ADVANCE TERMINAL PLANNING STUDY<br />
PROGRAM CRITERIA DOCUMENT<br />
DRAFT<br />
Recent examples of large scale terminal projects have been constructed at<br />
Indianapolis International Airport (IND), San Jose International Airport (SJC) and<br />
Sacramento International Airport (SMF). Each of these airports with new terminals<br />
has an average CPE value of between $11 and $12. The next chart presents the<br />
expected CPE range for the same group of medium hub airports for 2019.<br />
The same new terminal airports are expected to show increasing CPE into the $14<br />
range; and MCI is projected to jump up to nearly $19 with the construction of the<br />
planned $1.2 billion terminal project using the conservative assumptions discussed<br />
above.<br />
$25.00<br />
Projected 2019 Medium Hub CPE<br />
(derived from 2010 FAA CATS Form 127, + 3% AAGR)<br />
Airline Cost per Enplanement<br />
$20.00<br />
$15.00<br />
$10.00<br />
Sources:<br />
$5.00<br />
$-<br />
Medium Hub<br />
Average CPE = $11.72<br />
DRAFT<br />
FAA CATS Form 127, Landrum & Brown analysis<br />
Landrum & Brown Page 321<br />
April 2013
DRAFT