

Merrill Lynch International Investment Funds Audited Annual Report ...
Merrill Lynch International Investment Funds Audited Annual Report ...
Merrill Lynch International Investment Funds Audited Annual Report ...

Create successful ePaper yourself
Turn your PDF publications into a flip-book with our unique Google optimized e-Paper software.
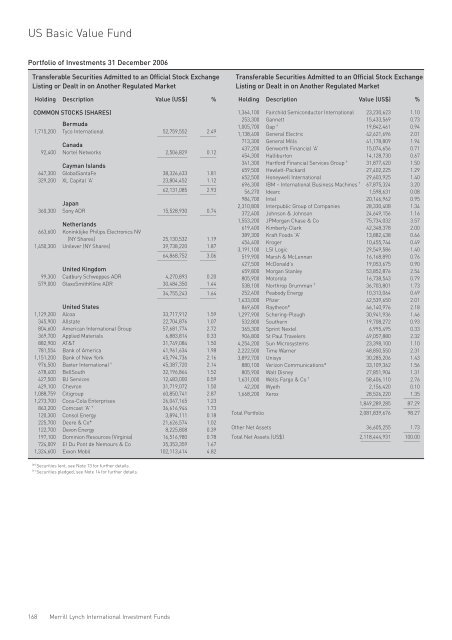
US Basic Value Fund<br />
Portfolio of <strong>Investment</strong>s 31 December 2006<br />
Transferable Securities Admitted to an Official Stock Exchange<br />
Listing or Dealt in on Another Regulated Market<br />
Holding Description Value (US$) %<br />
COMMON STOCKS (SHARES)<br />
Bermuda<br />
1,715,200 Tyco <strong>International</strong><br />
___________<br />
52,759,552<br />
______<br />
2.49<br />
Canada<br />
92,400 Nortel Networks<br />
___________<br />
2,506,829<br />
______<br />
0.12<br />
Cayman Islands<br />
647,300 GlobalSantaFe 38,326,633 1.81<br />
329,200 XL Capital 'A'<br />
___________<br />
23,804,452<br />
______<br />
1.12<br />
___________<br />
62,131,085<br />
______<br />
2.93<br />
Japan<br />
360,300 Sony ADR<br />
___________<br />
15,528,930<br />
______<br />
0.74<br />
Netherlands<br />
663,600 Koninklijke Philips Electronics NV<br />
(NY Shares) 25,130,532 1.19<br />
1,450,300 Unilever (NY Shares)<br />
___________<br />
39,738,220<br />
______<br />
1.87<br />
___________<br />
64,868,752<br />
______<br />
3.06<br />
United Kingdom<br />
99,300 Cadbury Schweppes ADR 4,270,893 0.20<br />
579,000 GlaxoSmithKline ADR<br />
___________<br />
30,484,350<br />
______<br />
1.44<br />
___________<br />
34,755,243<br />
______<br />
1.64<br />
United States<br />
1,129,200 Alcoa 33,717,912 1.59<br />
345,900 Allstate 22,704,876 1.07<br />
804,600 American <strong>International</strong> Group 57,681,774 2.72<br />
369,700 Applied Materials 6,883,814 0.33<br />
882,900 AT&T 31,749,084 1.50<br />
781,554 Bank of America 41,961,634 1.98<br />
1,151,200 Bank of New York 45,794,736 2.16<br />
976,500 Baxter <strong>International</strong> † 45,387,720 2.14<br />
678,400 BellSouth 32,196,864 1.52<br />
427,500 BJ Services 12,483,000 0.59<br />
429,100 Chevron 31,719,072 1.50<br />
1,088,759 Citigroup 60,850,741 2.87<br />
1,273,700 Coca-Cola Enterprises 26,047,165 1.23<br />
863,200 Comcast 'A' † 36,616,944 1.73<br />
120,300 Consol Energy 3,894,111 0.18<br />
225,700 Deere & Co* 21,626,574 1.02<br />
122,700 Devon Energy 8,225,808 0.39<br />
197,100 Dominion Resources (Virginia) 16,516,980 0.78<br />
724,009 EI Du Pont de Nemours & Co 35,353,359 1.67<br />
1,324,600 Exxon Mobil 102,113,414 4.82<br />
Transferable Securities Admitted to an Official Stock Exchange<br />
Listing or Dealt in on Another Regulated Market<br />
Holding Description Value (US$) %<br />
1,364,100 Fairchild Semiconductor <strong>International</strong> 23,230,623 1.10<br />
253,300 Gannett 15,433,569 0.73<br />
1,005,700 Gap † 19,842,461 0.94<br />
1,138,400 General Electric 42,621,696 2.01<br />
713,300 General Mills 41,178,809 1.94<br />
437,200 Genworth Financial 'A' 15,074,656 0.71<br />
454,300 Halliburton 14,128,730 0.67<br />
341,300 Hartford Financial Services Group † 31,877,420 1.50<br />
659,500 Hewlett-Packard 27,402,225 1.29<br />
652,500 Honeywell <strong>International</strong> 29,603,925 1.40<br />
696,300 IBM – <strong>International</strong> Business Machines † 67,875,324 3.20<br />
56,270 Idearc 1,598,631 0.08<br />
984,700 Intel 20,146,962 0.95<br />
2,310,800 Interpublic Group of Companies 28,330,408 1.34<br />
372,400 Johnson & Johnson 24,649,156 1.16<br />
1,553,200 JPMorgan Chase & Co 75,734,032 3.57<br />
619,400 Kimberly-Clark 42,348,378 2.00<br />
389,300 Kraft Foods 'A' 13,882,438 0.66<br />
454,400 Kroger 10,455,744 0.49<br />
3,191,100 LSI Logic 29,549,586 1.40<br />
519,900 Marsh & McLennan 16,168,890 0.76<br />
427,500 McDonald's 19,053,675 0.90<br />
659,800 Morgan Stanley 53,852,876 2.54<br />
805,900 Motorola 16,738,543 0.79<br />
538,100 Northrop Grumman † 36,703,801 1.73<br />
252,400 Peabody Energy 10,313,064 0.49<br />
1,633,000 Pfizer 42,539,650 2.01<br />
869,600 Raytheon* 46,140,976 2.18<br />
1,297,900 Schering-Plough 30,941,936 1.46<br />
532,800 Southern 19,708,272 0.93<br />
365,300 Sprint Nextel 6,995,495 0.33<br />
906,800 St Paul Travelers 49,057,880 2.32<br />
4,254,200 Sun Microsystems 23,398,100 1.10<br />
2,222,500 Time Warner 48,850,550 2.31<br />
3,892,700 Unisys 30,285,206 1.43<br />
880,100 Verizon Communications* 33,109,362 1.56<br />
805,900 Walt Disney 27,851,904 1.31<br />
1,631,000 Wells Fargo & Co † 58,406,110 2.76<br />
42,200 Wyeth 2,156,420 0.10<br />
1,668,200 Xerox<br />
___________<br />
28,526,220<br />
______<br />
1.35<br />
1,849,289,285<br />
___________ ______<br />
87.29<br />
Total Portfolio 2,081,839,676 98.27<br />
Other Net Assets<br />
___________<br />
36,605,255<br />
______<br />
1.73<br />
Total Net Assets (US$) 2,118,444,931<br />
___________ ______<br />
100.00<br />
( * ) Securities lent, see Note 13 for further details.<br />
(†) Securities pledged, see Note 14 for further details.<br />
168 <strong>Merrill</strong> <strong>Lynch</strong> <strong>International</strong> <strong>Investment</strong> <strong>Funds</strong>


