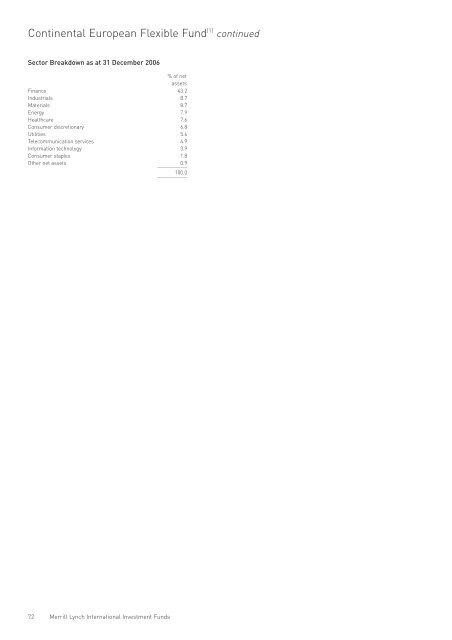
Continental European Flexible Fund (1) continued Sector Breakdown as at 31 December 2006 % of net assets Finance 43.2 Industrials 8.7 Materials 8.7 Energy 7.9 Healthcare 7.6 Consumer discretionary 6.8 Utilities 5.6 Telecommunication services 4.9 Information technology 3.9 Consumer staples 1.8 Other net assets ___________ 0.9 ___________ 100.0 72 <strong>Merrill</strong> <strong>Lynch</strong> <strong>International</strong> <strong>Investment</strong> <strong>Funds</strong>
Emerging Europe Fund Portfolio of <strong>Investment</strong>s 31 December 2006 Transferable Securities Admitted to an Official Stock Exchange Listing or Dealt in on Another Regulated Market Holding Description Value (€) % FUNDS United Kingdom 615,000 Ukraine Opportunity Trust 5,014,981 0.10 39,352,650 Black Sea Property Fund ___________ 10,988,268 ______ 0.22 Total <strong>Funds</strong> ___________ 16,003,249 ______ 0.32 COMMON / PREFERRED STOCKS (SHARES) & WARRANTS Austria 2,025,000 SkyEurope Holding ___________ 5,771,250 ______ 0.12 Bermuda 20,397,300 West Siberian Resources – SDR ___________ 16,469,267 ______ 0.33 Cayman Islands 4,082,802 Kingdom Hotel <strong>Investment</strong>s GDR ___________ 26,944,078 ______ 0.55 Cyprus 7,512,539 Urals Energy Public 38,597,557 0.78 1,262,500 XXI Century <strong>Investment</strong>s Public ___________ 13,348,846 ______ 0.27 ___________ 51,946,403 ______ 1.05 Egypt 600,000 Commercial <strong>International</strong> Bank GDR 4,460,290 0.09 256,814 Orascom Construction Industries GDR ___________ 18,759,909 ______ 0.38 ___________ 23,220,199 ______ 0.47 Georgia 560,319 Bank of Georgia GDR ___________ 9,563,208 ______ 0.19 Hungary 1,563,341 MOL Hungarian Oil & Gas 134,254,021 2.73 140,630 MOL Hungarian Oil & Gas ADR 12,107,642 0.24 8,588,147 OTP Bank 298,763,374 6.07 262,180 OTP Bank GDR ___________ 18,237,052 ______ 0.37 ___________ 463,362,089 ______ 9.41 Israel 1,149,002 Africa Israel <strong>Investment</strong>s 65,852,960 1.34 8,300,071 Bank Hapoalim 29,619,554 0.60 2,000,000 Teva Pharmaceutical Industries ADR ___________ 47,227,490 ______ 0.96 ___________ 142,700,004 ______ 2.90 Jersey 836,600 Trader Media East GDR ___________ 6,346,052 ______ 0.13 Kazakhstan 2,000,000 Halyk Savings Bank Kazakhstan GDR 33,376,318 0.68 2,668,080 Kazkommertsbank GDR ___________ 46,751,610 ______ 0.95 ___________ 80,127,928 ______ 1.63 Malaysia 2,450,000 Steppe Cement ___________ 8,391,661 ______ 0.17 Poland 234,000 Bank Pekao 13,766,941 0.28 793,642 Bank Zachodni WBK 46,547,591 0.95 314,454 BRE Bank 27,336,506 0.56 2,640,130 Getin Holding 8,595,632 0.17 271,757 Grupa Kety 14,118,160 0.29 180,505 IDMSA.PL 3,350,112 0.07 Transferable Securities Admitted to an Official Stock Exchange Listing or Dealt in on Another Regulated Market Holding Description Value (€) % 1,214,857 KGHM Polska Miedz 28,342,506 0.58 5,150,468 Polski Koncern Naftowy Orlen 63,704,917 1.29 5,000,000 Powszechna Kasa Oszczednosci Bank Polski 61,231,241 1.24 9,579,286 Telekomunikacja Polska _____________ 61,302,006 _____ 1.24 _____________ 328,295,612 _____ 6.67 Russian Federation 7,236,750 AFK Sistema GDR 175,662,596 3.57 2,156,547 Evraz Group GDR 42,025,102 0.85 445,558 Lebedyansky 'CLS' 27,038,337 0.55 2,772,146 LUKOIL ADR 183,786,362 3.73 457,447 MMC Norilsk Nickel 54,478,631 1.11 1,971,219 MMC Norilsk Nickel ADR 236,253,206 4.80 3,976,980 Mobile Telesystems ADR 152,225,147 3.09 2,447,310 NLMK – Novolipetsk Steel GDR 43,161,615 0.88 5,281,030 NovaTek OAO GDR 254,377,156 5.17 9,231,500 OAO Gazprom 80,529,659 1.64 3,138,890 OAO Gazprom ADR 109,526,618 2.22 3,273,700 OAO Rosneft GDR 23,466,938 0.48 90,000,000 OGK-3 'CLS' 8,363,043 0.17 1,828,193 Polyus Gold ADR 67,258,864 1.37 956,130 Polyus Gold 'CLS' 35,756,056 0.73 67,910 Sberbank 177,720,928 3.61 2,554,000 Sberbank 'CLS' (Pref) 111,009,785 2.25 1,293,657 Seventh Continent 'CLS' 26,200,897 0.53 108,110 Severstal GDR 914,380 0.02 1,231,840 Sistema Hals GDR 12,427,727 0.25 2,081,820 Surgutneftegaz ADR 121,596,101 2.47 1,202,321 Surgutneftegaz ADR (Pref) 100,094,614 2.03 4,400,000 TMK OAO 27,368,581 0.55 258,500 TMK OAO GDR 6,863,005 0.14 30,880 Transneft (Pref) 53,758,325 1.09 910,800 Unified Energy System GDR 75,721,520 1.54 2,728,033 Unified Energy System GDR 226,801,500 4.60 727,910 Uralsvyazinform ADR 7,454,134 0.15 2,265,640 Vimpel-Communications ADR 137,488,584 2.79 850,000 Vozrozhdeniye Bank 'CLS' 36,751,878 0.75 91,000 Vsmpo-Avisma _____________ 20,225,290 _____ 0.41 _____________ 2,636,306,579 _____ 53.54 Turkey 4,194,650 Adana Cimento 'A' 17,567,797 0.36 4,300,000 Aksigorta 12,352,340 0.25 3,071,714 Alarko Holding 5,904,605 0.12 21,814,080 Dogan Sirketler Grubu Holdings 26,119,736 0.53 3,988,474 Dogus Otomotiv Servis ve Ticaret 12,206,993 0.25 10,778,856 Enka Insaat ve Sanayi 87,392,996 1.77 17,793,083 Haci Omer Sabanci Holding 53,023,843 1.08 16,787,447 Is Gayrimenkul Yatirim Ortakligi 26,140,246 0.53 400,000 Koza Davetiyeleri Imalat Ithalat ve Ihracat 2,598,797 0.05 2,808,655 Petrol Ofisi 6,907,023 0.14 5,034,973 Sekerbank TAS 12,868,594 0.26 4,945,000 Trakya Cam Sanayi 10,355,186 0.21 3,237,649 Tupras Turkiye Petrol Rafine 42,069,964 0.85 4,172,023 Turk Hava Yollari 13,664,808 0.28 20,580,500 Turkcell Iletisim Hizmet 79,011,258 1.60 11,671,240 Turkiye Sinai Kalkinma Bankasi 16,168,276 0.33 38,142,940 Turkiye Vakiflar Bankasi Tao 'D' 136,195,520 2.77 8,547,437 Vestel Beyaz Esya Sanayi ve Ticaret _____________ 9,867,369 _____ 0.20 _____________ 570,415,351 _____ 11.58 The notes on pages 213 to 219 form an integral part of these financial statements. <strong>Audited</strong> <strong>Annual</strong> <strong>Report</strong> and Accounts 73