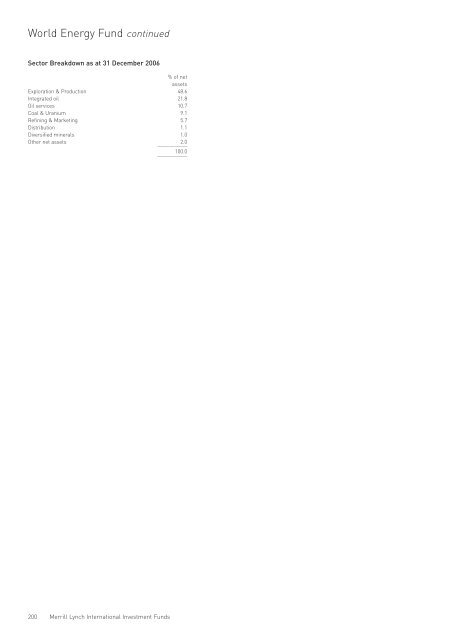
World Energy Fund continued Sector Breakdown as at 31 December 2006 % of net assets Exploration & Production 48.6 Integrated oil 21.8 Oil services 10.7 Coal & Uranium 9.1 Refining & Marketing 5.7 Distribution 1.1 Diversified minerals 1.0 Other net assets ___________ 2.0 ___________ 100.0 200 <strong>Merrill</strong> <strong>Lynch</strong> <strong>International</strong> <strong>Investment</strong> <strong>Funds</strong>
World Financials Fund Portfolio of <strong>Investment</strong>s 31 December 2006 Transferable Securities Admitted to an Official Stock Exchange Listing or Dealt in on Another Regulated Market Holding Description Value (US$) % COMMON STOCKS (SHARES) Belgium 41,575 Fortis 1,778,967 0.57 4,300 KBC Groep ___________ 524,038 ______ 0.17 ___________ 2,303,005 ______ 0.74 Bermuda 12,700 Everest Re Group 1,254,760 0.40 2,028,100 Hopson Development Holdings 5,740,300 1.84 82,500 RenaissanceRe Holdings ___________ 4,969,800 ______ 1.60 ___________ 11,964,860 ______ 3.84 Cayman Islands 159,200 ACE 9,679,360 3.10 4,959,000 China Resources Land ___________ 5,939,724 ______ 1.91 ___________ 15,619,084 ______ 5.01 China 4,800,100 Beijing Capital Land 'H' 2,457,853 0.79 1,012,000 Industrial & Commercial Bank of China 'H' 628,854 0.20 11,343,900 Shanghai Forte Land 'H' ___________ 5,078,835 ______ 1.63 ___________ 8,165,542 ______ 2.62 Denmark 74,600 Danske Bank ___________ 3,304,855 ______ 1.06 Egypt 86,400 Commercial <strong>International</strong> Bank ___________ 877,673 ______ 0.28 France 119,500 AXA 4,845,531 1.55 42,400 BNP Paribas ___________ 4,641,867 ______ 1.49 ___________ 9,487,398 ______ 3.04 Germany 51,701 Hannover Rueckversicherung ___________ 2,390,813 ______ 0.77 India 62,100 ICICI Bank ___________ 1,251,687 ______ 0.40 Indonesia 2,280,200 Bank Central Asia 1,318,313 0.42 3,014,500 Bank Mandiri Persero ___________ 971,976 ______ 0.31 ___________ 2,290,289 ______ 0.73 Ireland 105,000 Allied Irish Banks ___________ 3,130,899 ______ 1.00 Japan 185,000 Daiichi Commodities 1,164,496 0.37 117,600 Japan General Estate 3,384,529 1.08 100 Mitsubishi UFJ Financial Group 1,237,035 0.40 43,900 Nomura Holdings 829,365 0.27 130 Sumitomo Mitsui Financial Group 1,334,652 0.43 57,800 Sumitomo Real Estate Sales 4,401,910 1.41 373 Sunwood 825,523 0.26 254,000 Takagi Securities 1,049,494 0.34 408,500 Toyo Securities ___________ 1,639,741 ______ 0.53 ___________ 15,866,745 ______ 5.09 Transferable Securities Admitted to an Official Stock Exchange Listing or Dealt in on Another Regulated Market Holding Description Value (US$) % Netherlands 85,600 ING Groep – CVA ___________ 3,807,203 ______ 1.22 South Korea 267,400 Daegu Bank 4,573,658 1.47 226,900 Dongbu Insurance 6,041,084 1.94 60,239 Hana Financial Group 3,168,778 1.02 98,800 Industrial Bank of Korea 1,822,746 0.58 57,600 Kookmin Bank 4,640,977 1.49 532,612 Korean Reinsurance 7,276,454 2.33 879,400 Meritz Fire & Marine Insurance 6,007,107 1.93 108,000 Shinhan Financial Group ___________ 5,518,519 ______ 1.77 ___________ 39,049,323 ______ 12.53 Spain 303,400 Banco Santander Central Hispano ___________ 5,627,258 ______ 1.80 Switzerland 101,000 UBS ___________ 6,126,732 ______ 1.97 Turkey 249,450 Akbank ___________ 1,518,560 ______ 0.49 United Kingdom 341,300 Barclays 4,891,029 1.57 247,100 HSBC Holdings 4,516,099 1.45 250,300 Kensington Group 3,881,763 1.24 277,200 Lloyds TSB Group 3,109,929 1.00 162,800 Northern Rock 3,764,790 1.21 290,800 Provident Financial ___________ 4,004,637 ______ 1.28 ___________ 24,168,247 ______ 7.75 United States 58,800 Affiliated Managers Group 6,170,472 1.98 71,090 Allstate 4,666,348 1.50 74,242 American Express 4,544,353 1.46 147,950 American Home Mortgage <strong>Investment</strong> (Reit) 5,209,319 1.67 204,229 American <strong>International</strong> Group 14,641,177 4.70 306,159 Bank of America 16,437,677 5.27 75,370 Capital One Financial 5,853,988 1.88 299,443 Citigroup 16,735,869 5.37 2,600 Equity Office Properties Trust (Reit) 125,164 0.04 80,300 Fannie Mae 4,814,788 1.54 89,061 Hartford Financial Services Group 8,318,297 2.67 279,300 JPMorgan Chase & Co 13,618,668 4.37 66,100 Lehman Brothers Holdings 5,178,935 1.66 59,169 Prudential Financial 5,084,392 1.63 205,246 Wachovia ___________ 11,758,543 ______ 3.77 ___________ 123,157,990 ______ 39.51 Total Portfolio 280,108,163 89.85 Other Net Assets ___________ 31,643,955 ______ 10.15 Total Net Assets (US$) ___________ 311,752,118 ______ 100.00 The notes on pages 213 to 219 form an integral part of these financial statements. <strong>Audited</strong> <strong>Annual</strong> <strong>Report</strong> and Accounts 201